Stooke Small Bodies Maps
Stooke Small Bodies Maps
This data set collects the maps of small solar system bodies prepared
by Phil Stooke of the University of Western Ontario. Two hundred map
sheets are included, some based on photomosaics from spacecraft images
and some based on shaded relief maps prepared from spacecraft images.
The information in this browse facility was provided to PDS by
Phil Stooke.
Also available are a summary of the map projections
, an index of the maps listing the relevant
parameters in table form, and the label describing
the format and content of the index.
These maps are in the public domain but should not be used without
proper credit being given to the original producers of these data sets.
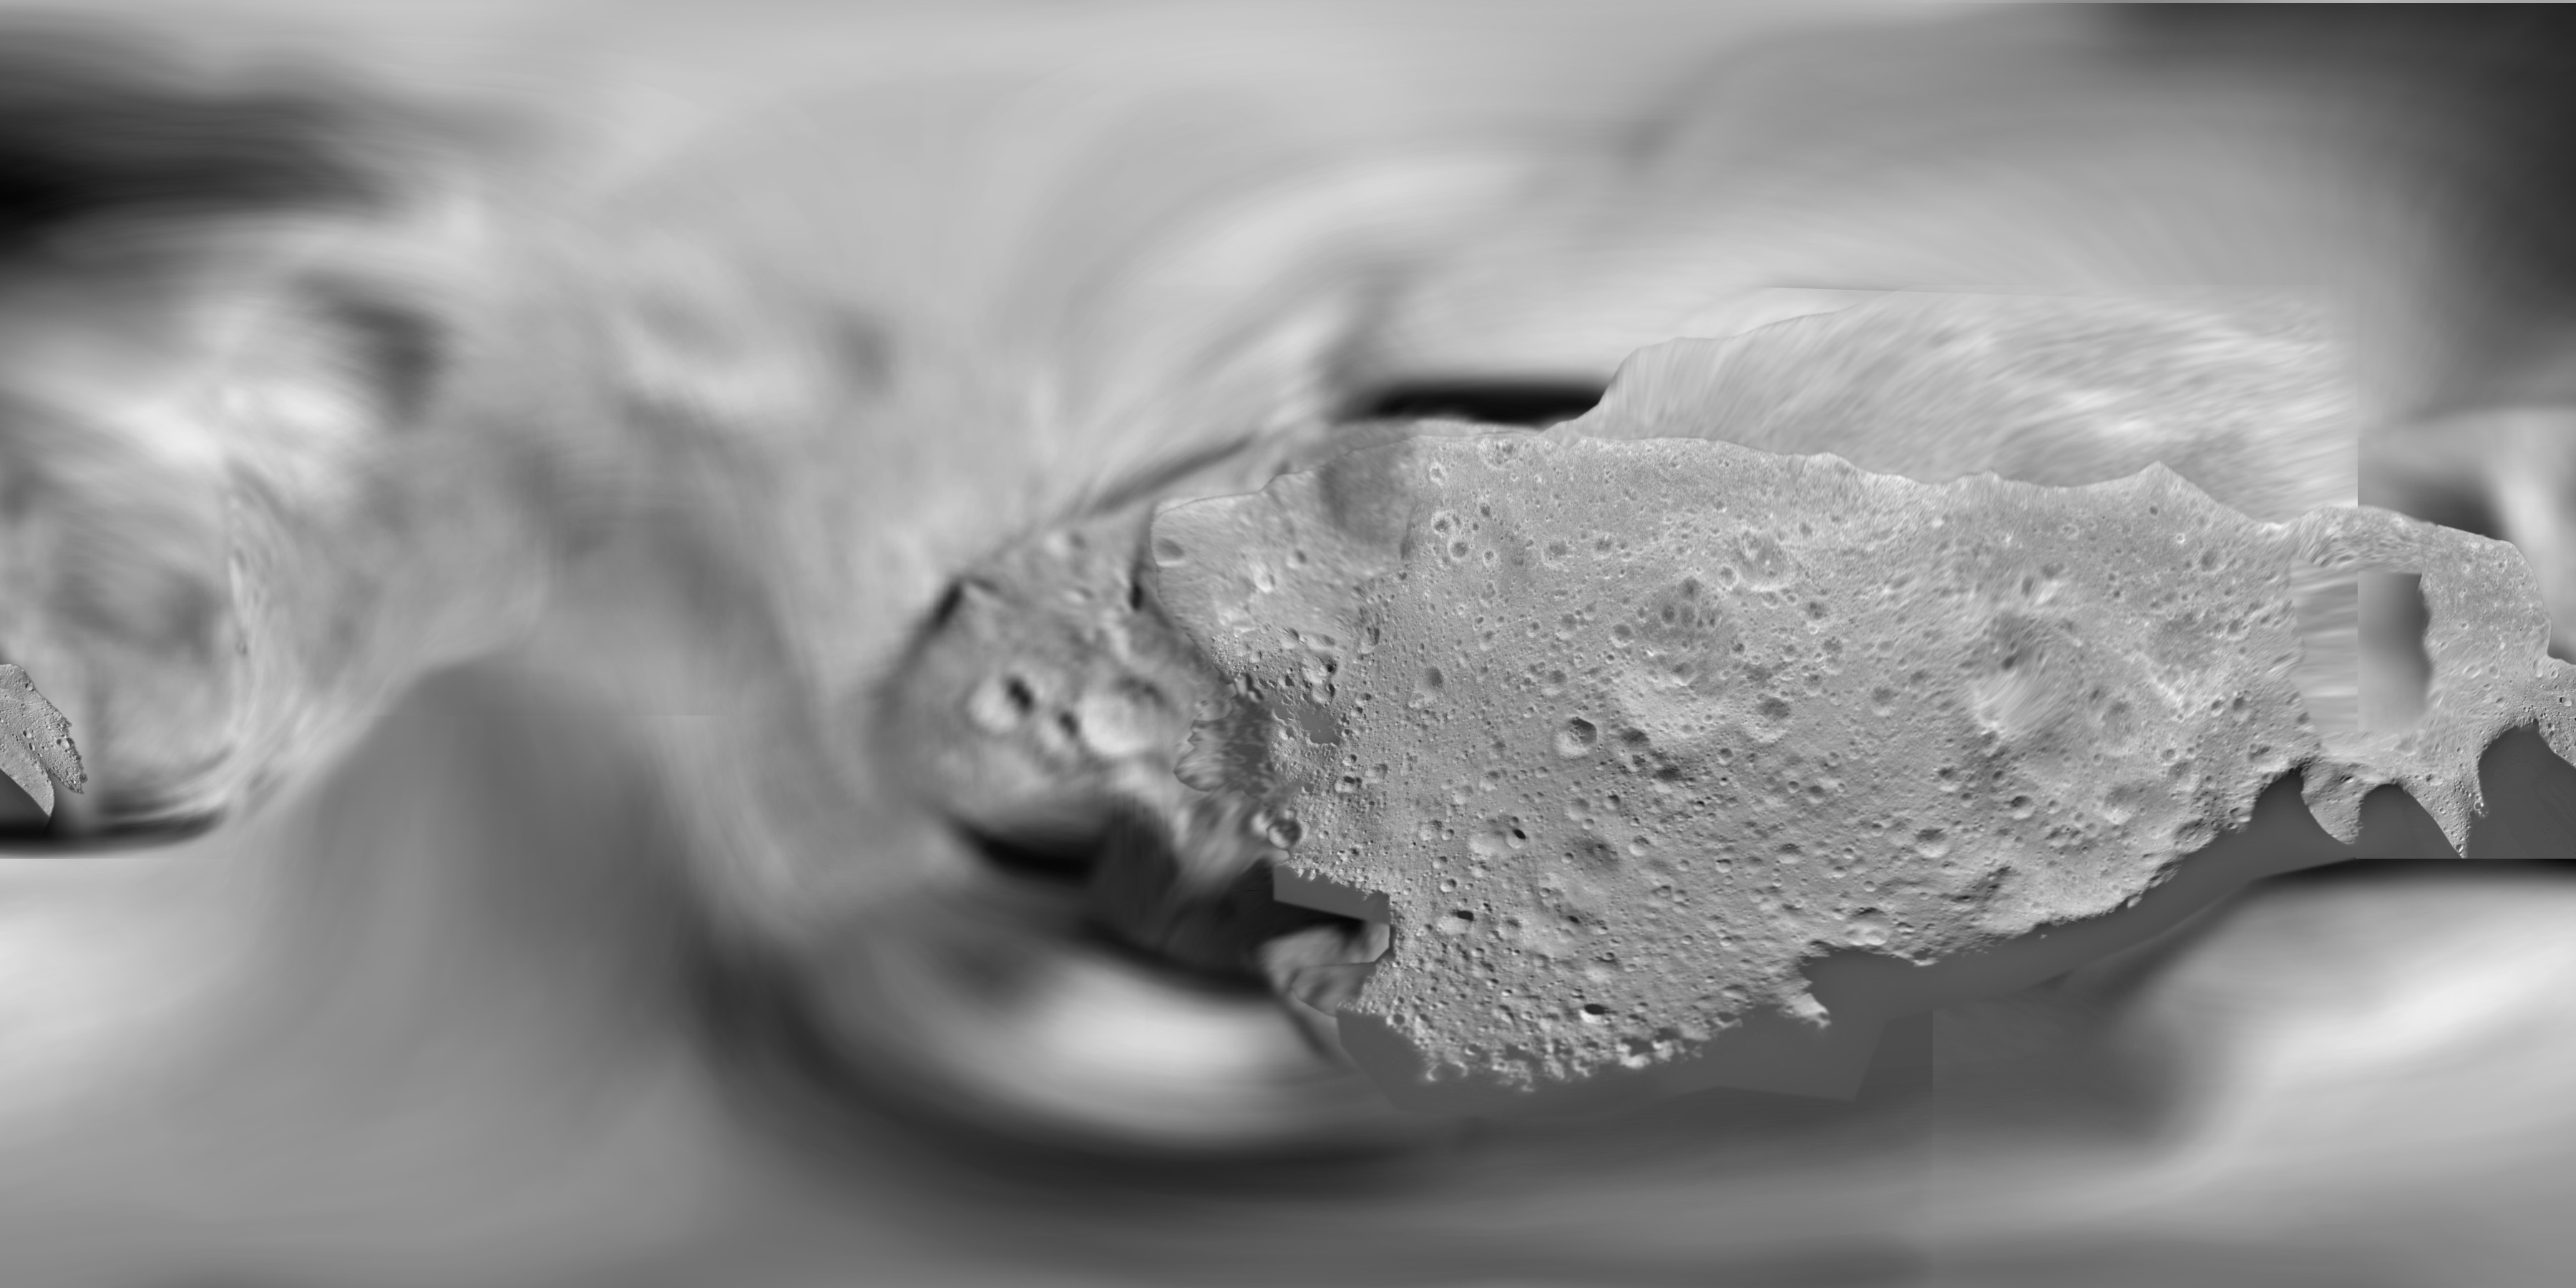
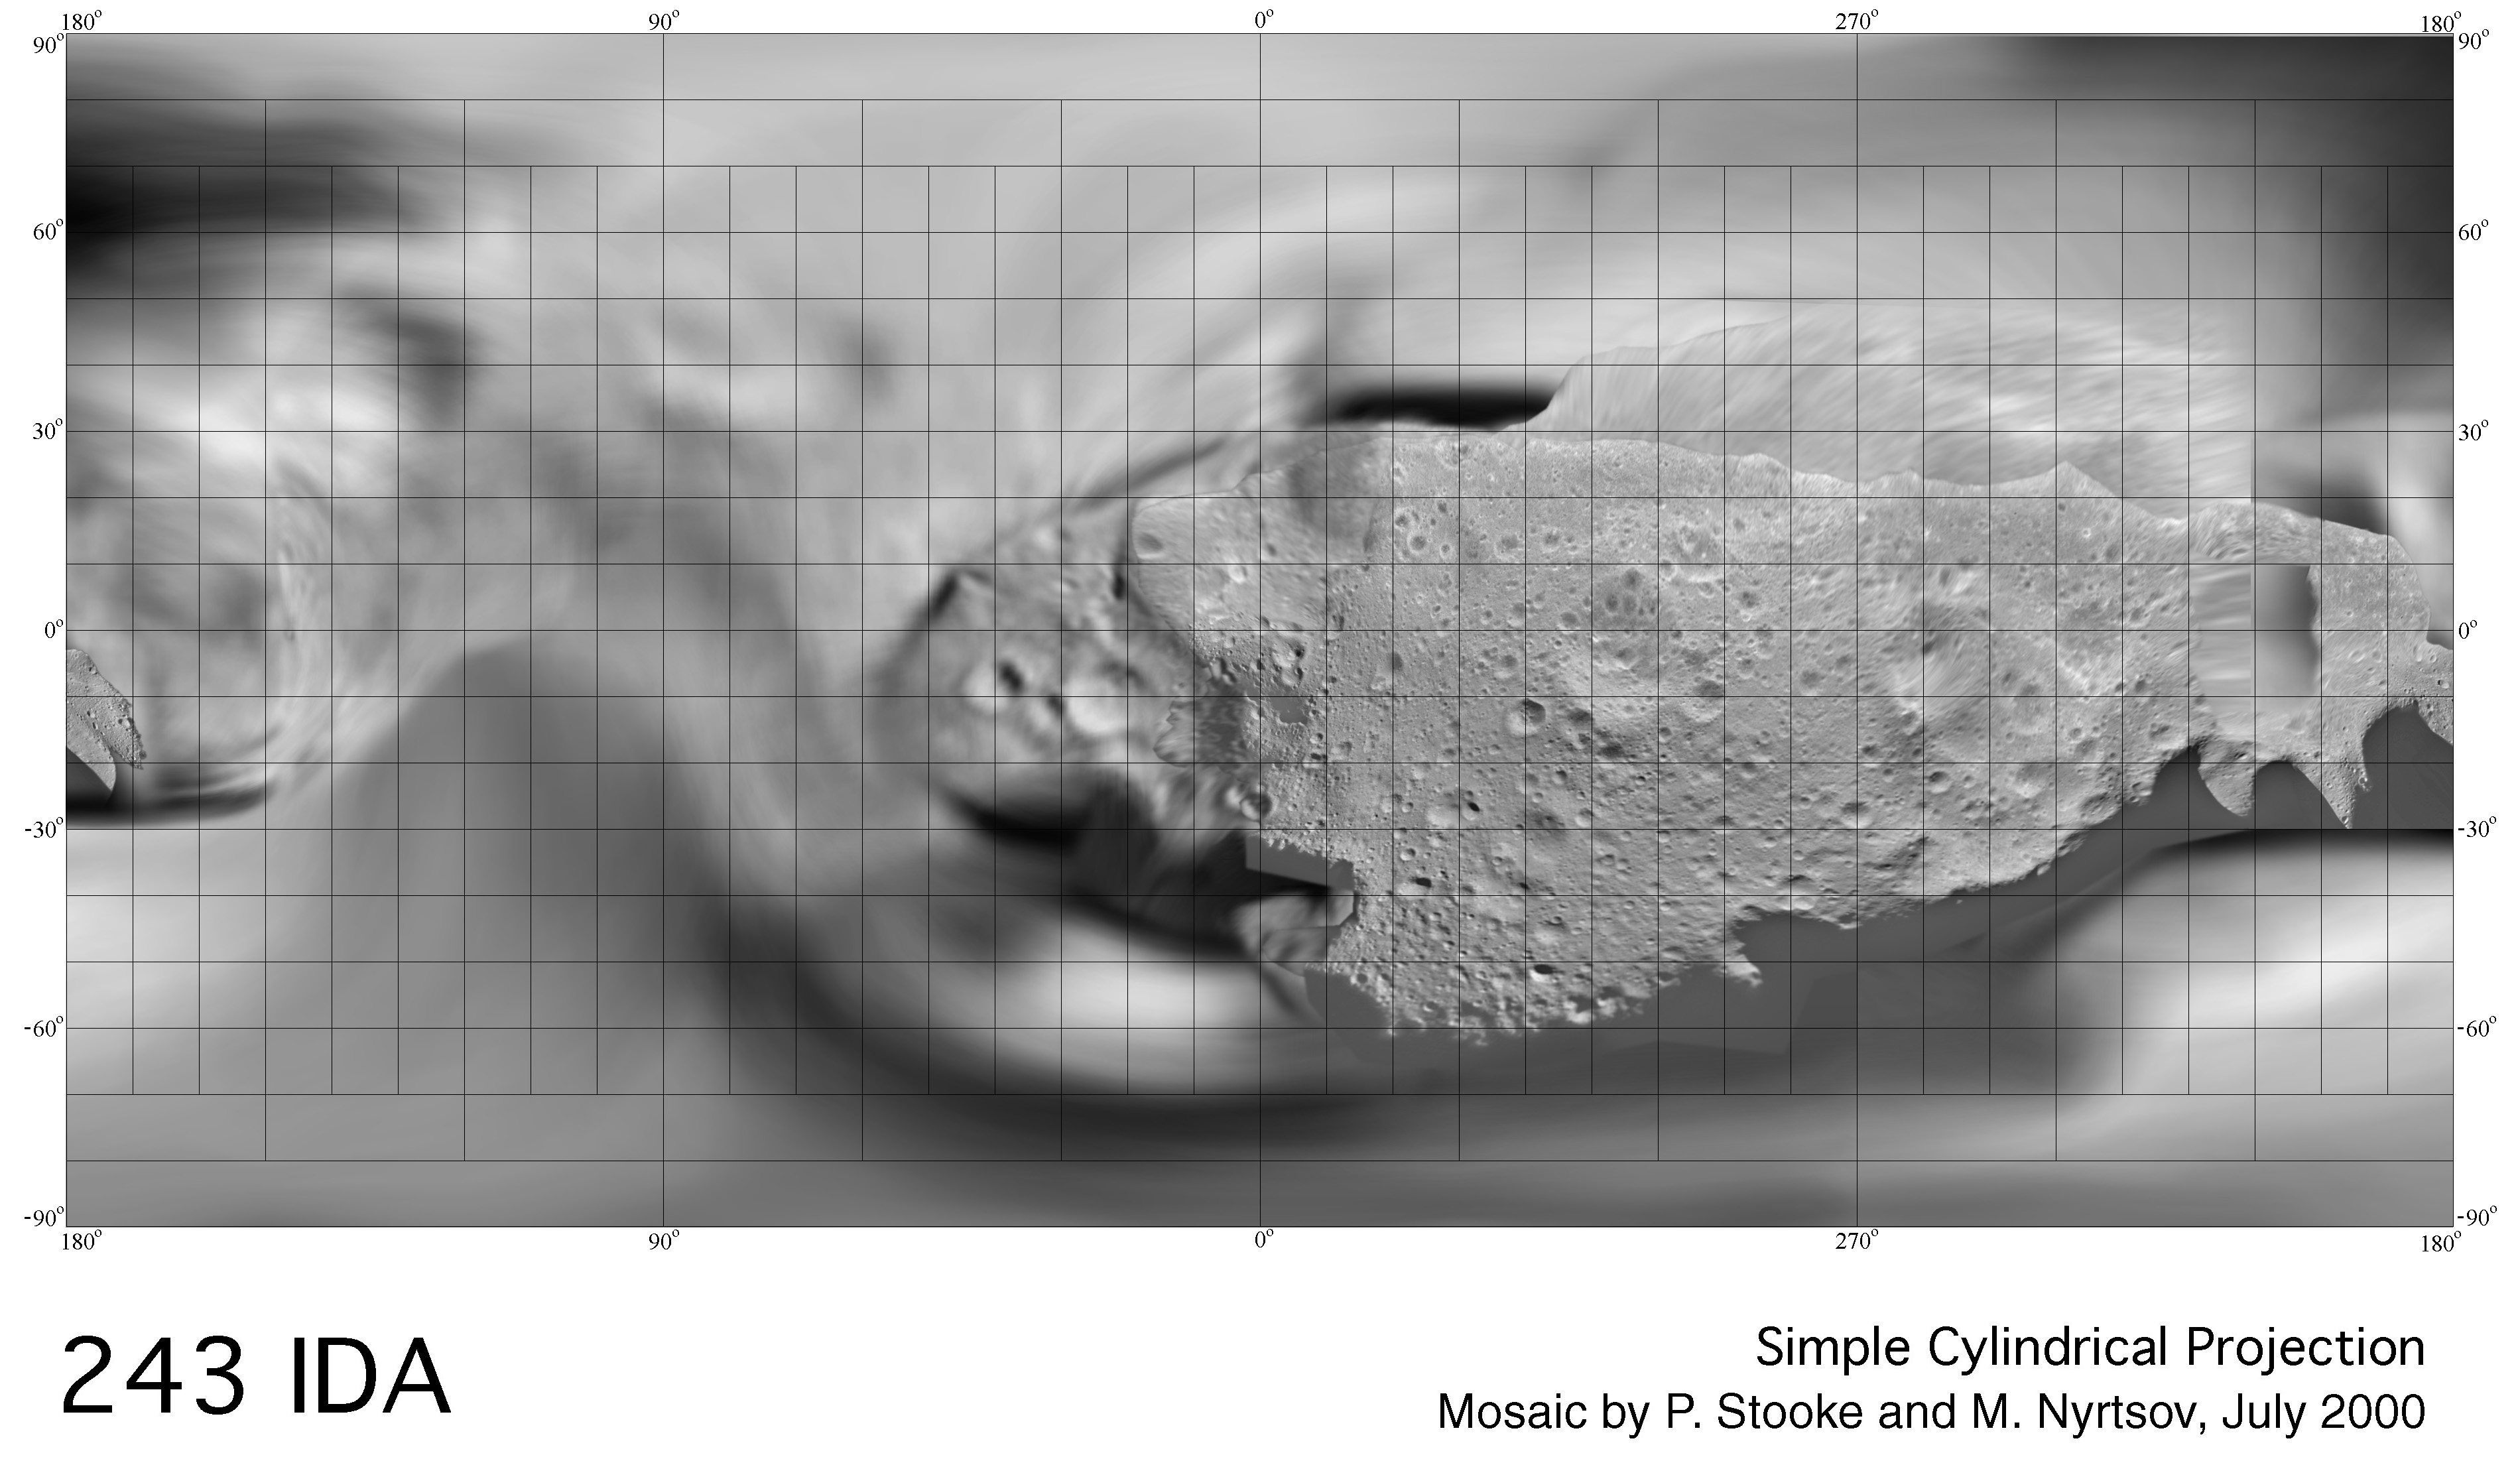
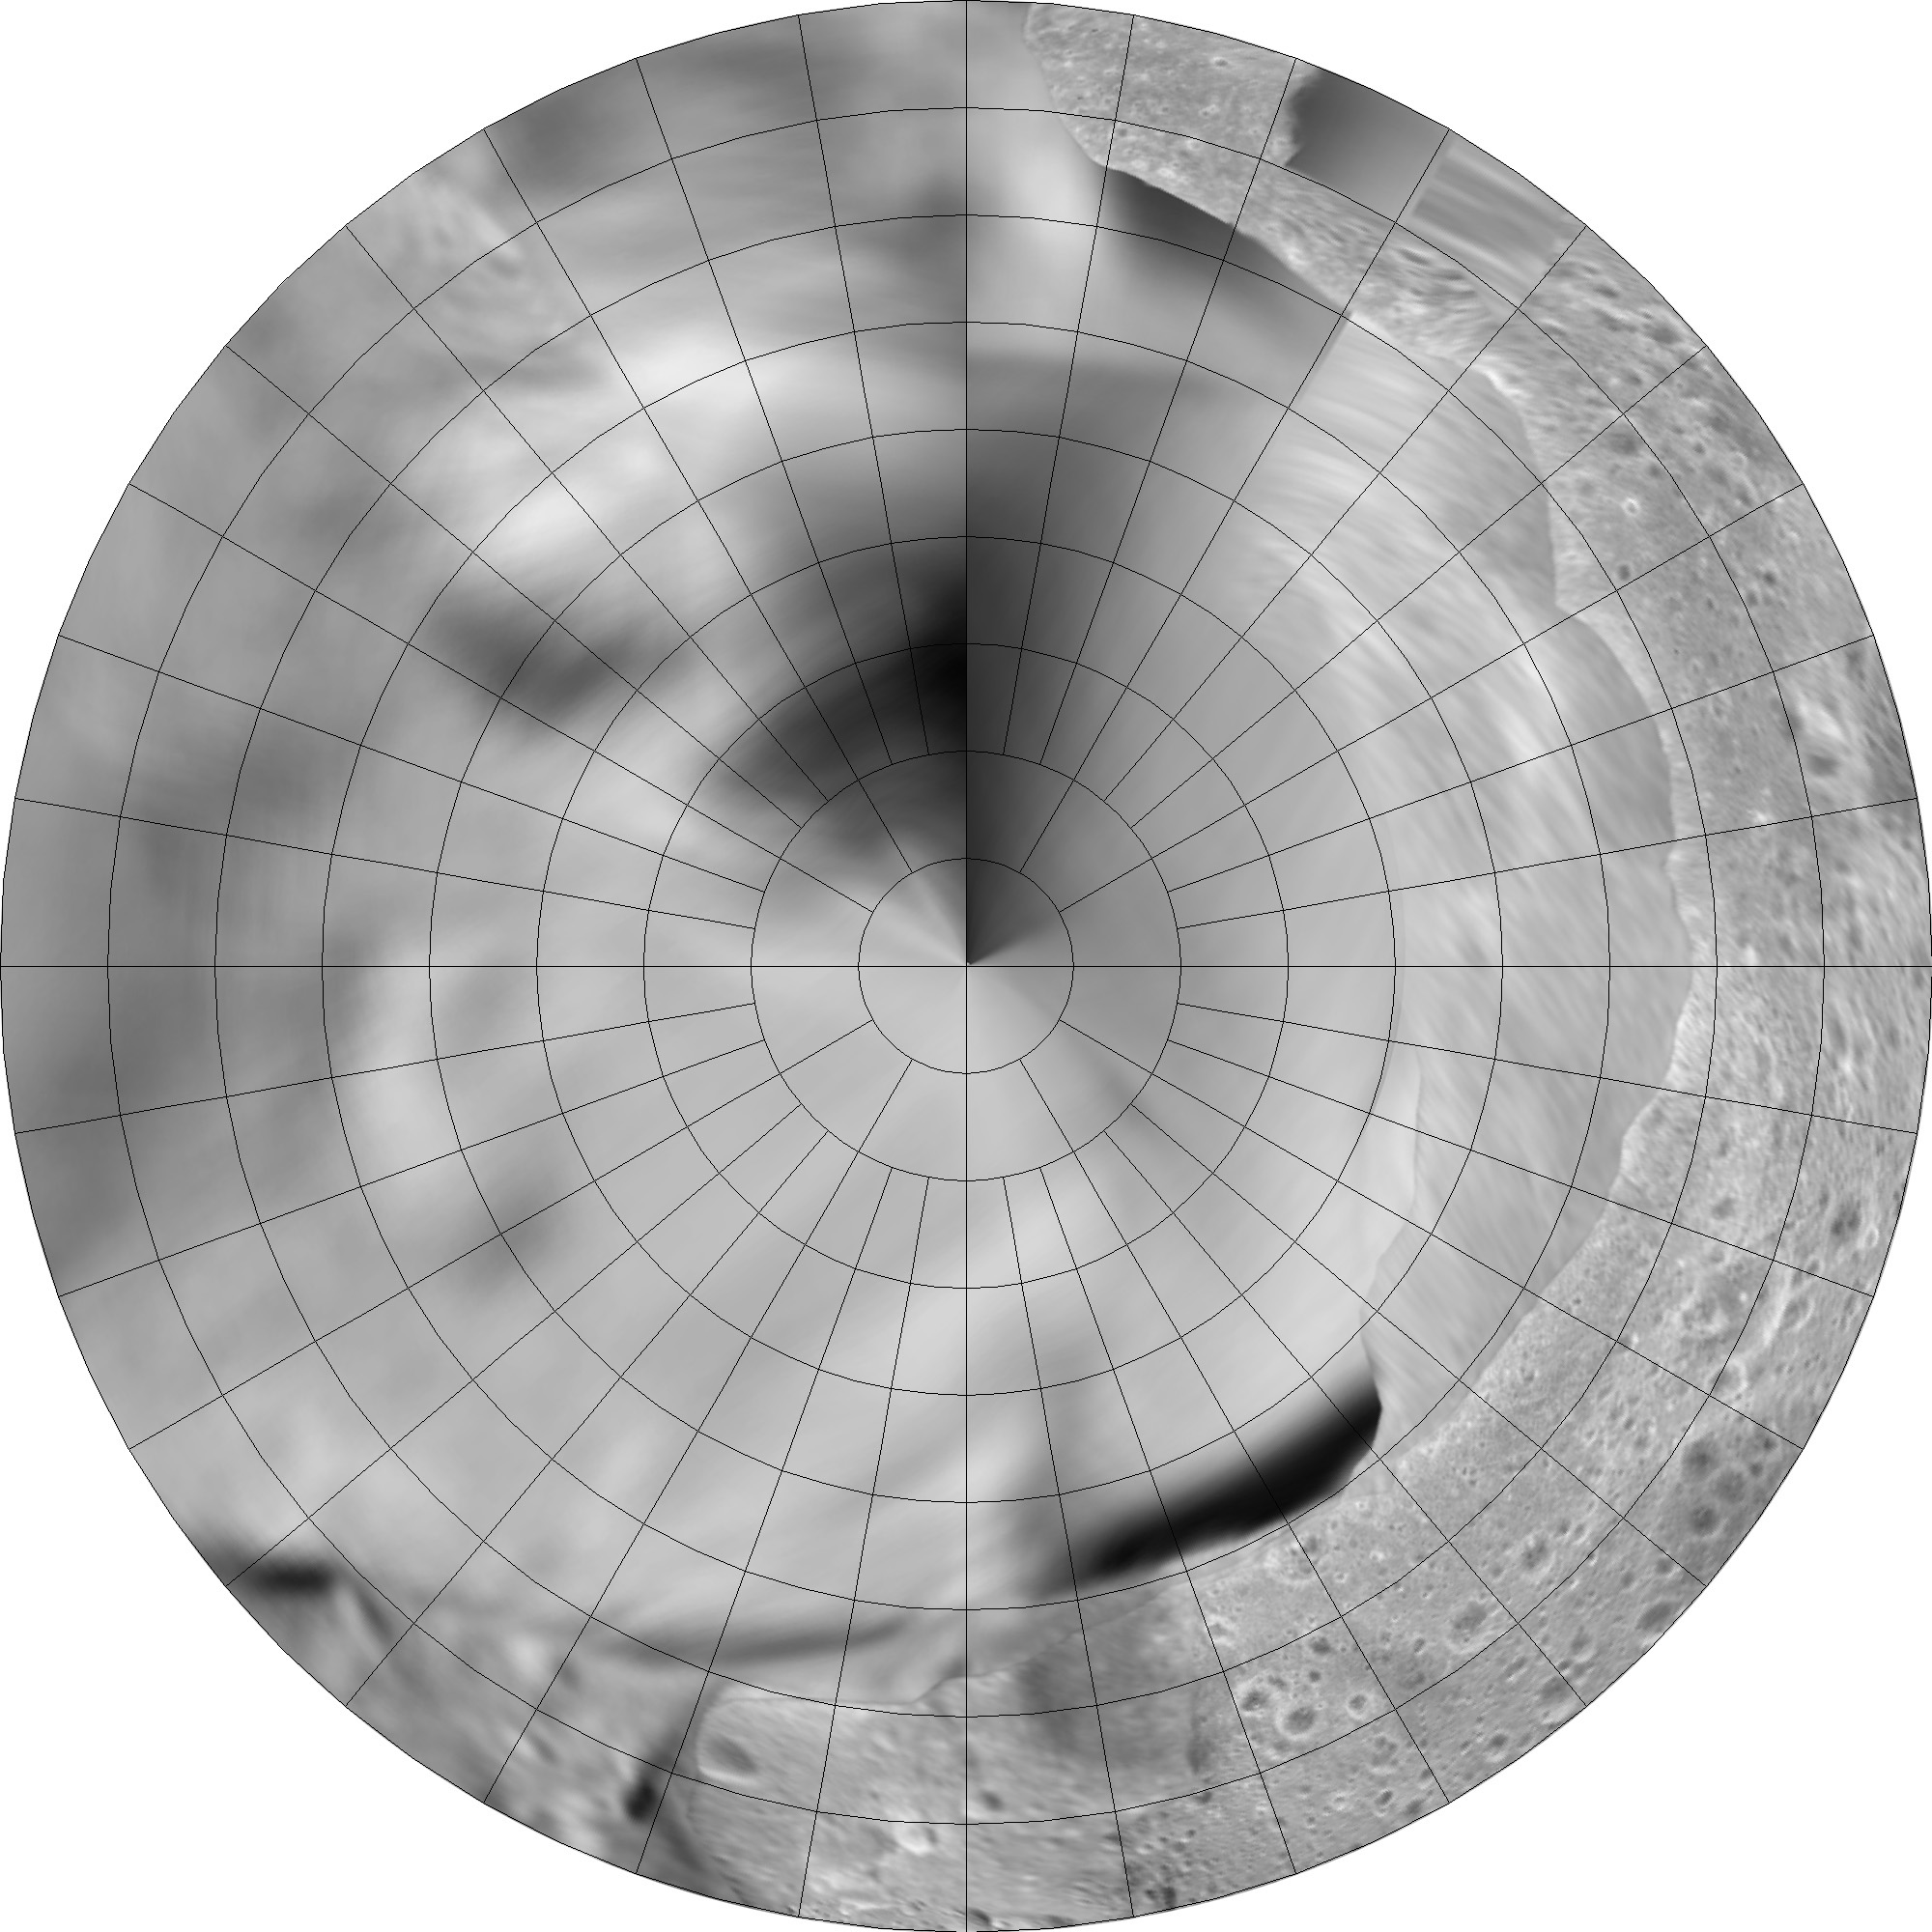
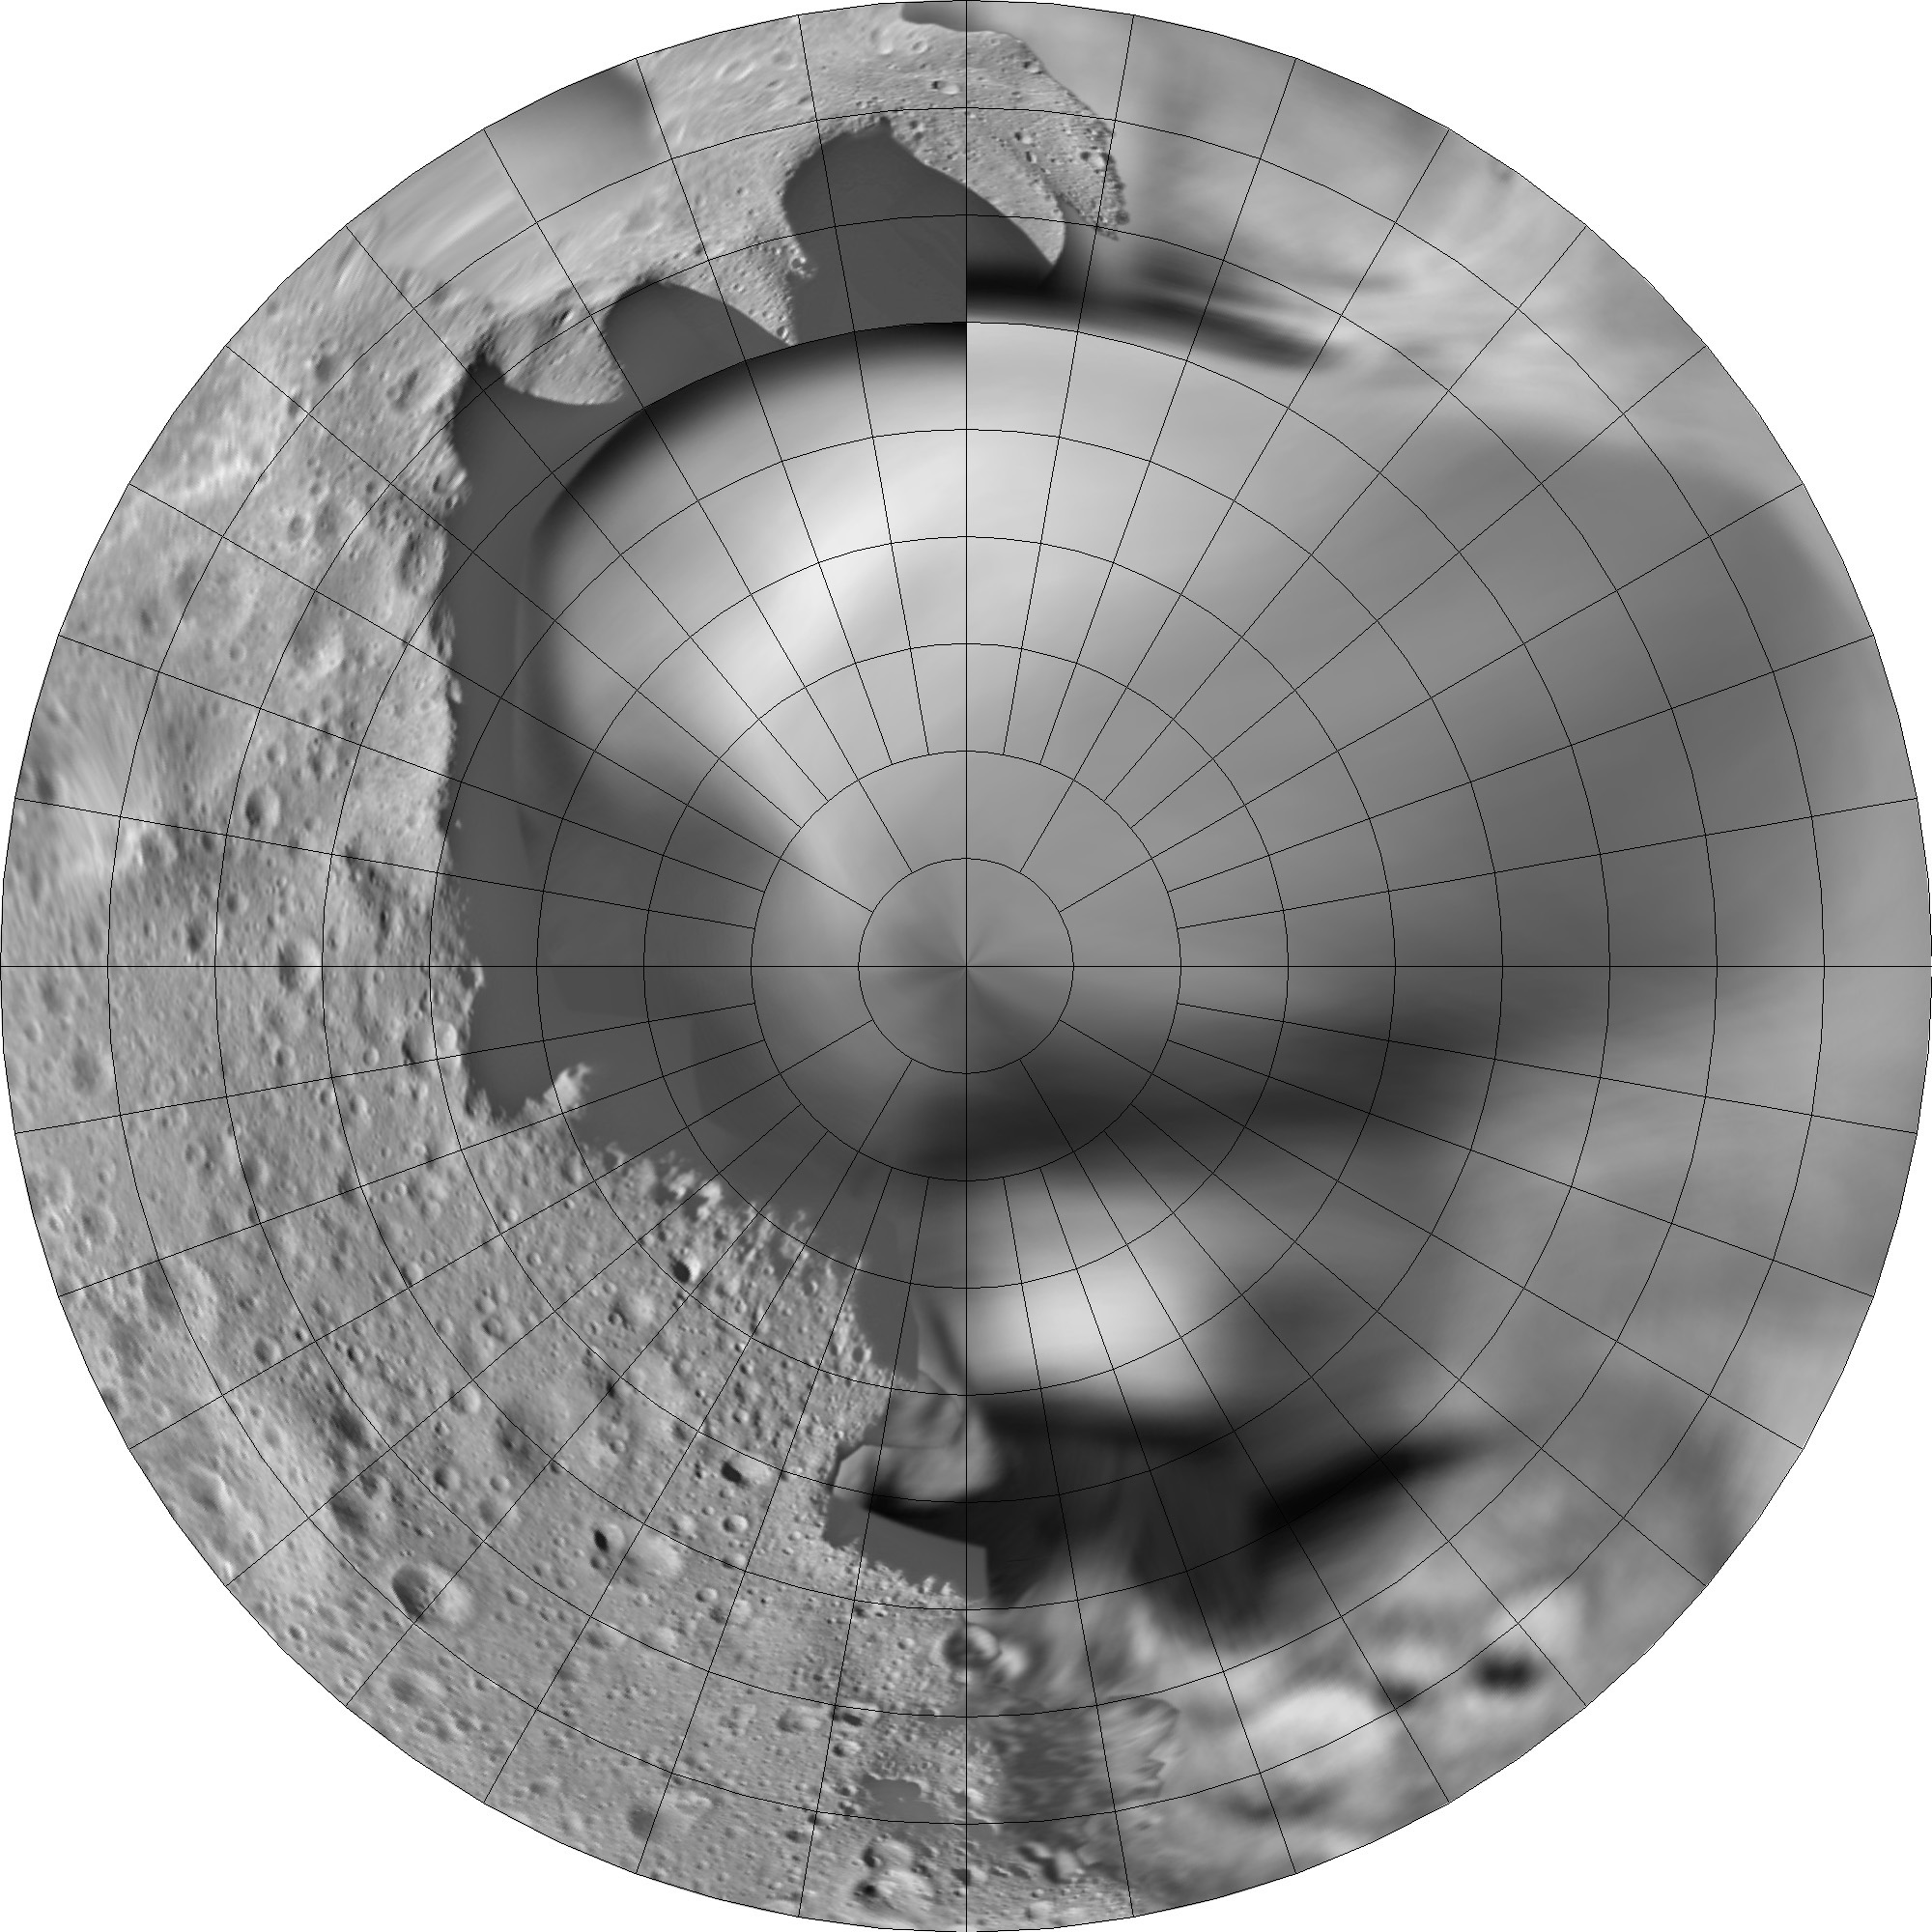
Asteroid 243 Ida
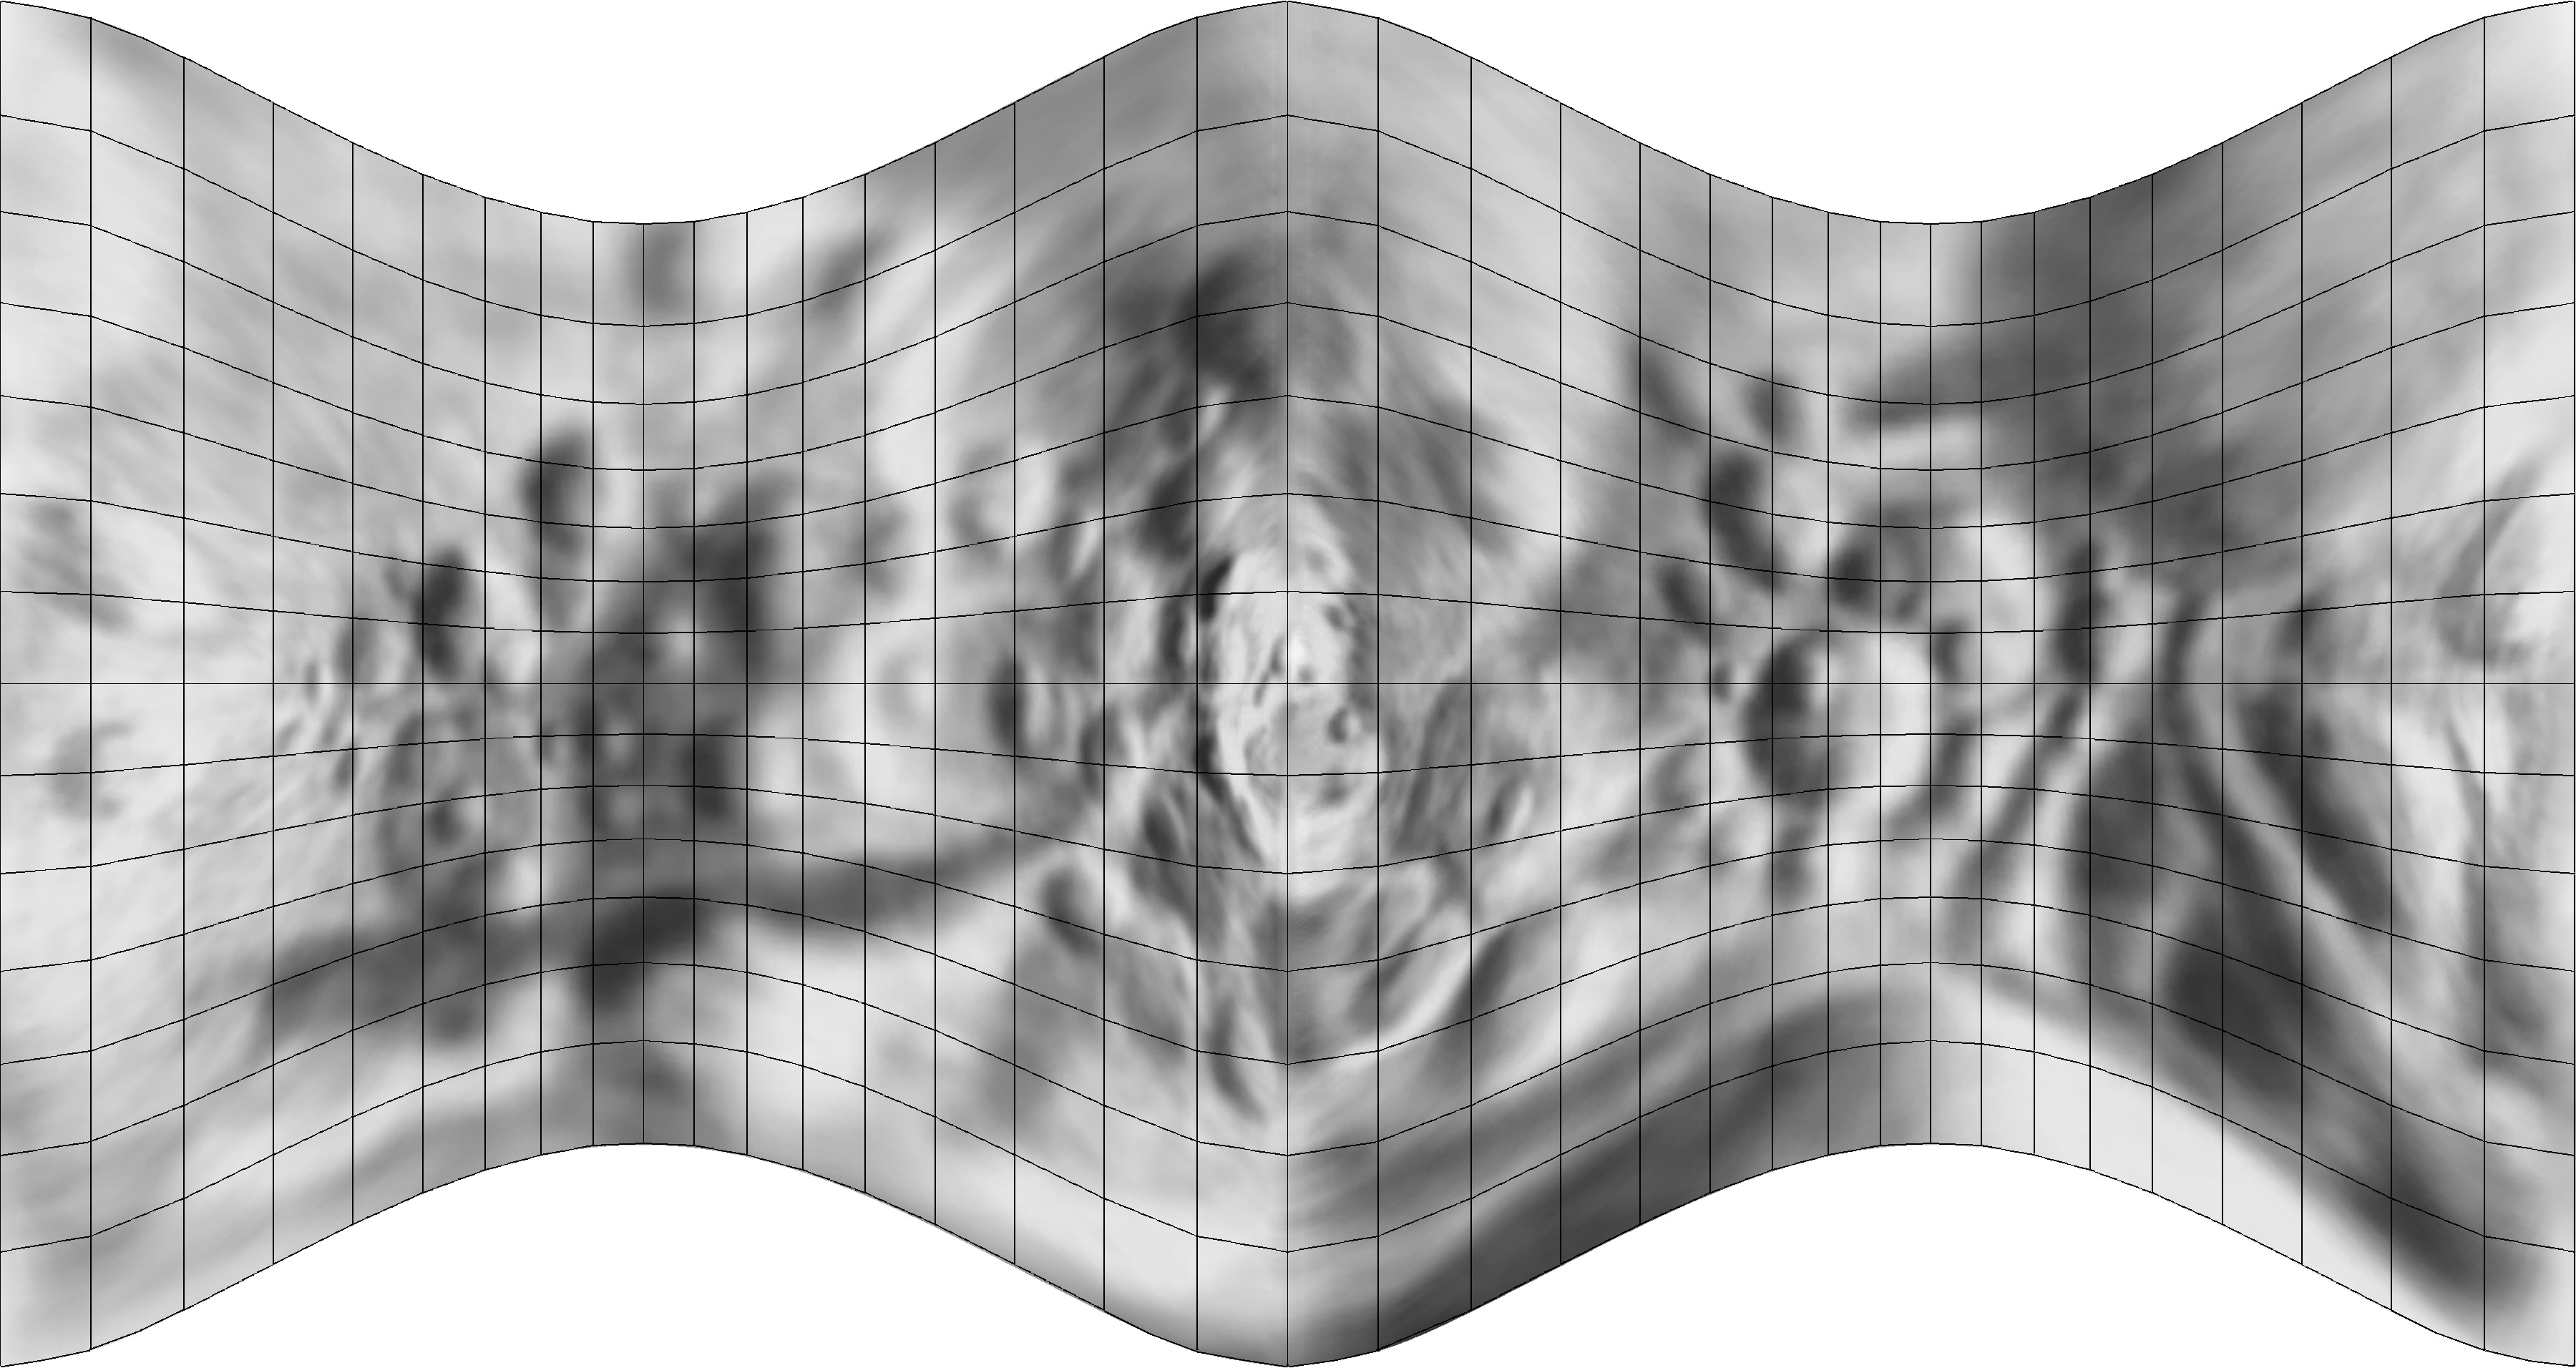
Global photomosaics in various projections. The global photomosaic was
constructed by Philip Stooke and Maxim Nyrtsov at the University of
Western Ontario. Galileo images were reprojected to simple cylindrical
projection based on Peter Thomas's shape model. This version of the map
is still experimental and will be improved, but is already superior to
anything else done for Ida.
- Simple Cylindrical
Projection (10 pixels/degree).
- Simple Cylindrical
Projection (10 pixels/degree) with grid and labels.
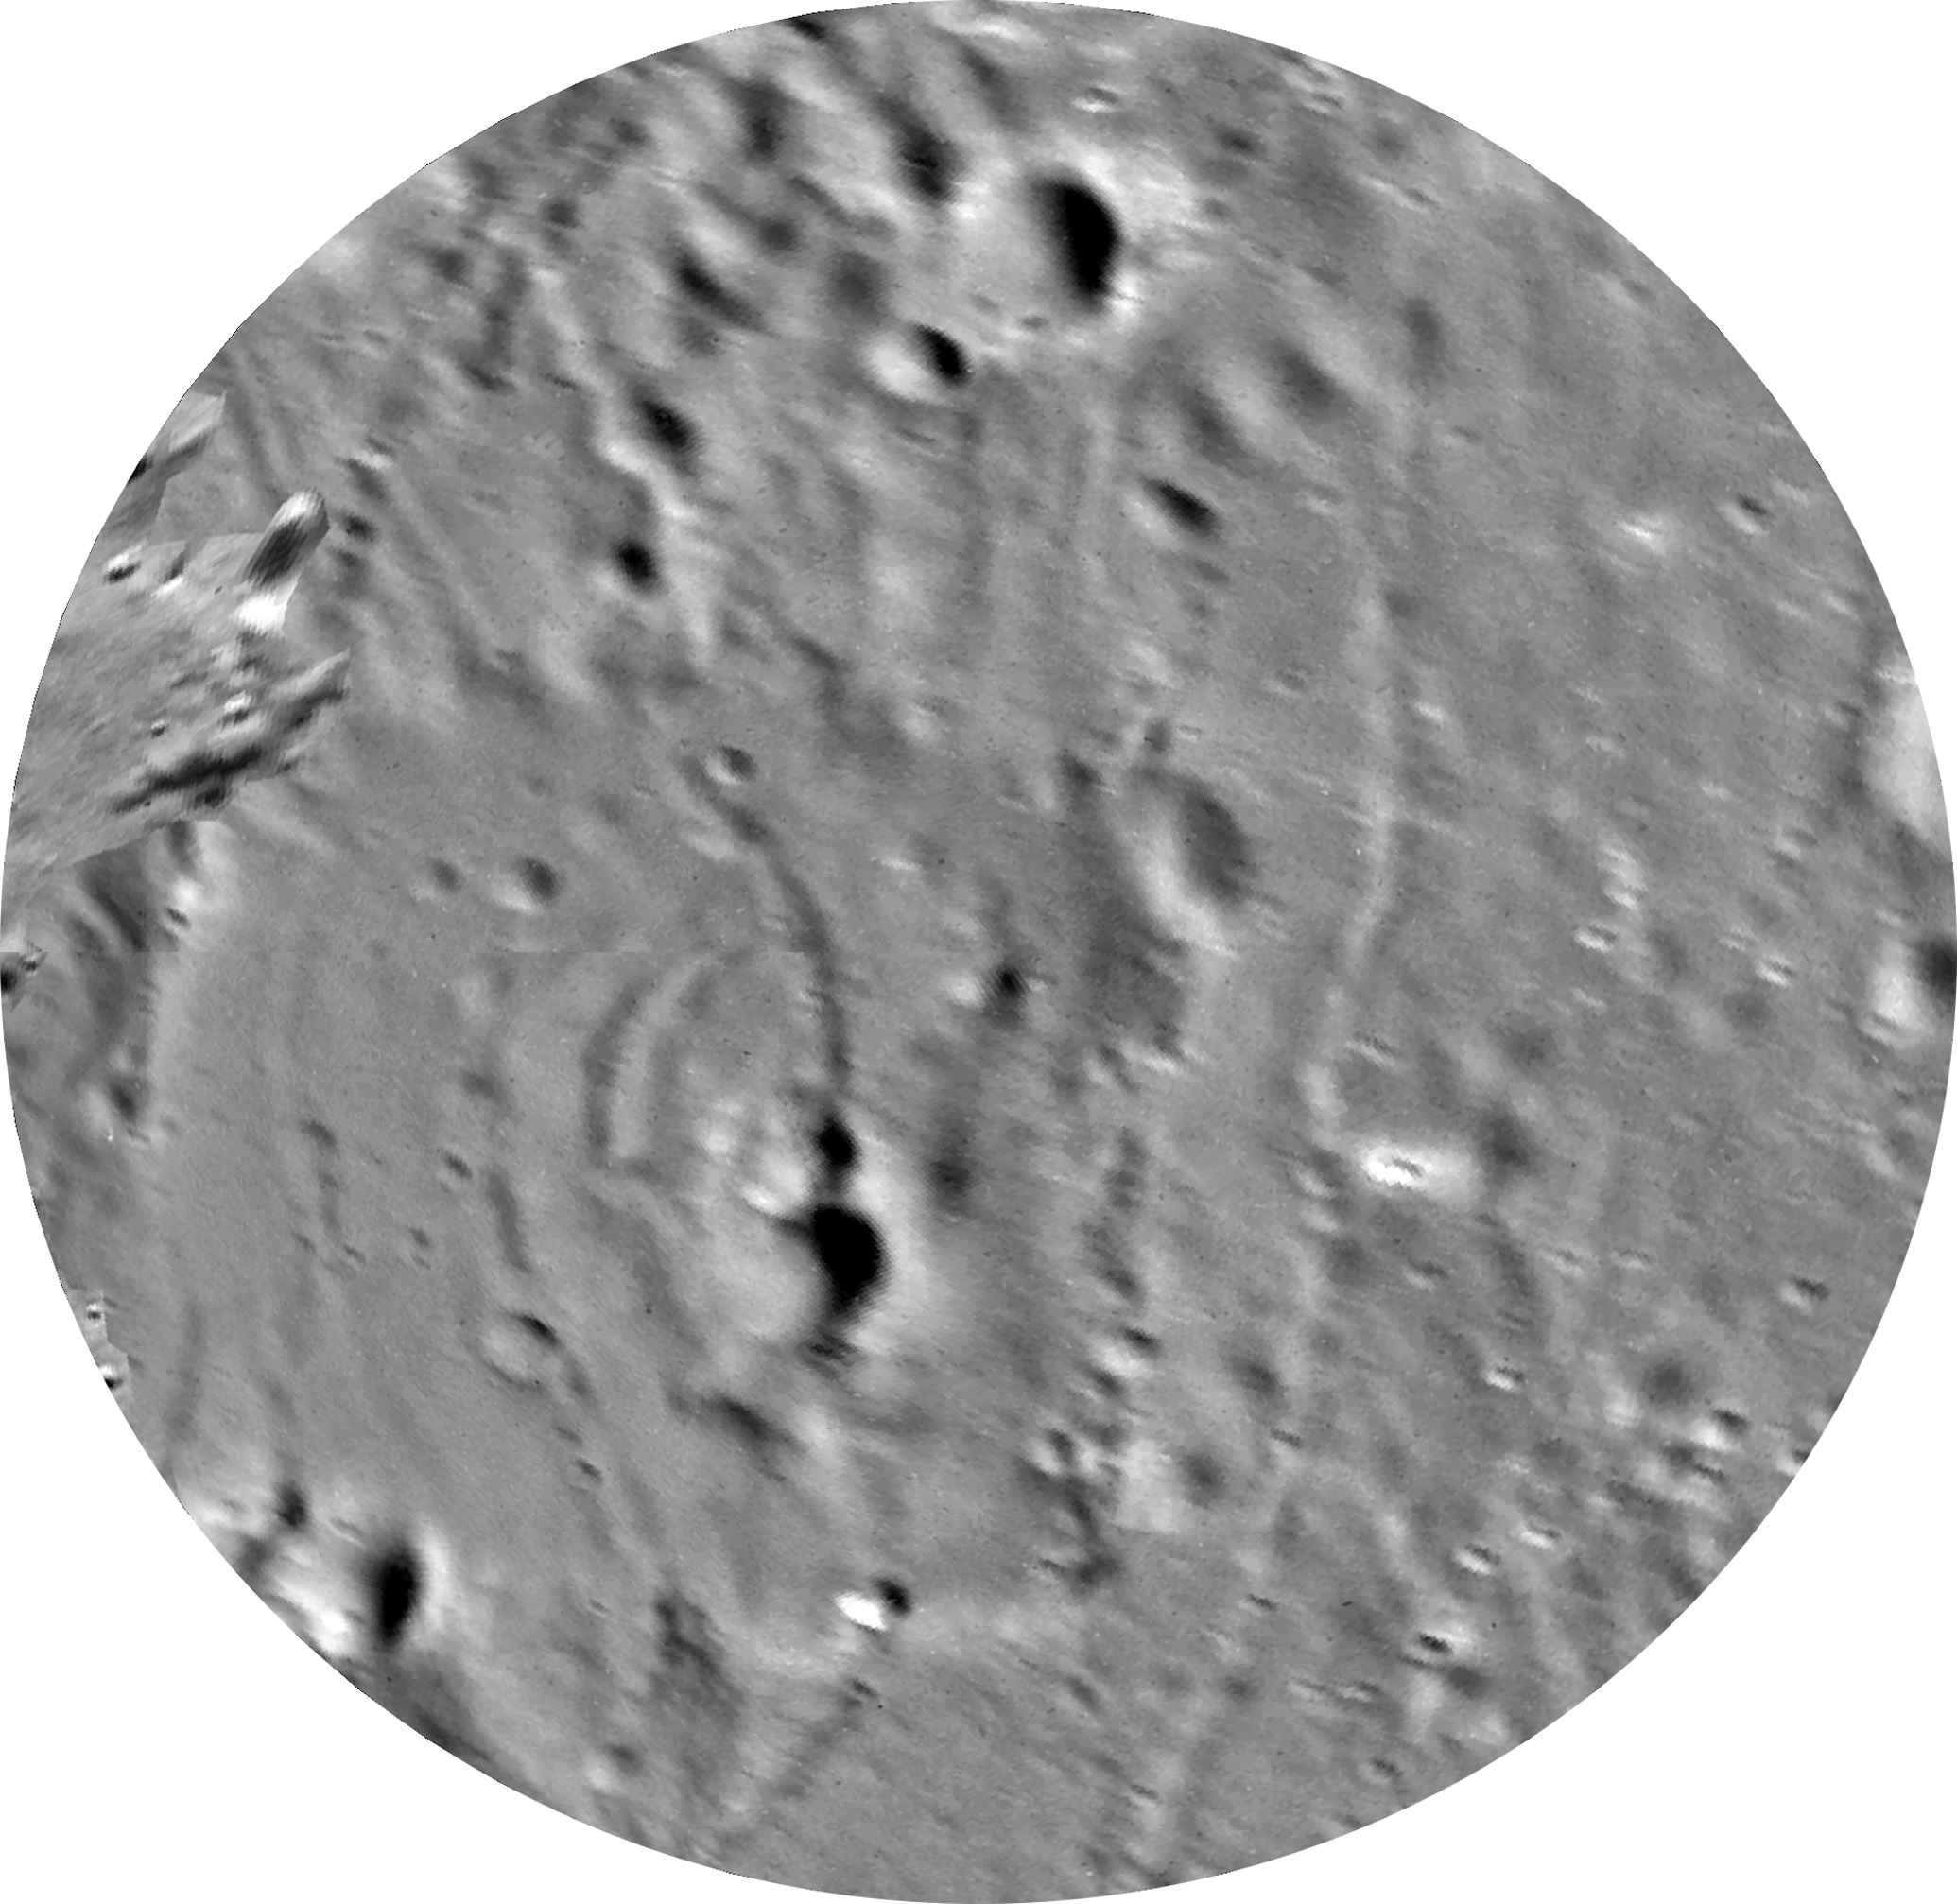
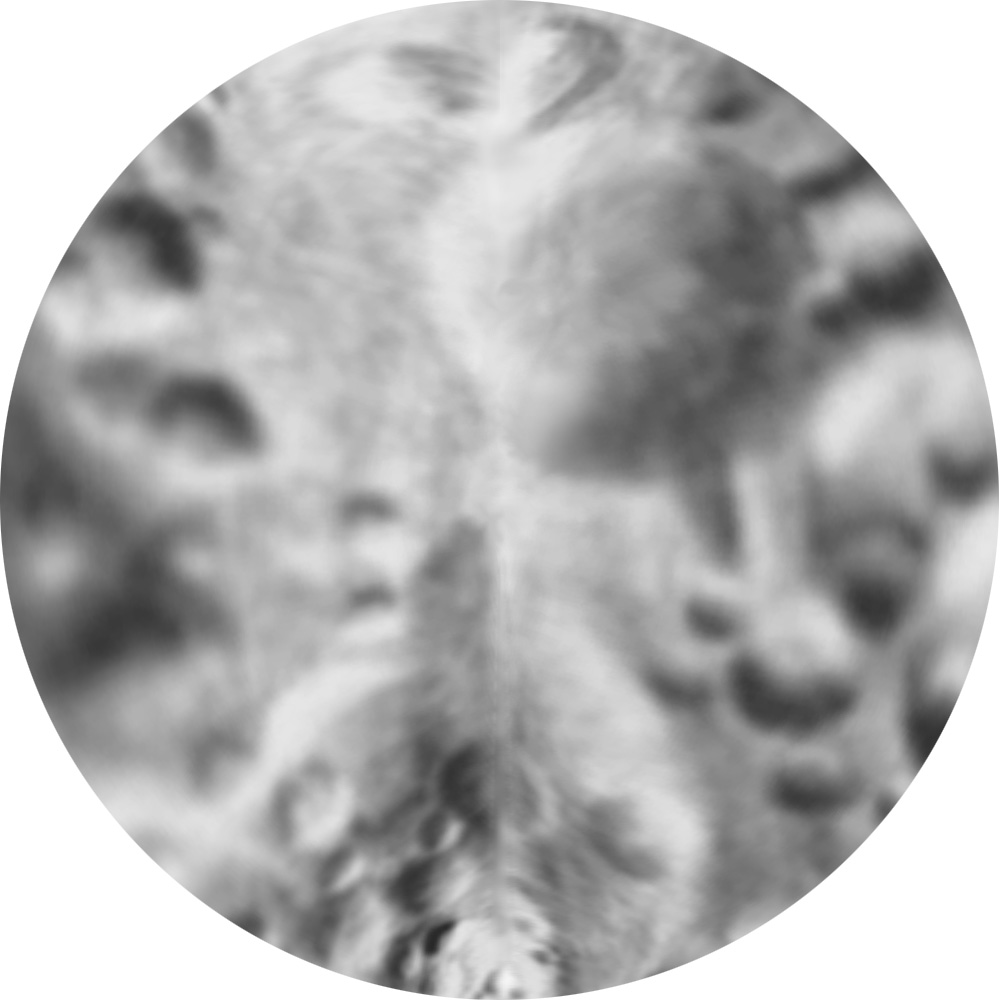
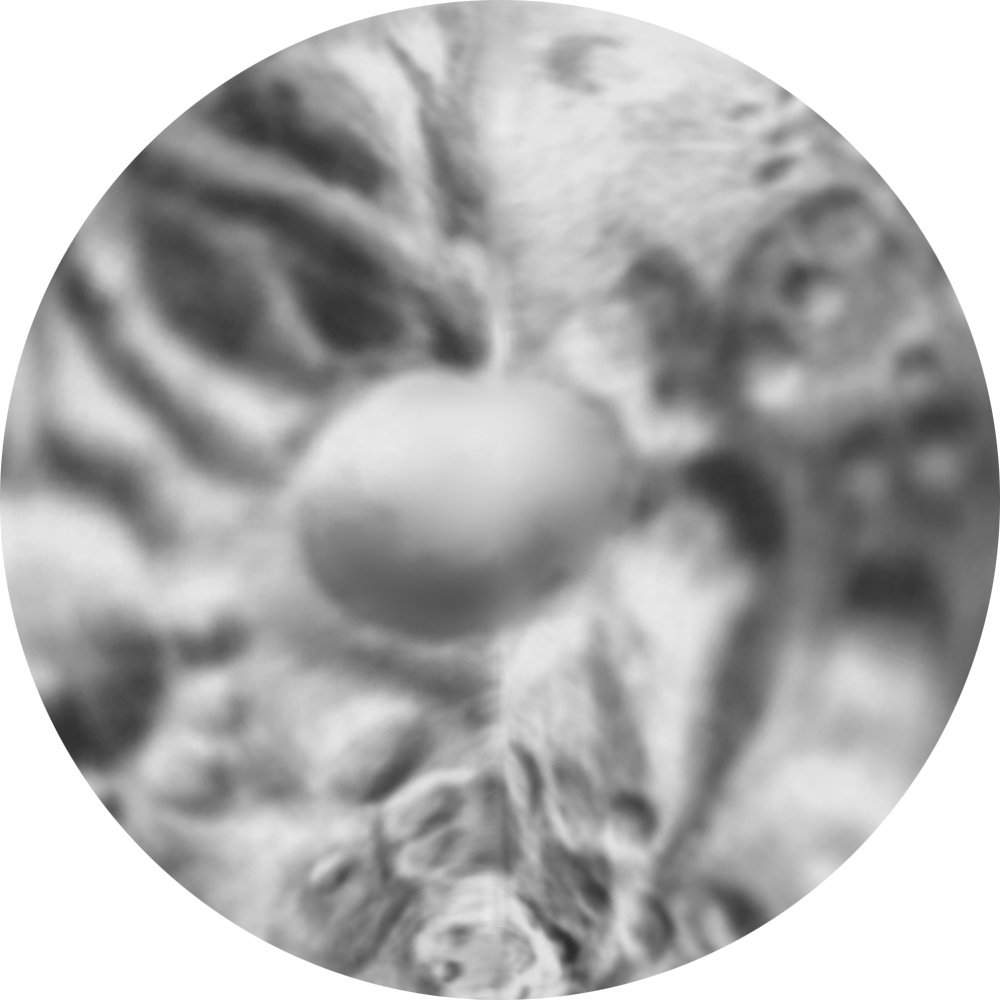
- Azimuthal Equidistant
Projection, polar aspect (north pole).
- Azimuthal Equidistant
Projection, polar aspect (south pole).
- Azimuthal Equidistant
Projection, polar aspect (north pole), with unlabeled 10 degree grid.
- Azimuthal Equidistant
Projection, polar aspect (south pole), with unlabeled 10 degree grid.
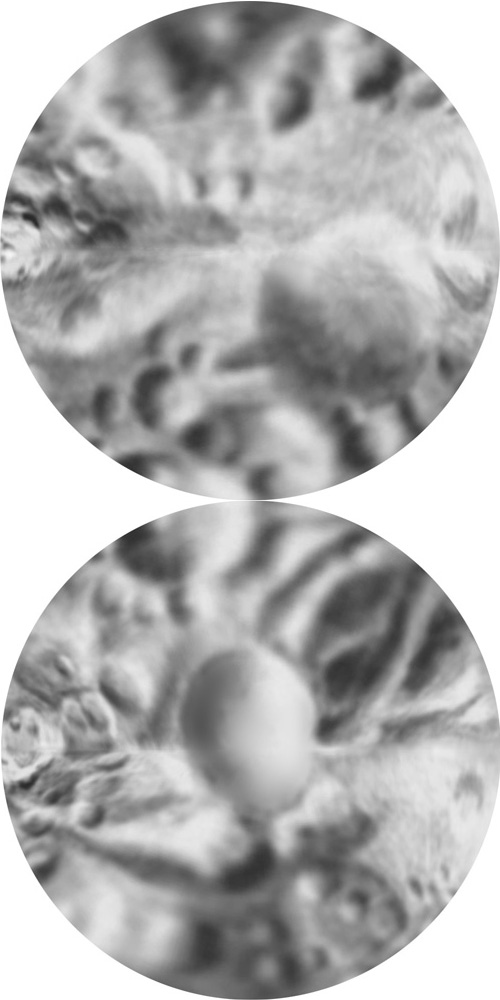
- Morphographic Equidistant
Projection, north pole.
- Morphographic Equidistant
Projection, south pole.
- Morphographic Equidistant
Projection, north pole, with unlabeled 10 degree grid.
- Morphographic Equidistant
Projection, south pole, with unlabeled 10 degree grid.
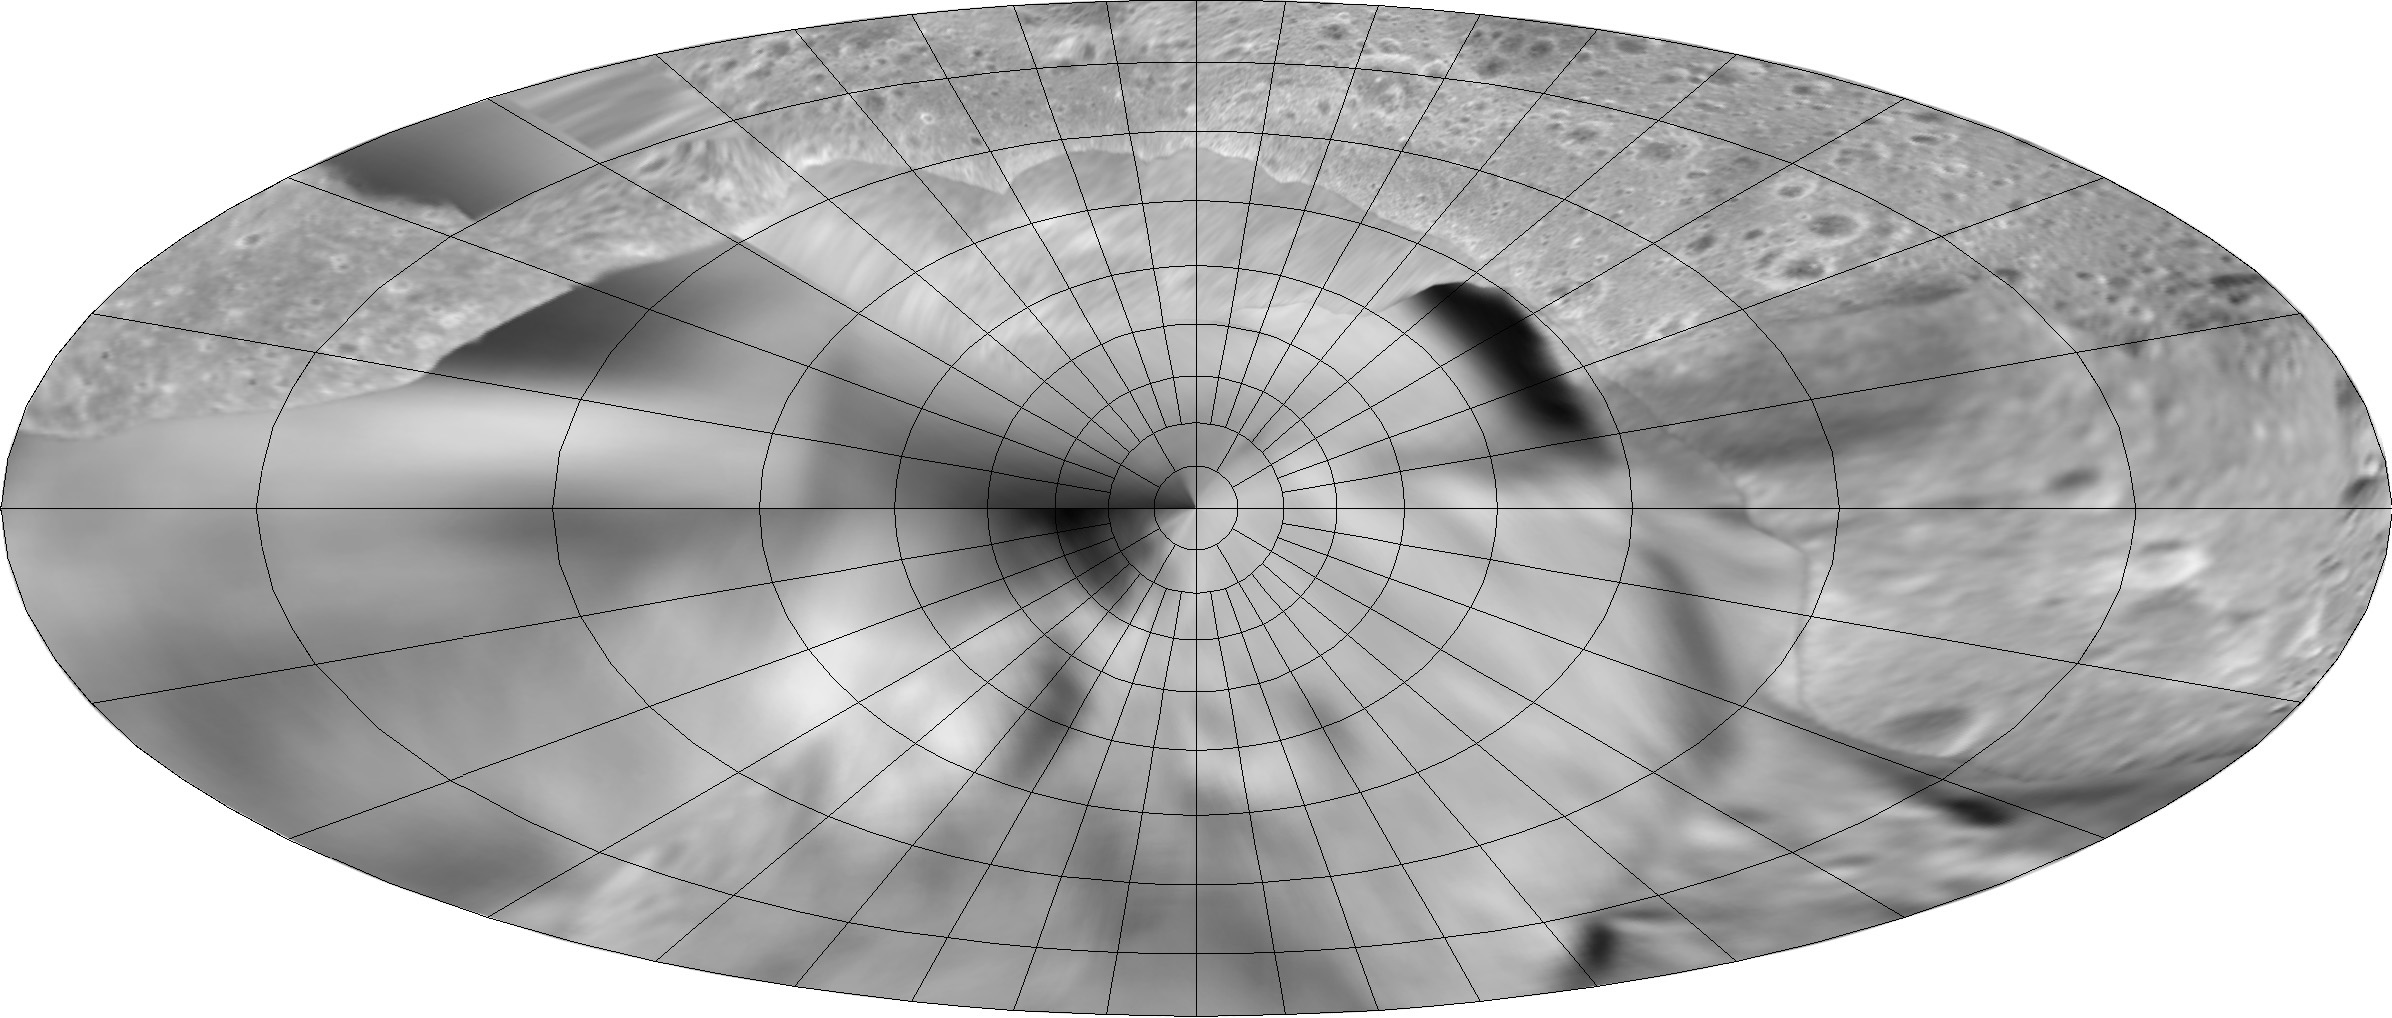
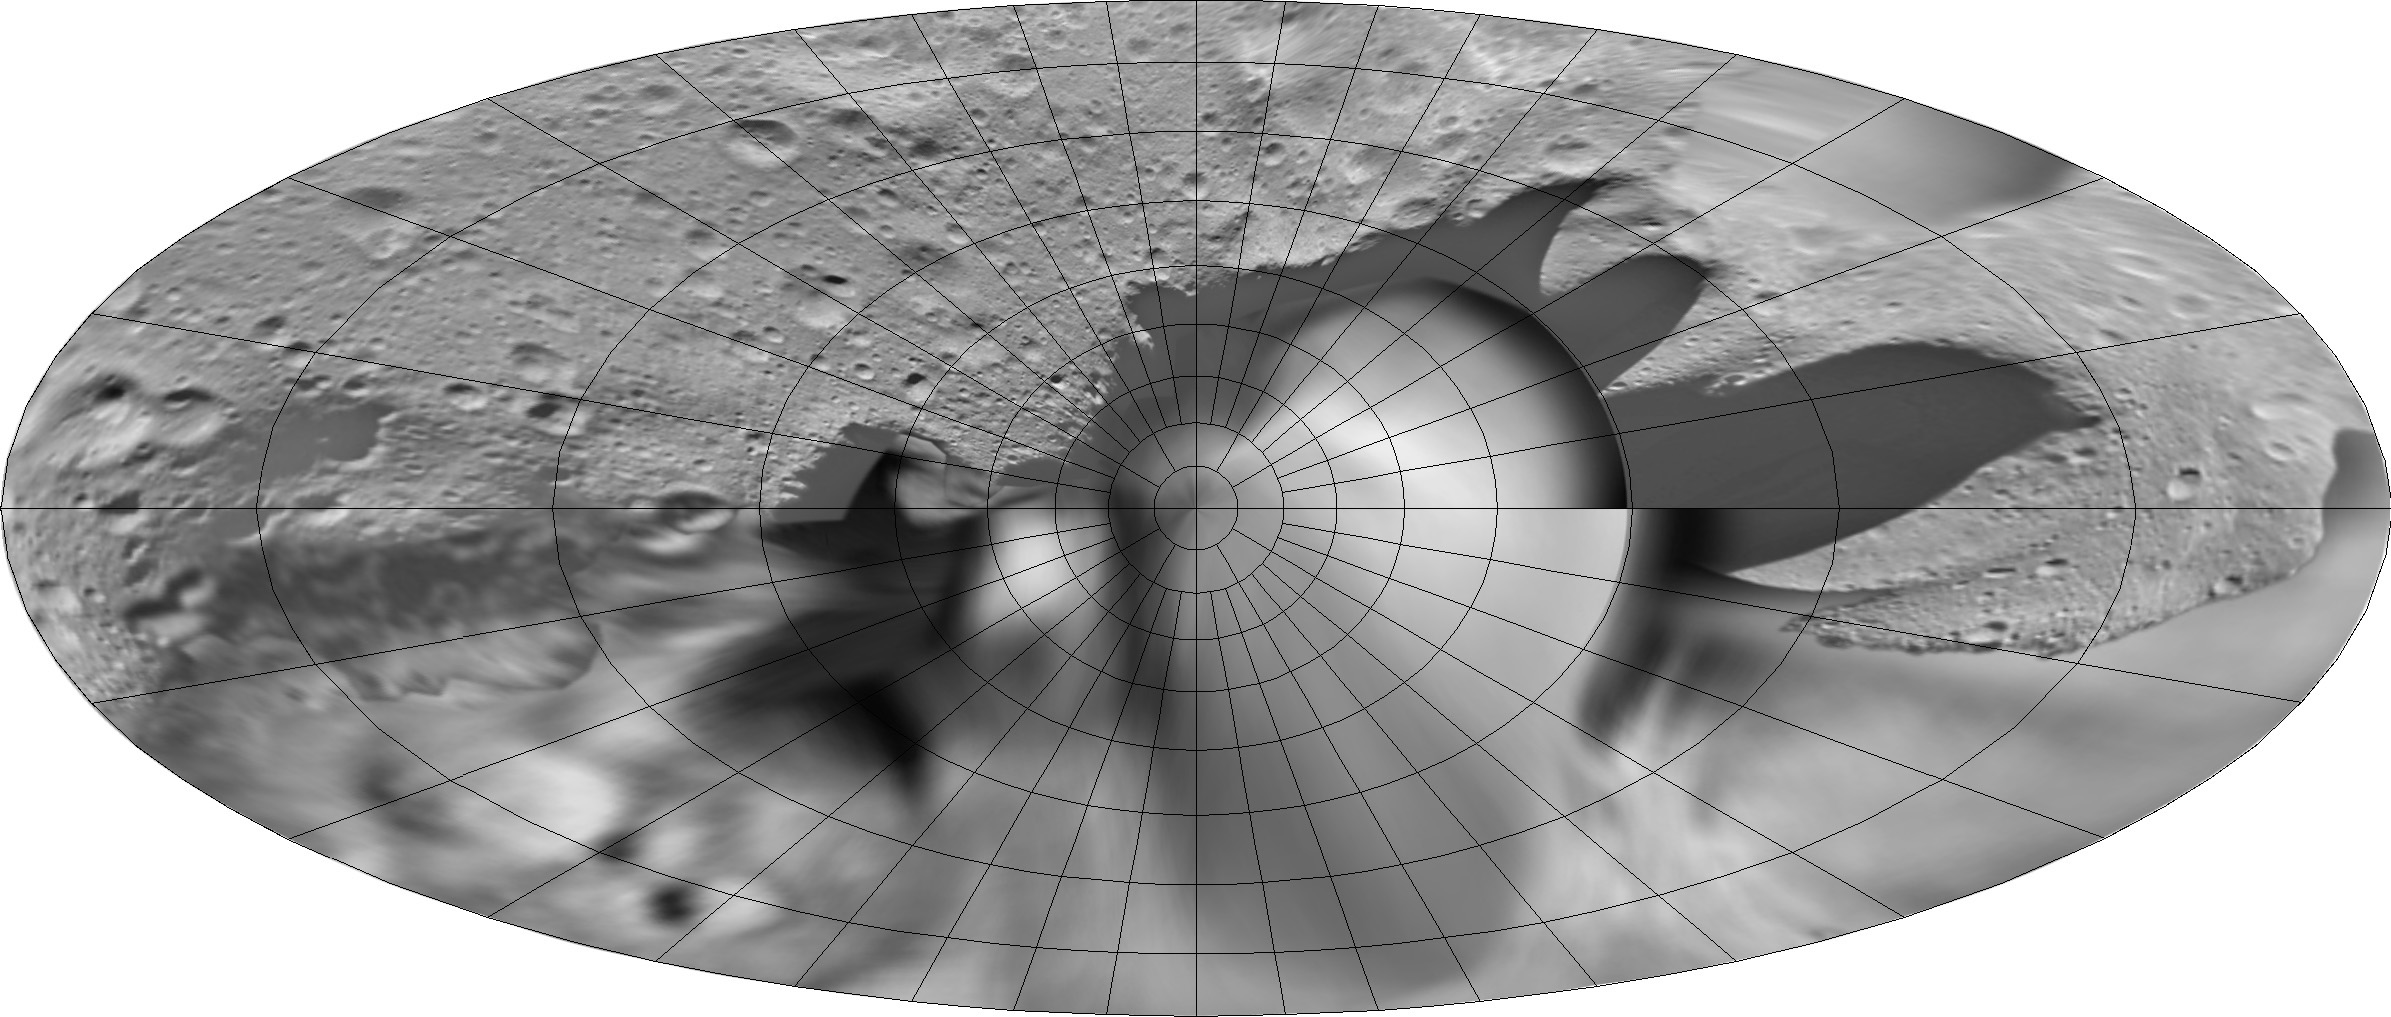
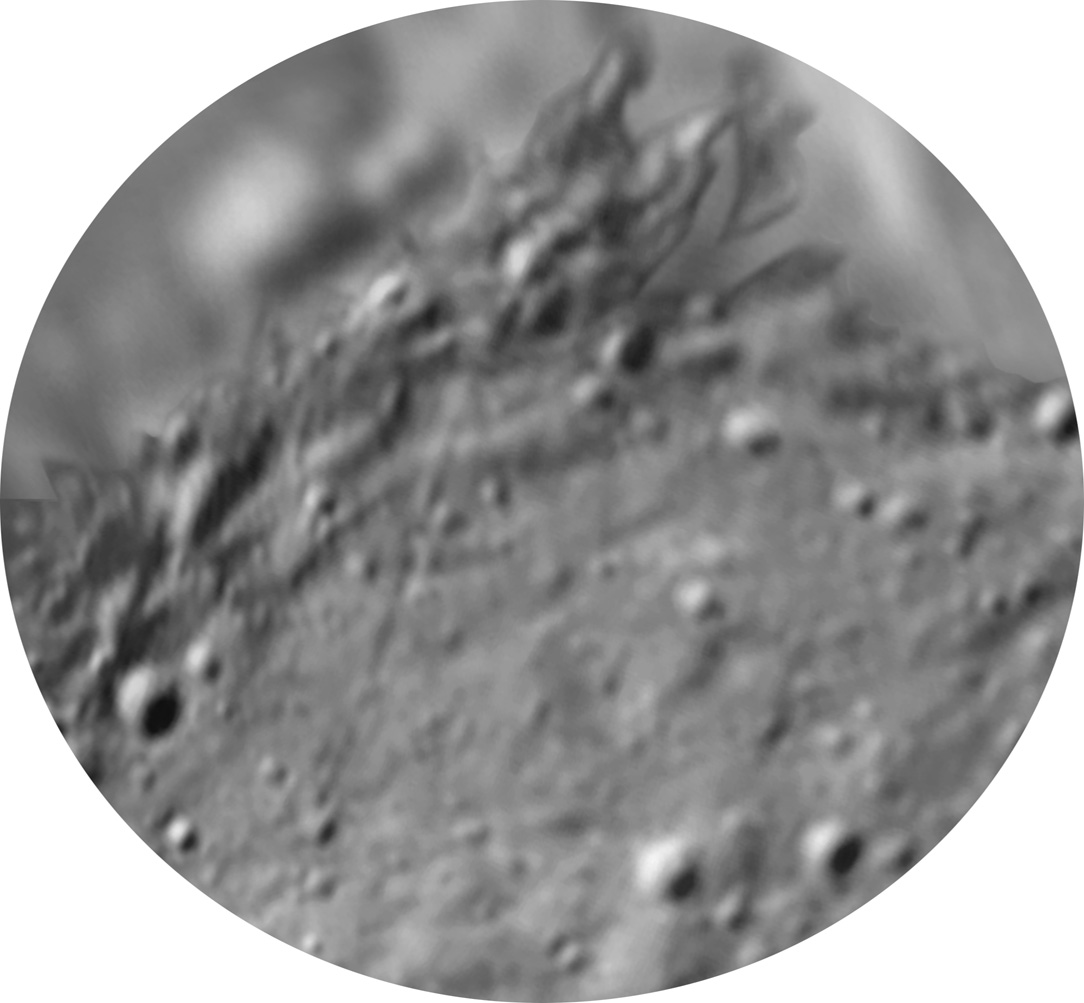
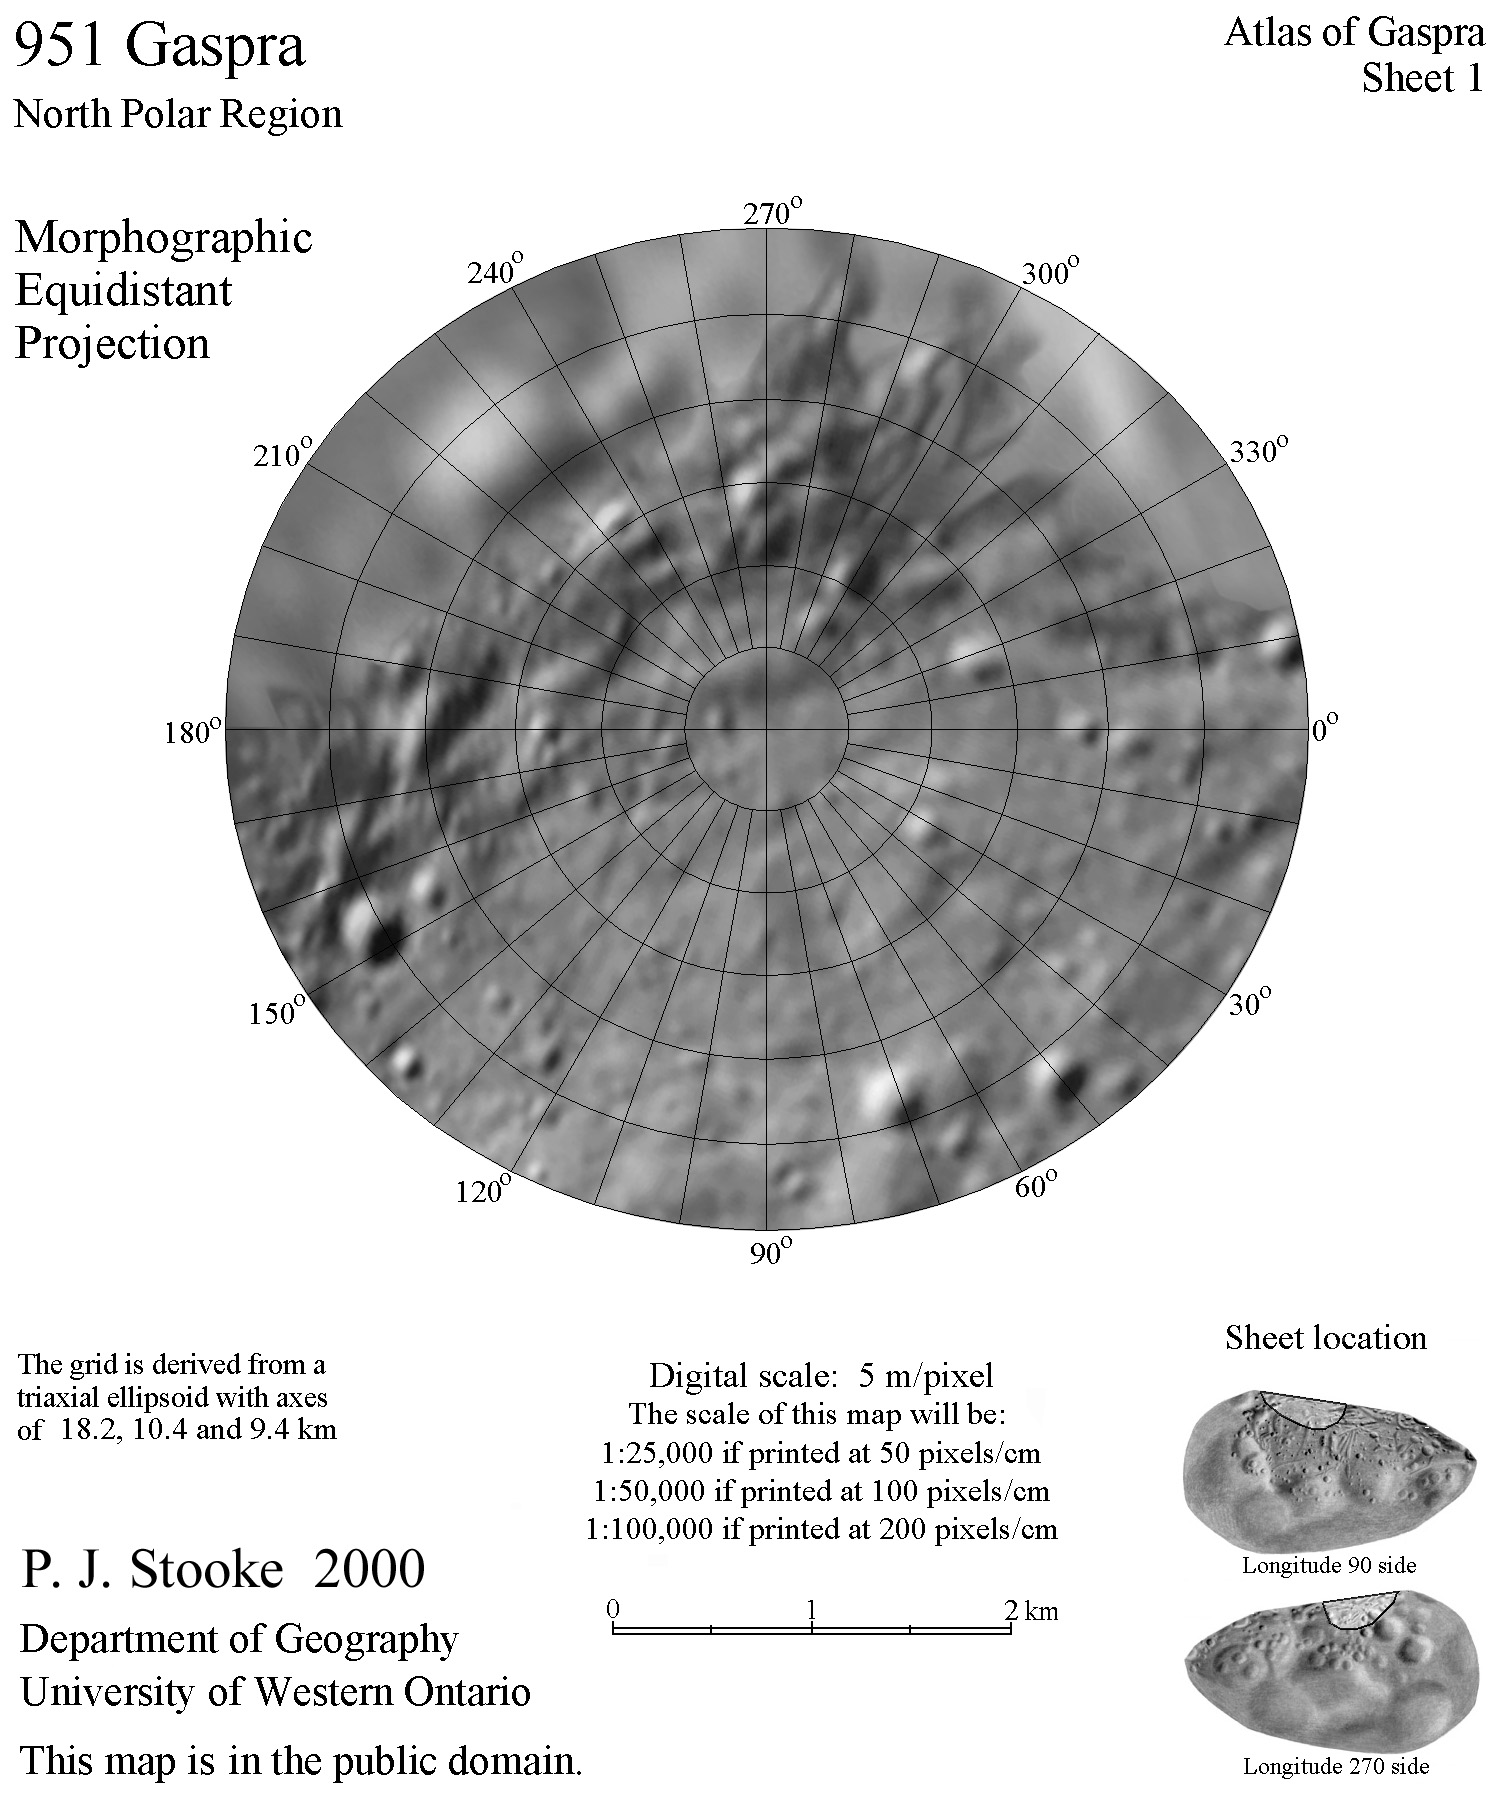
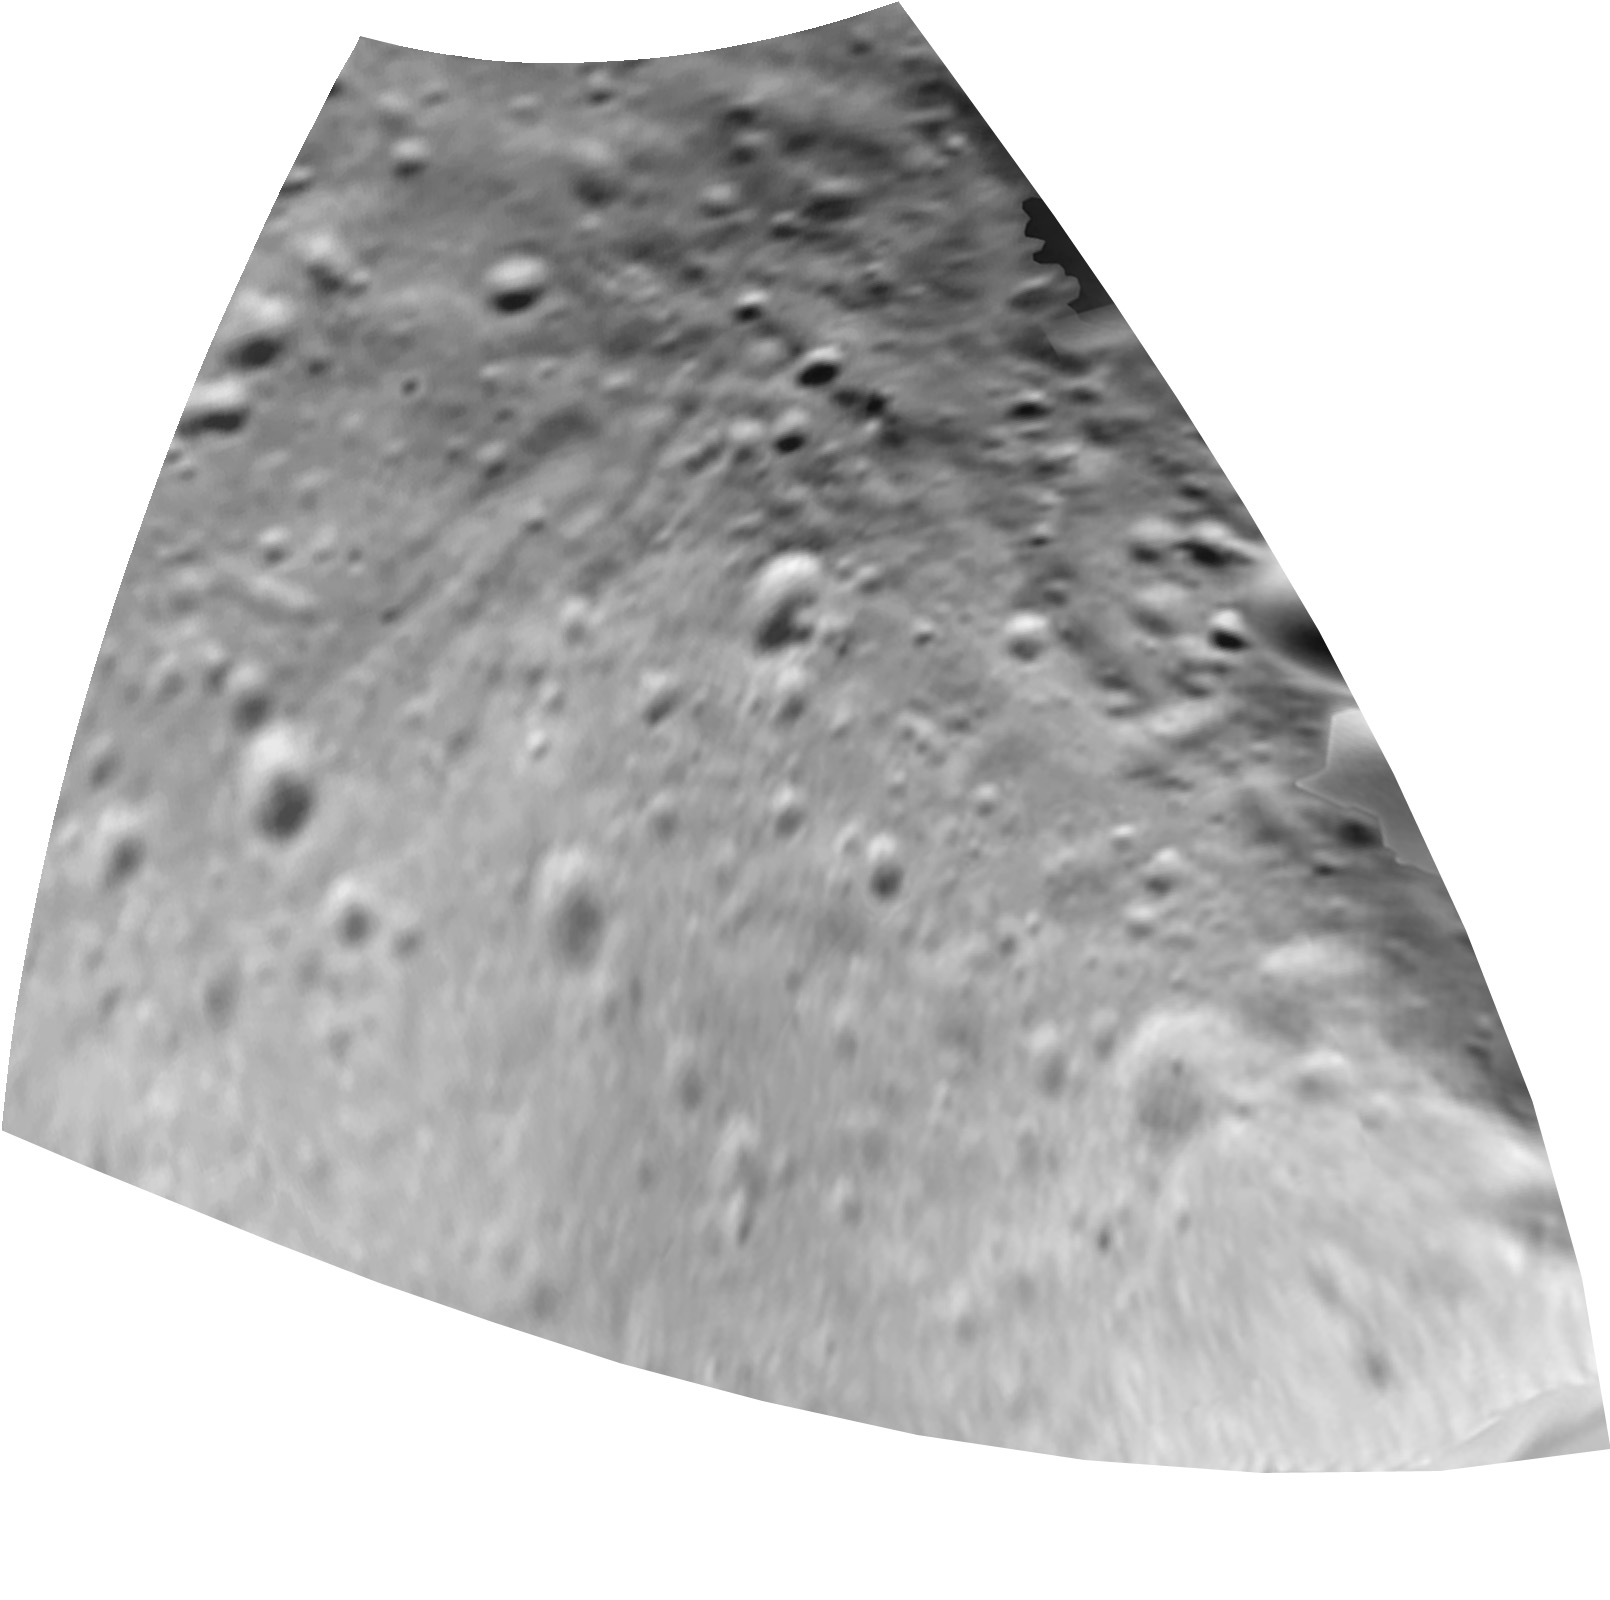
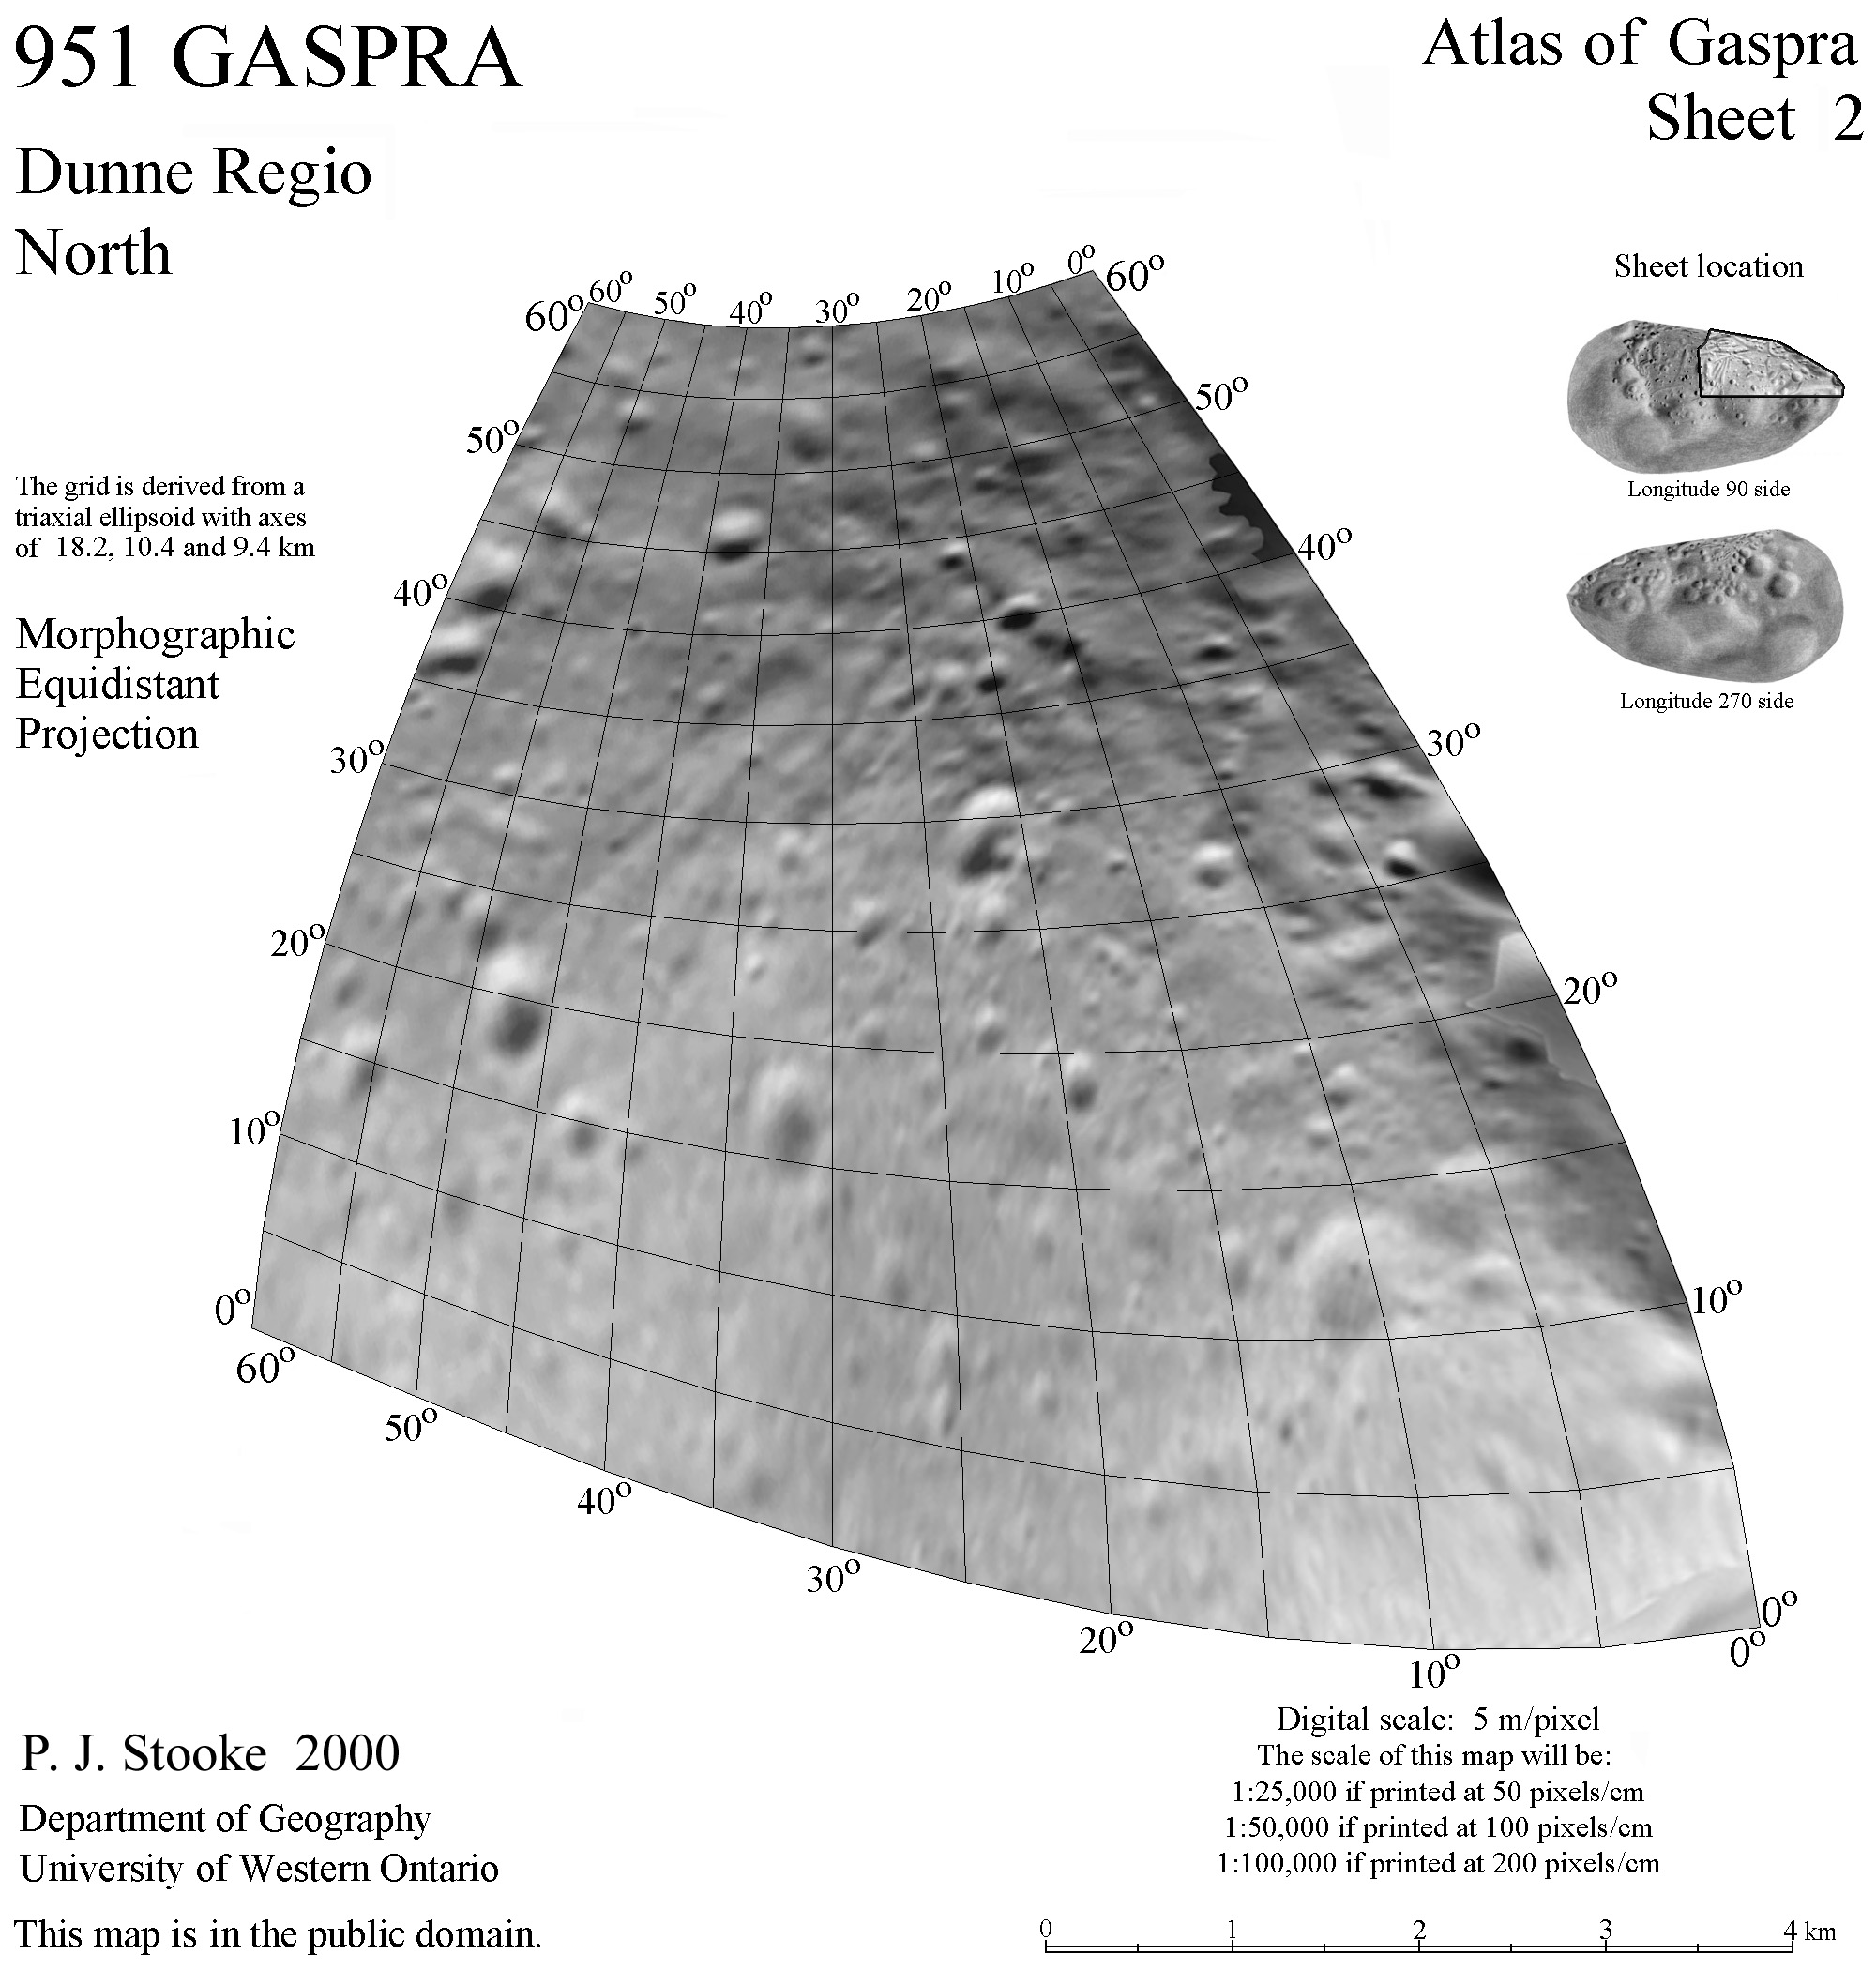
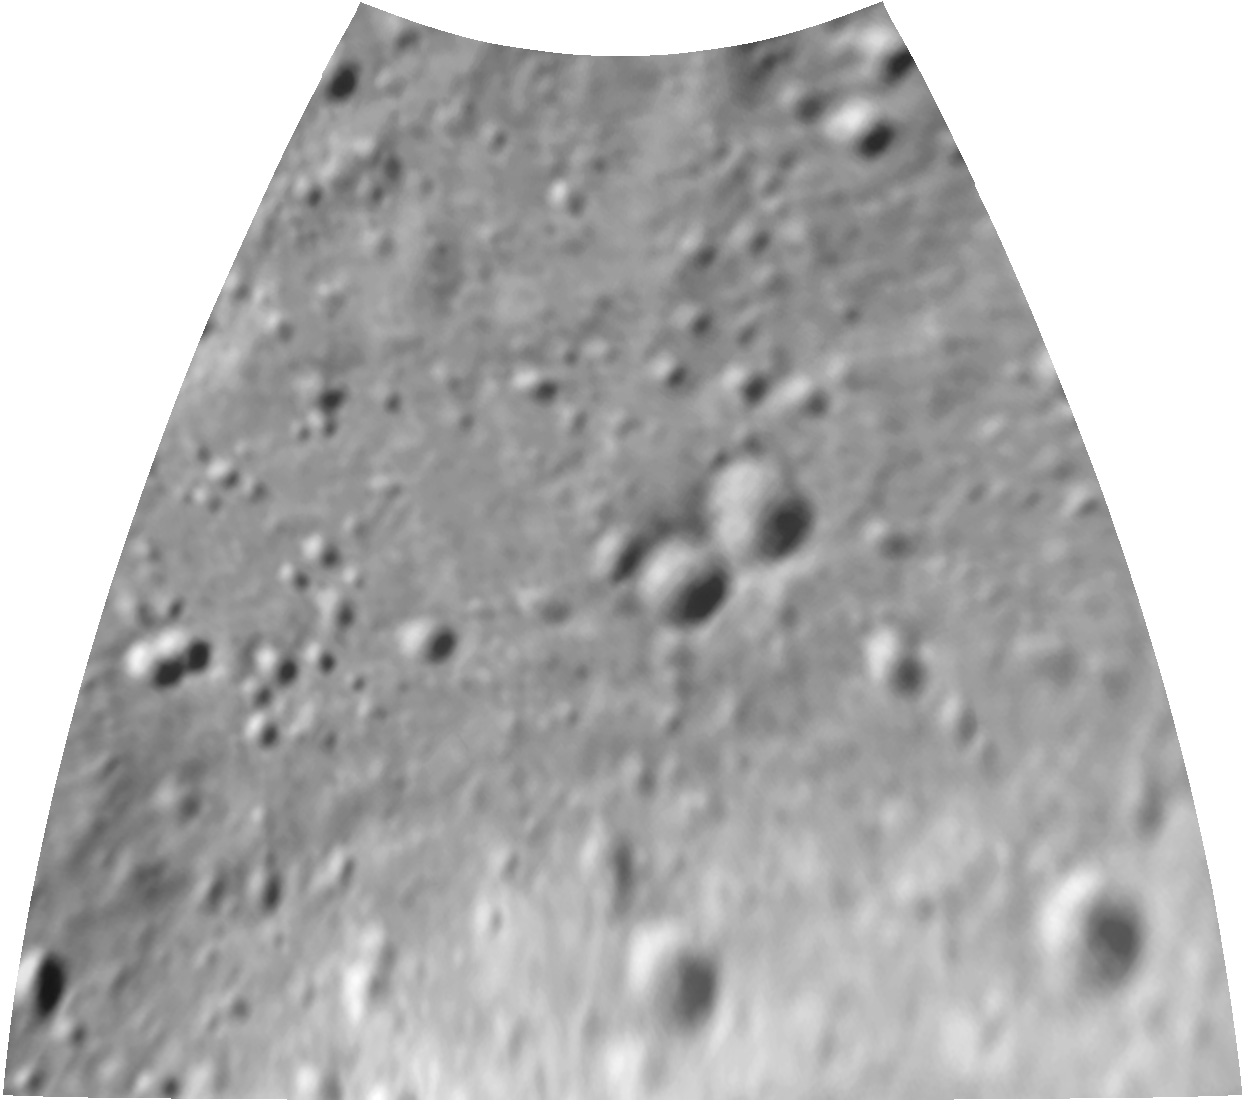
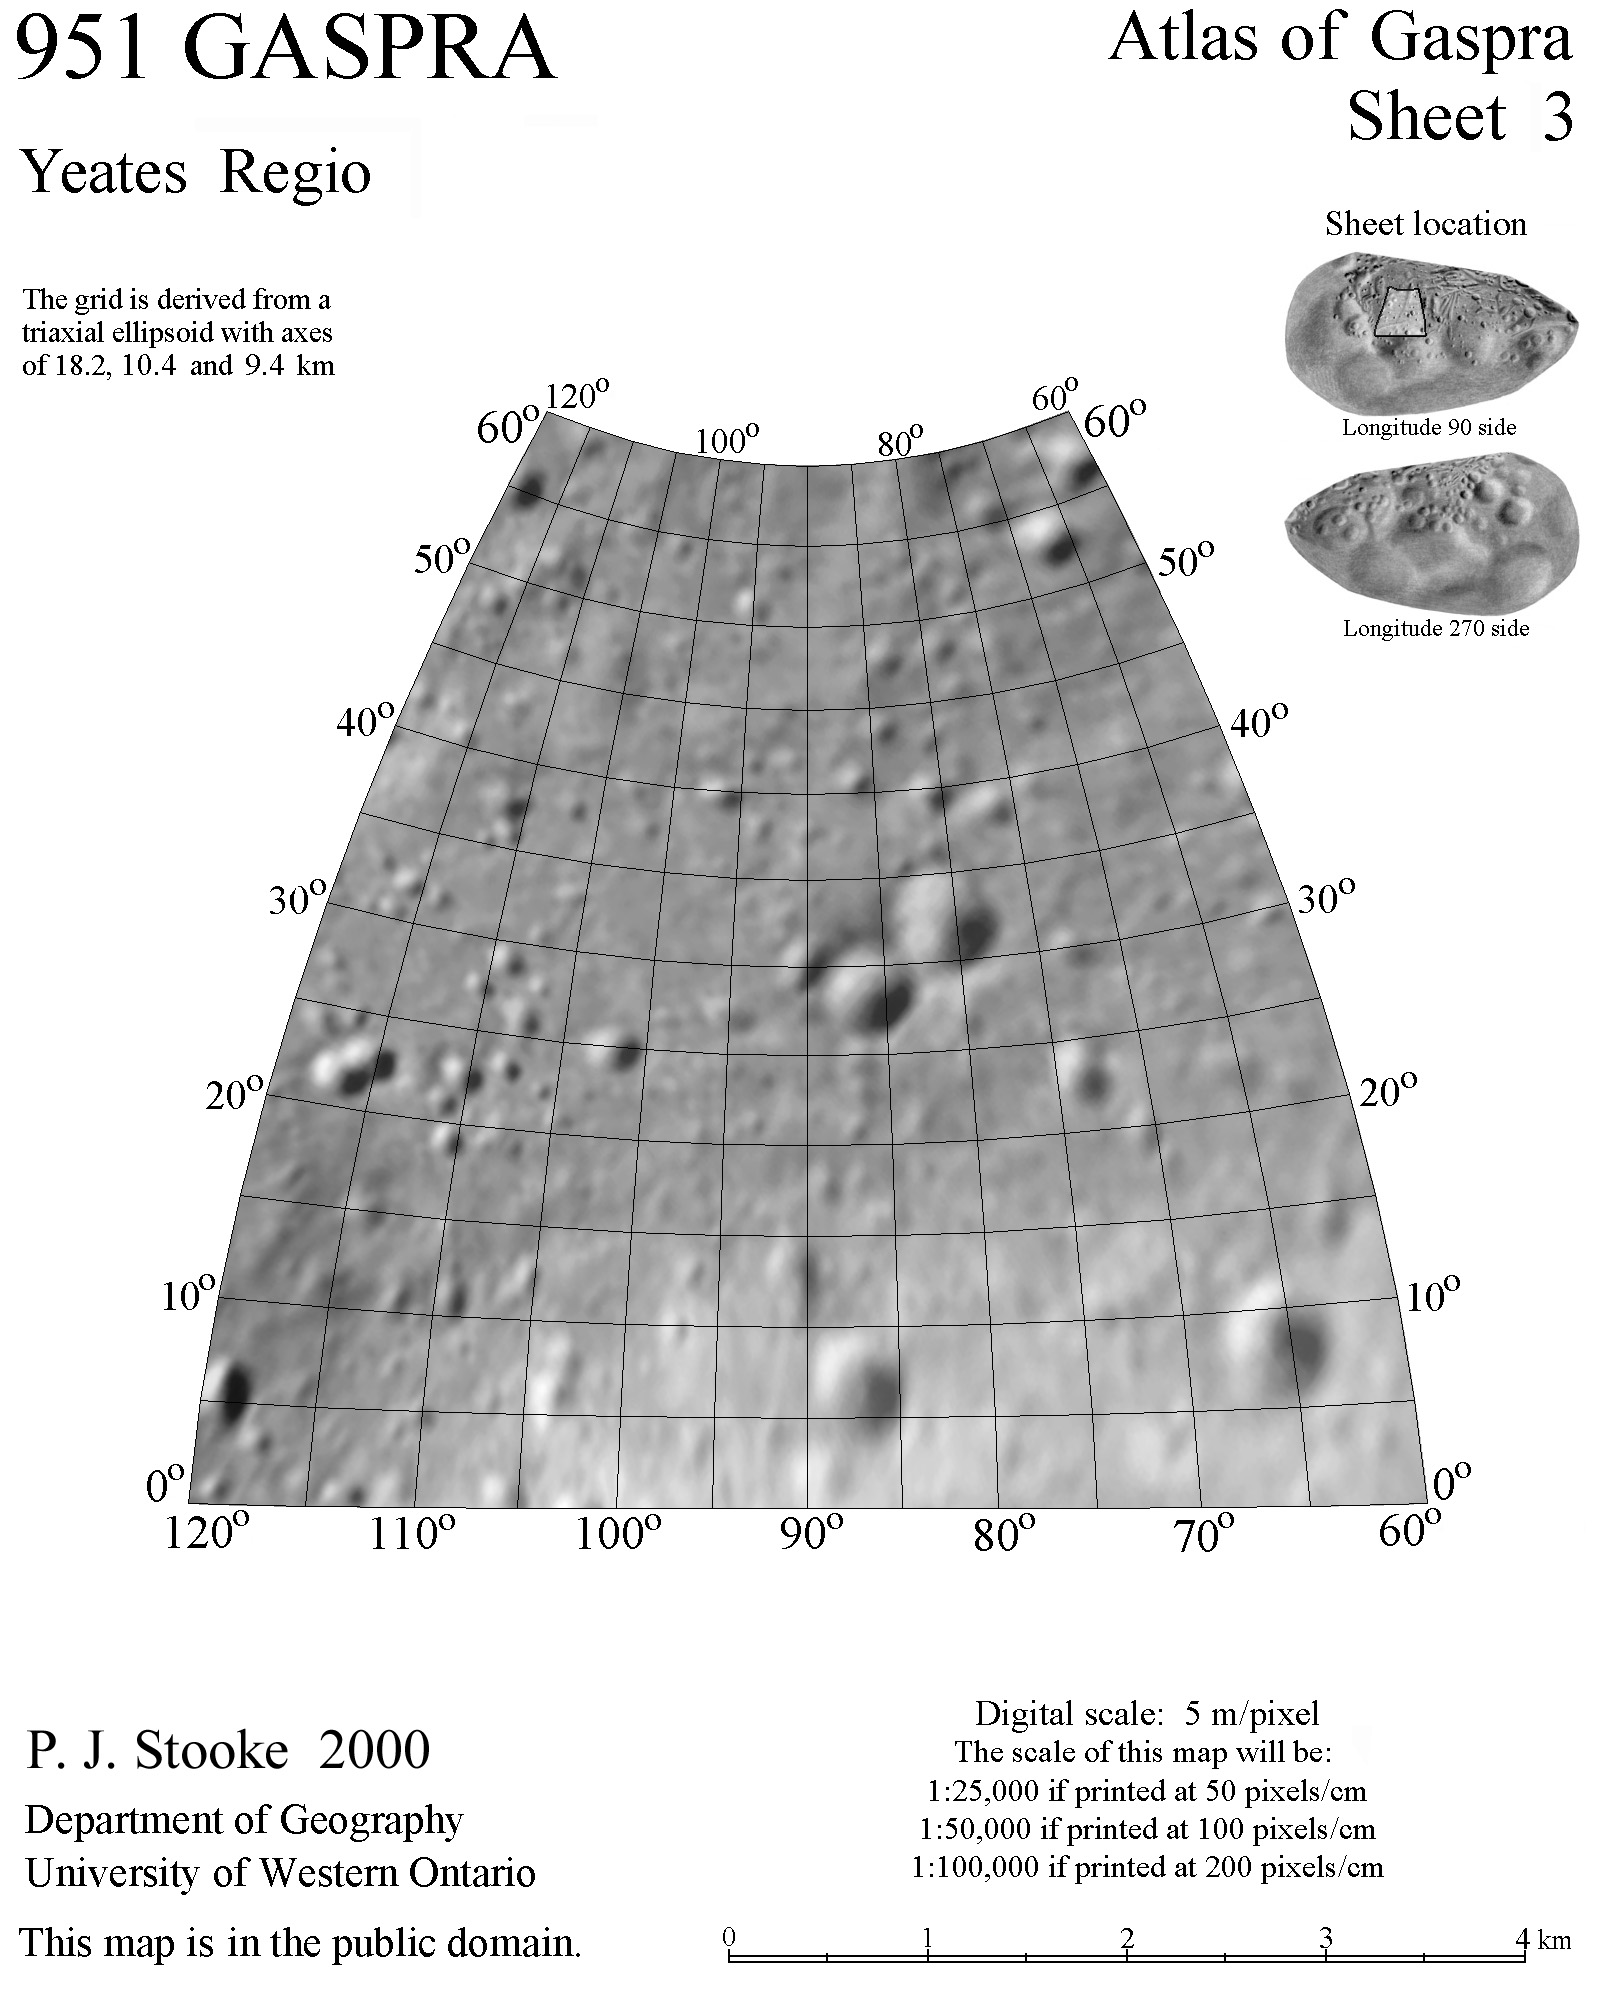
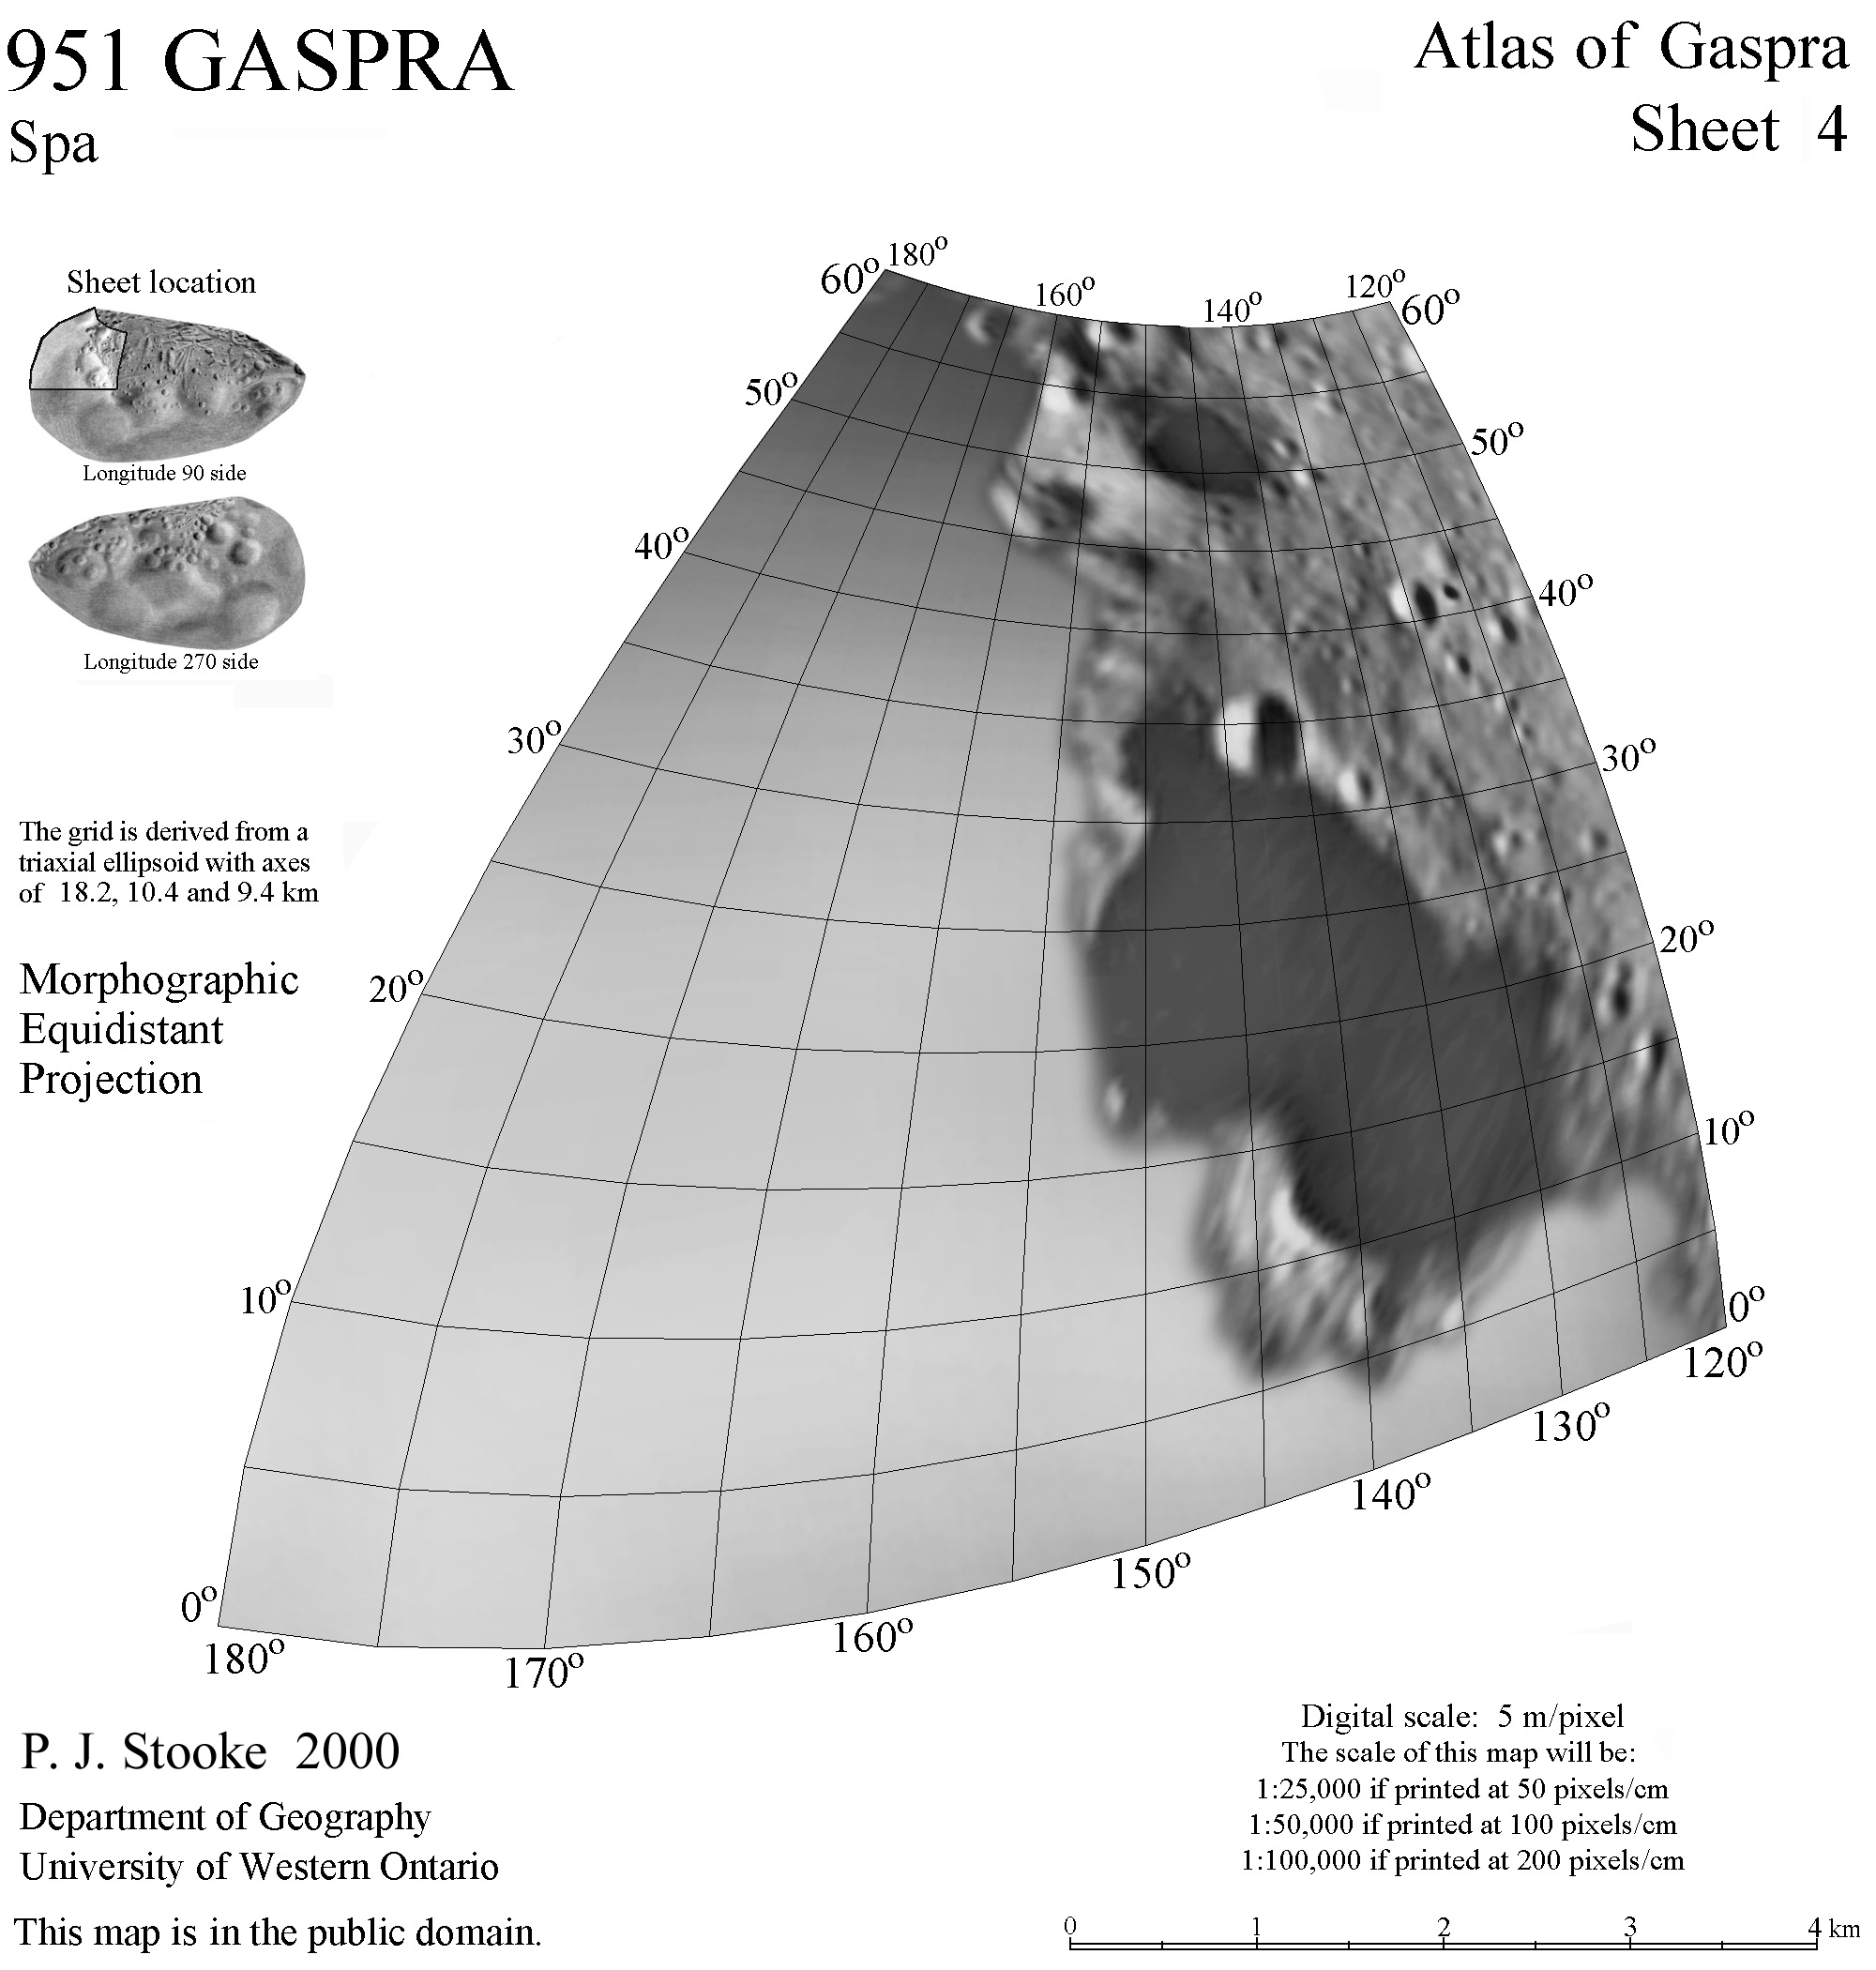
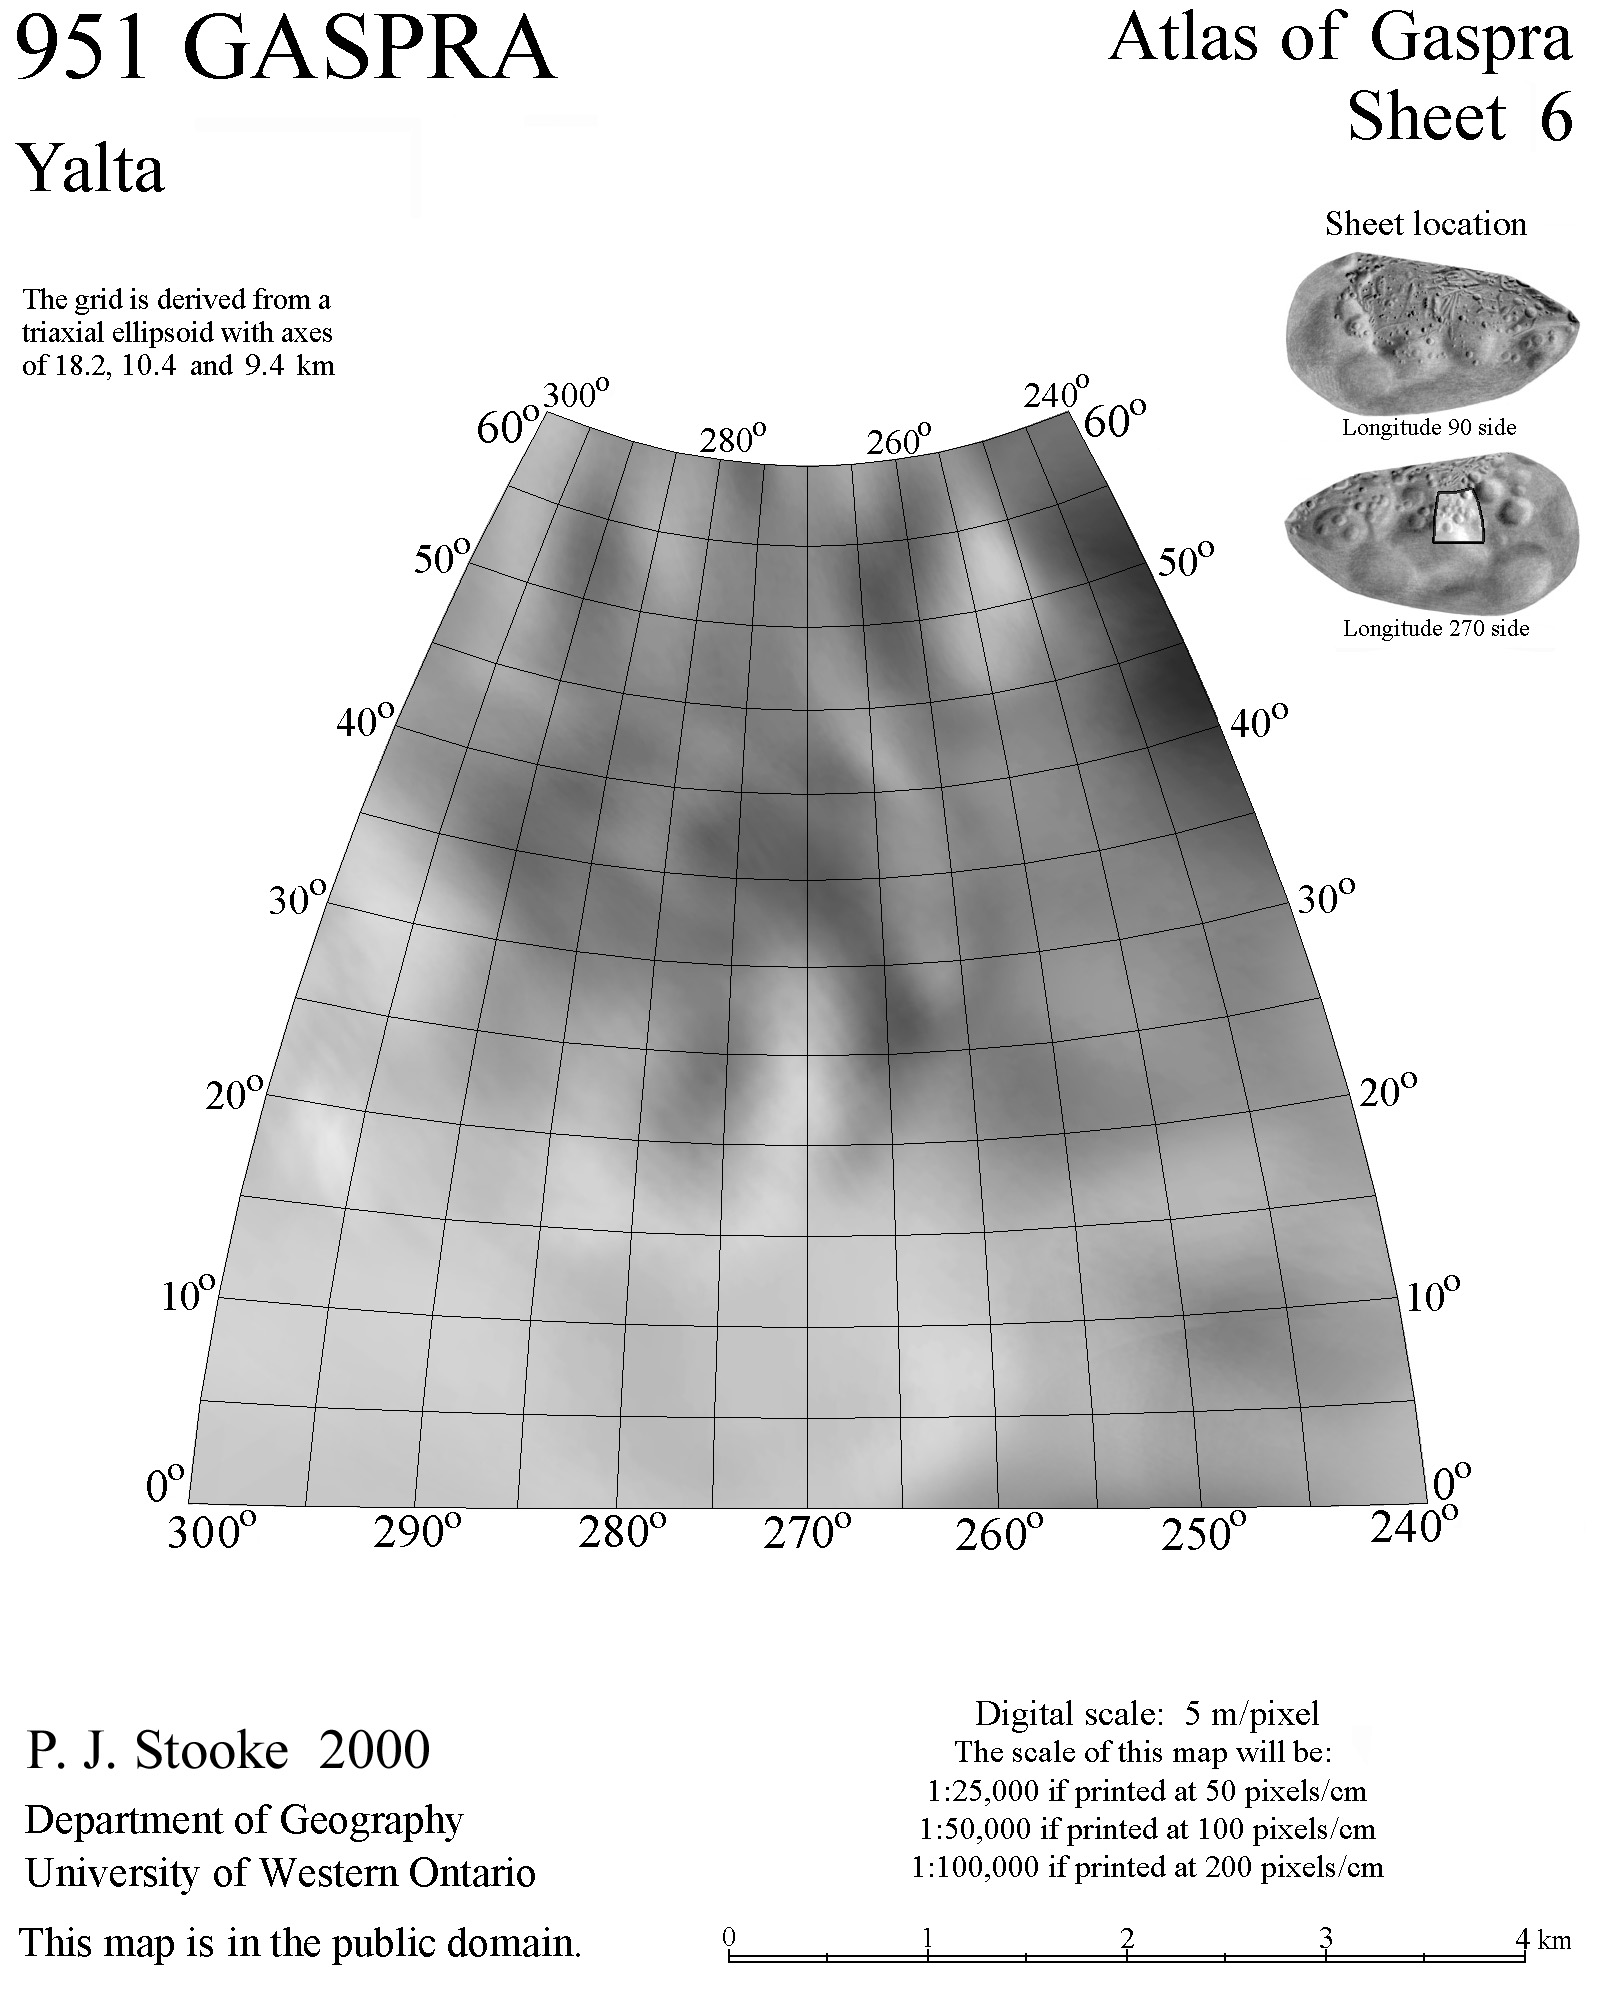
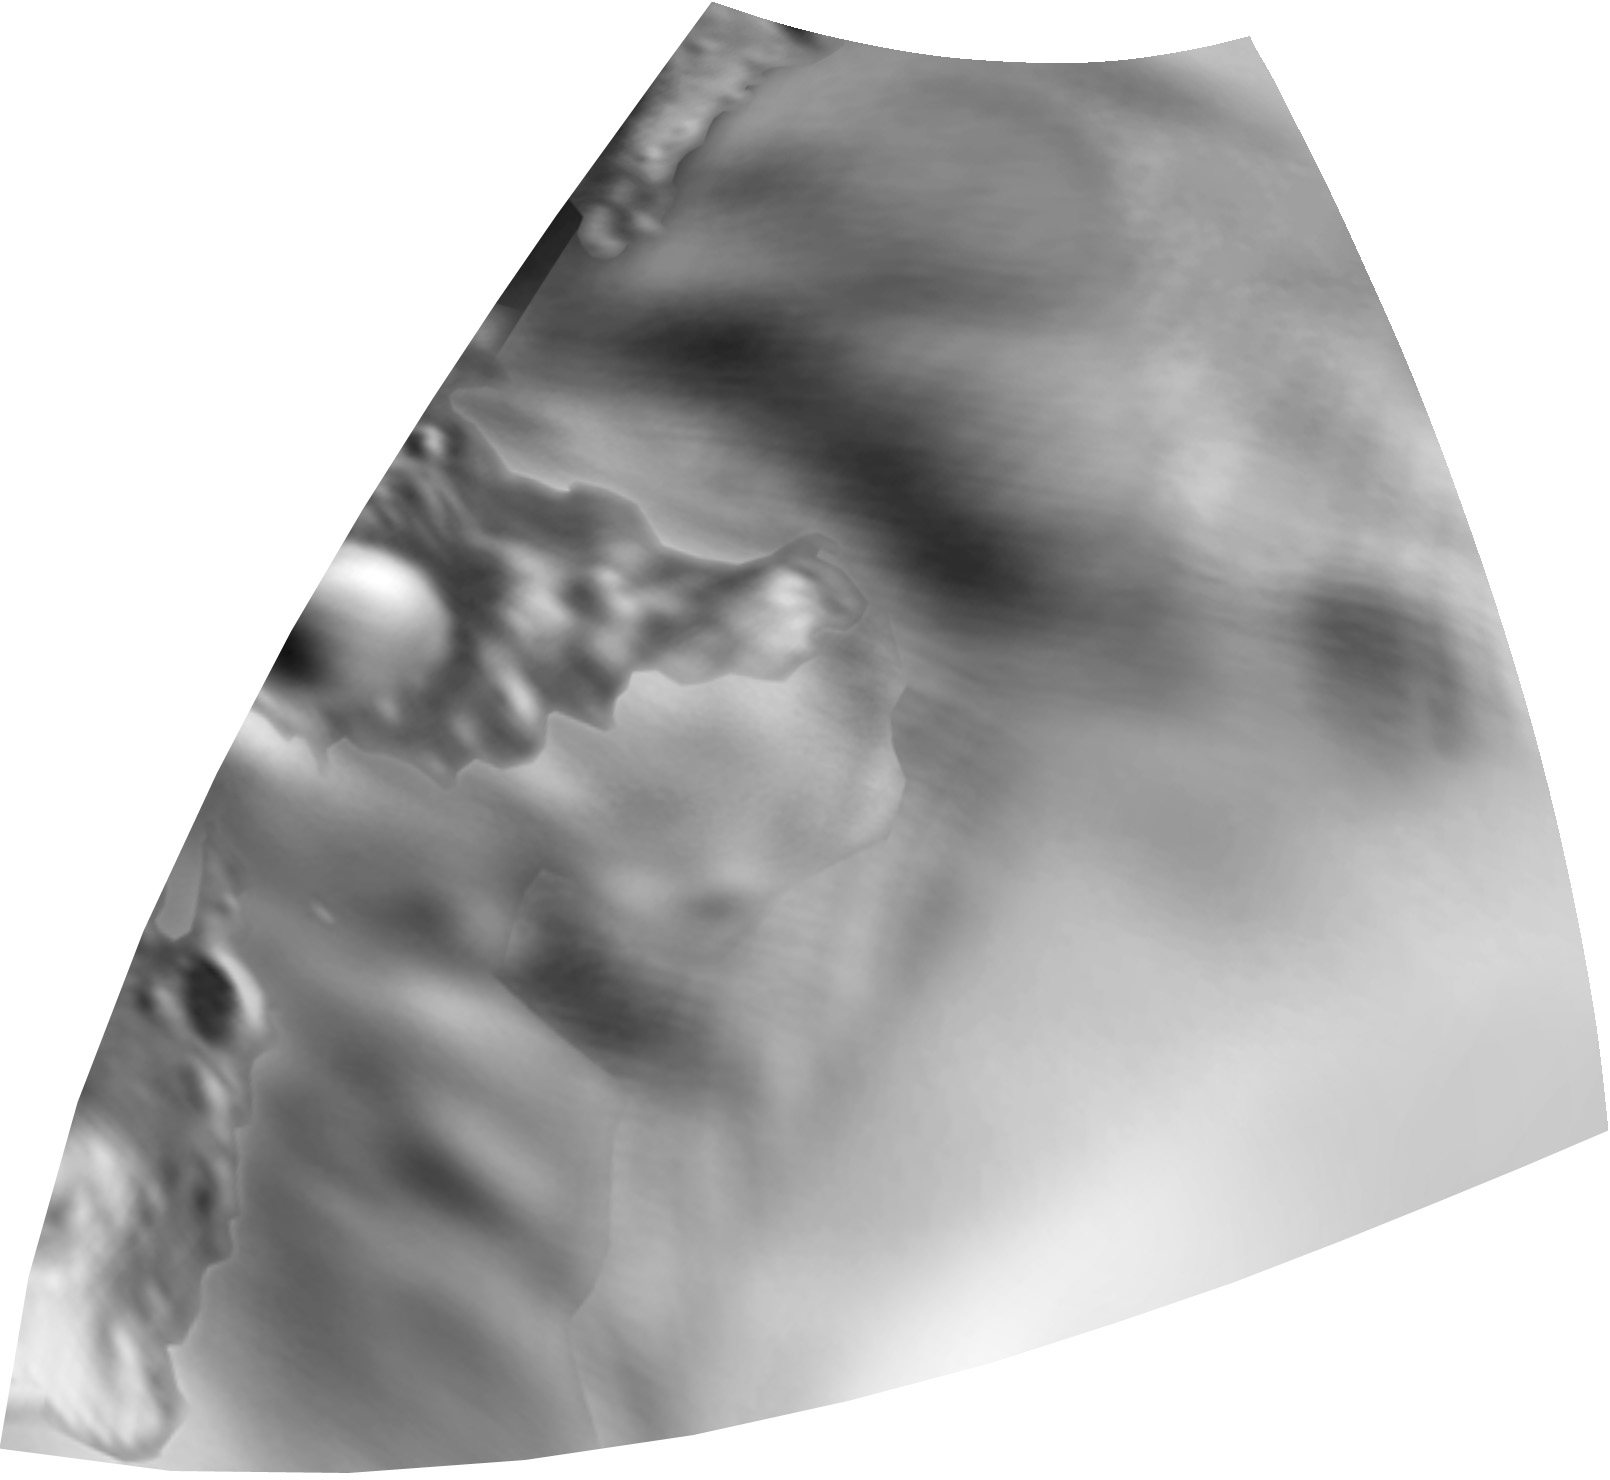
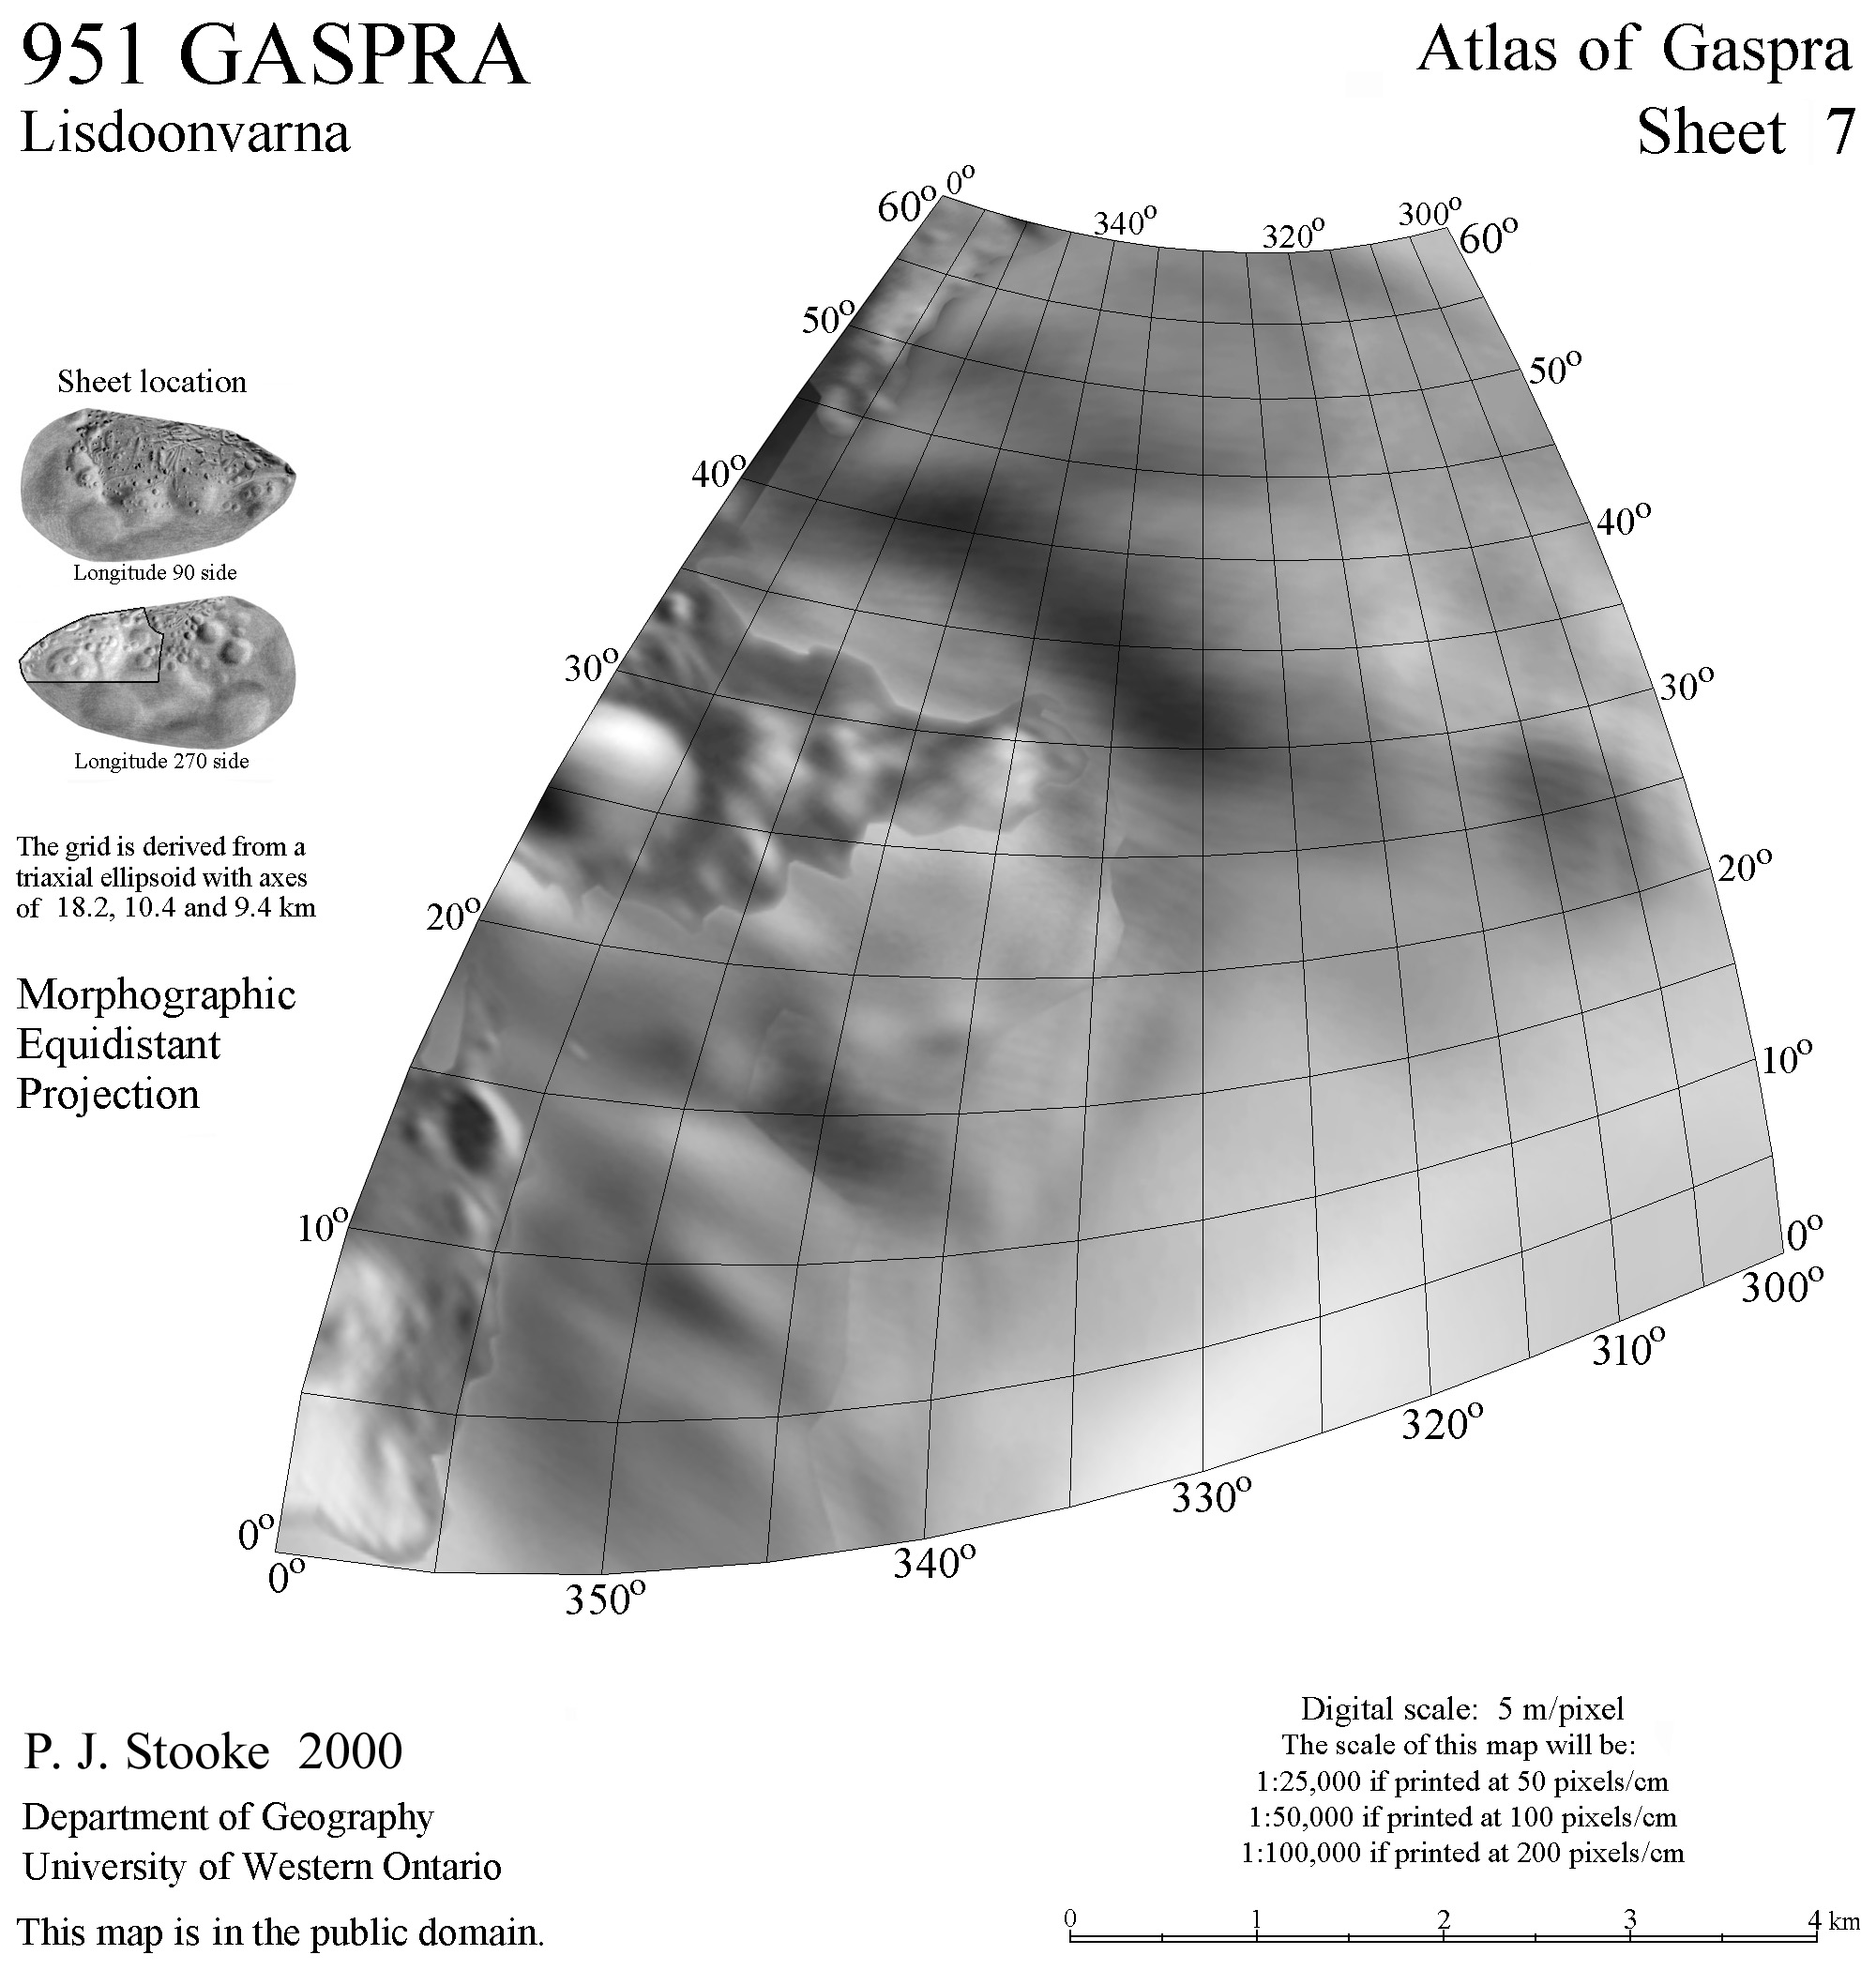
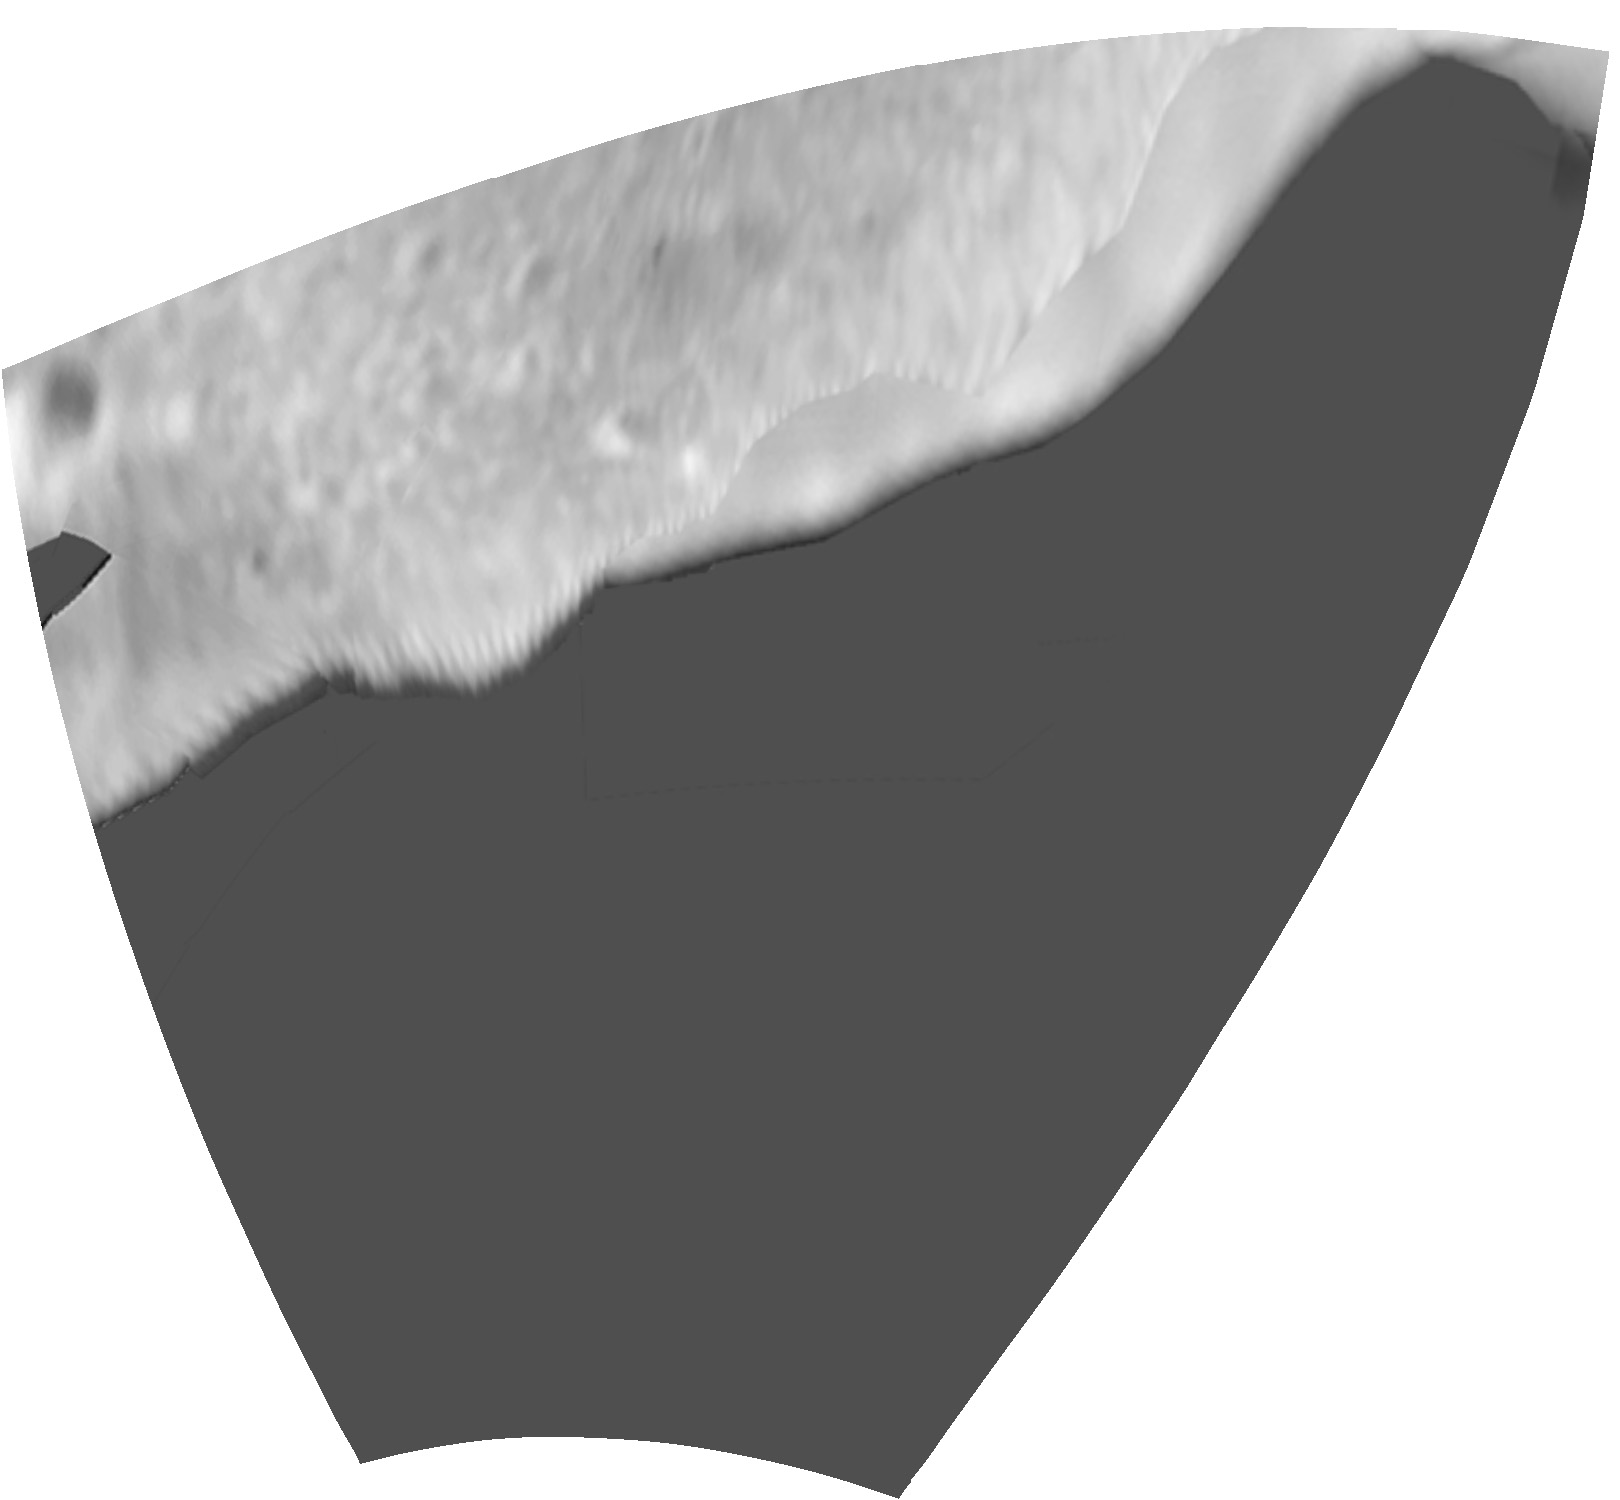
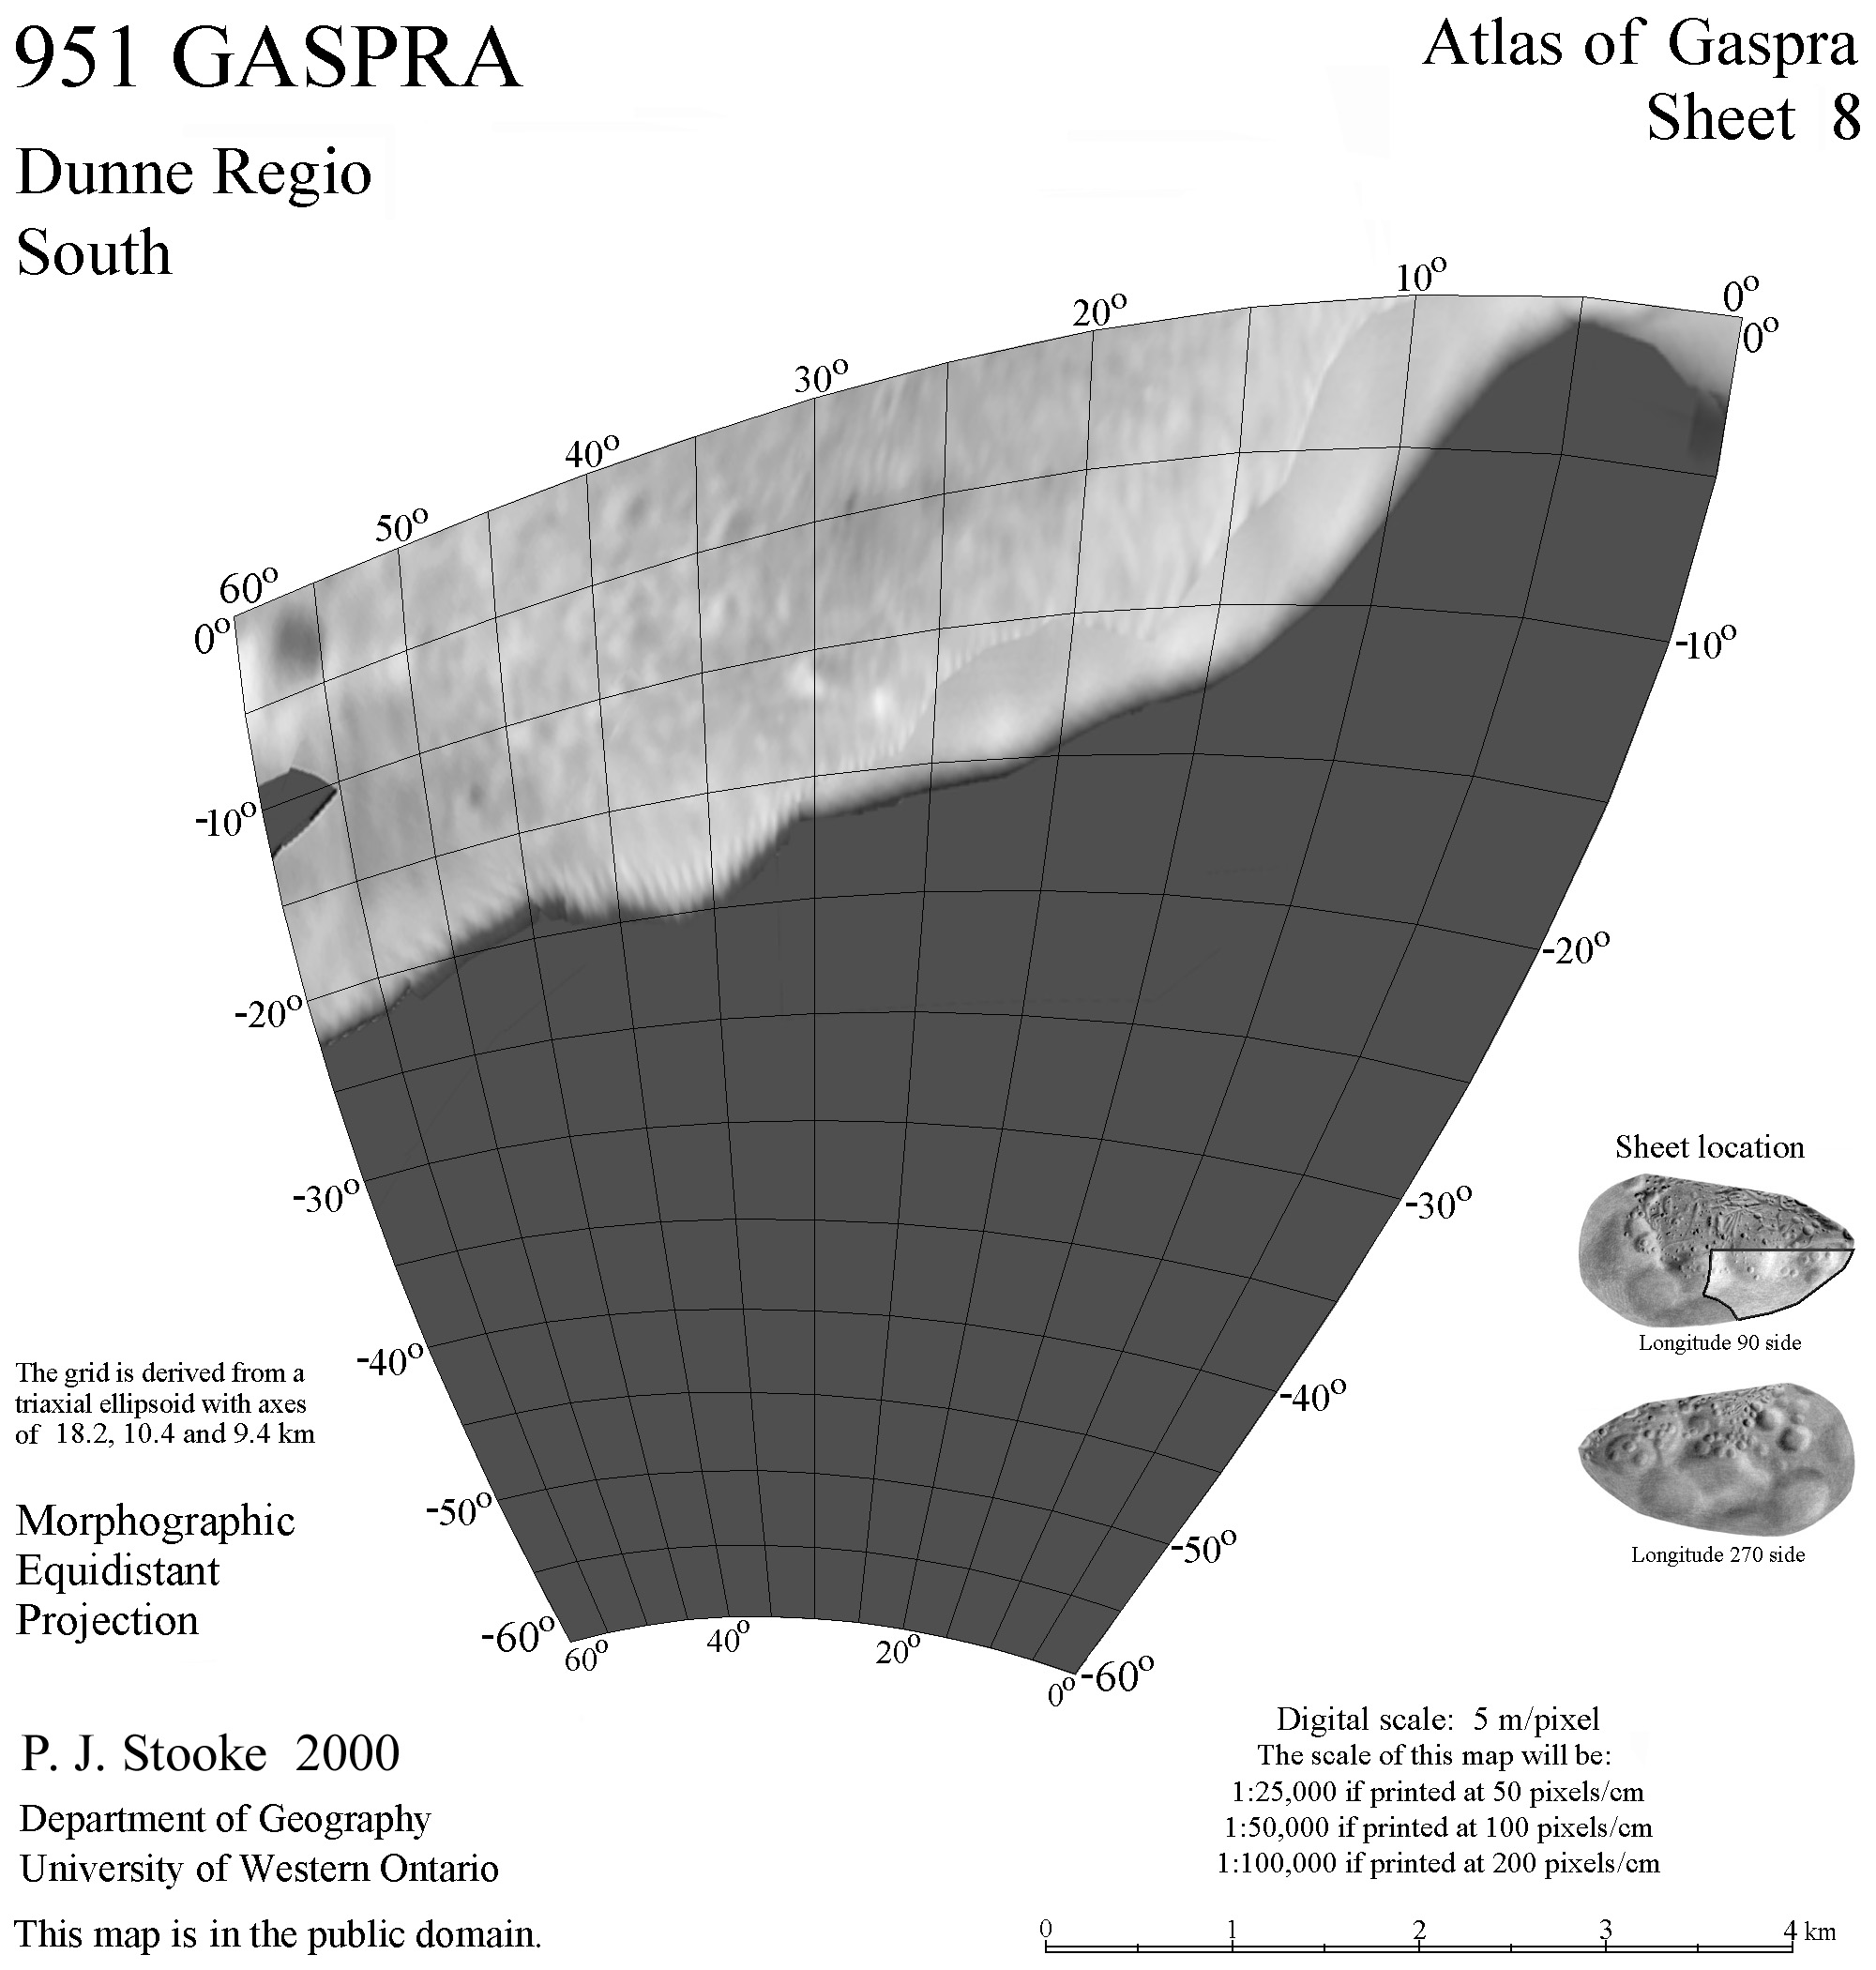
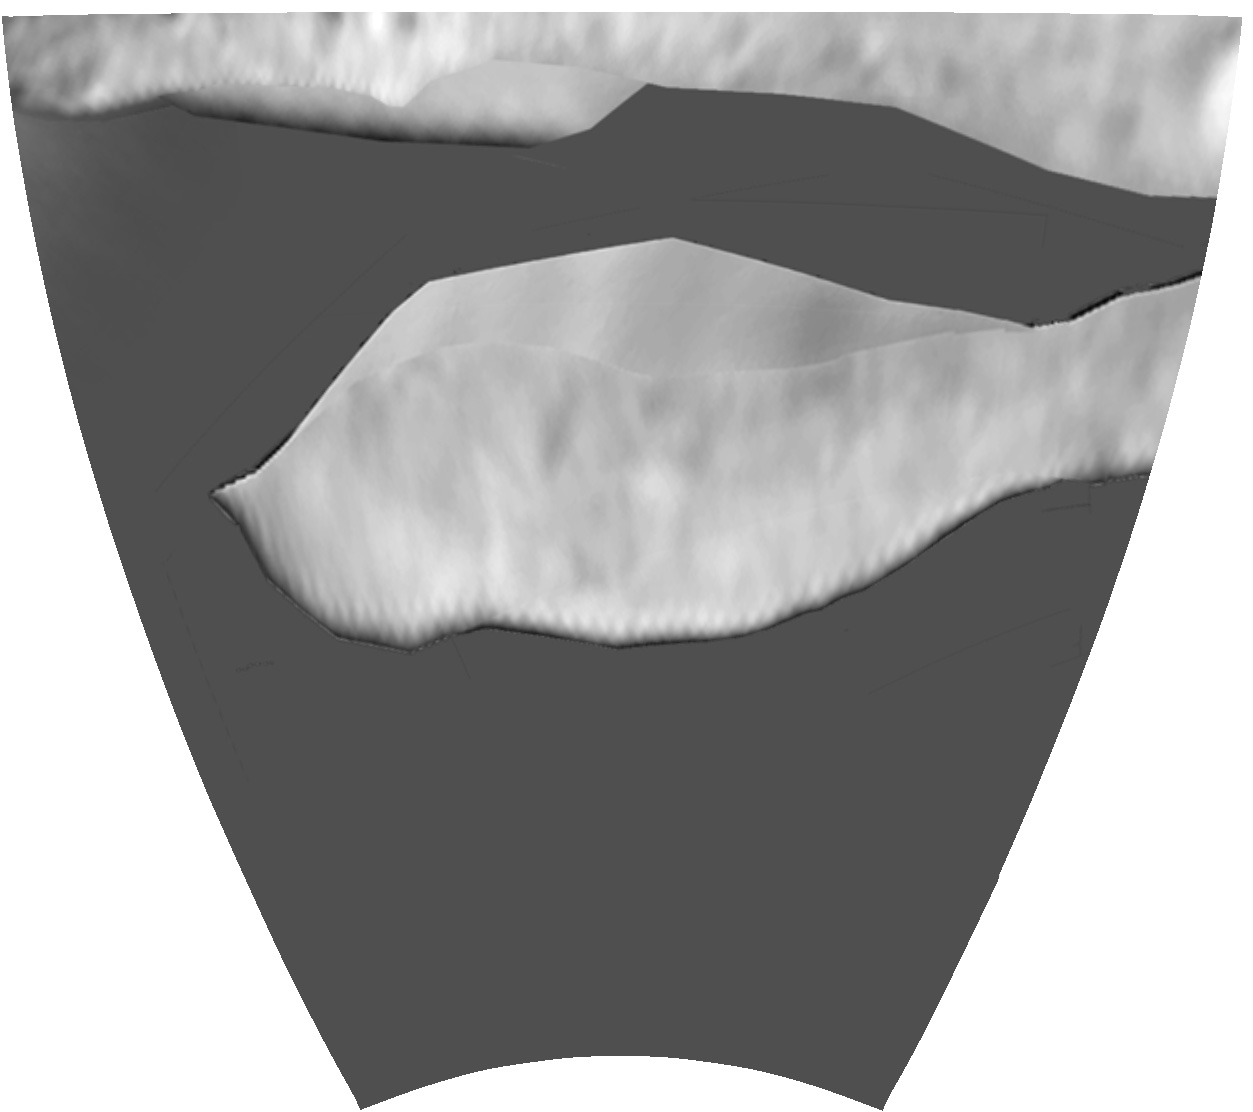
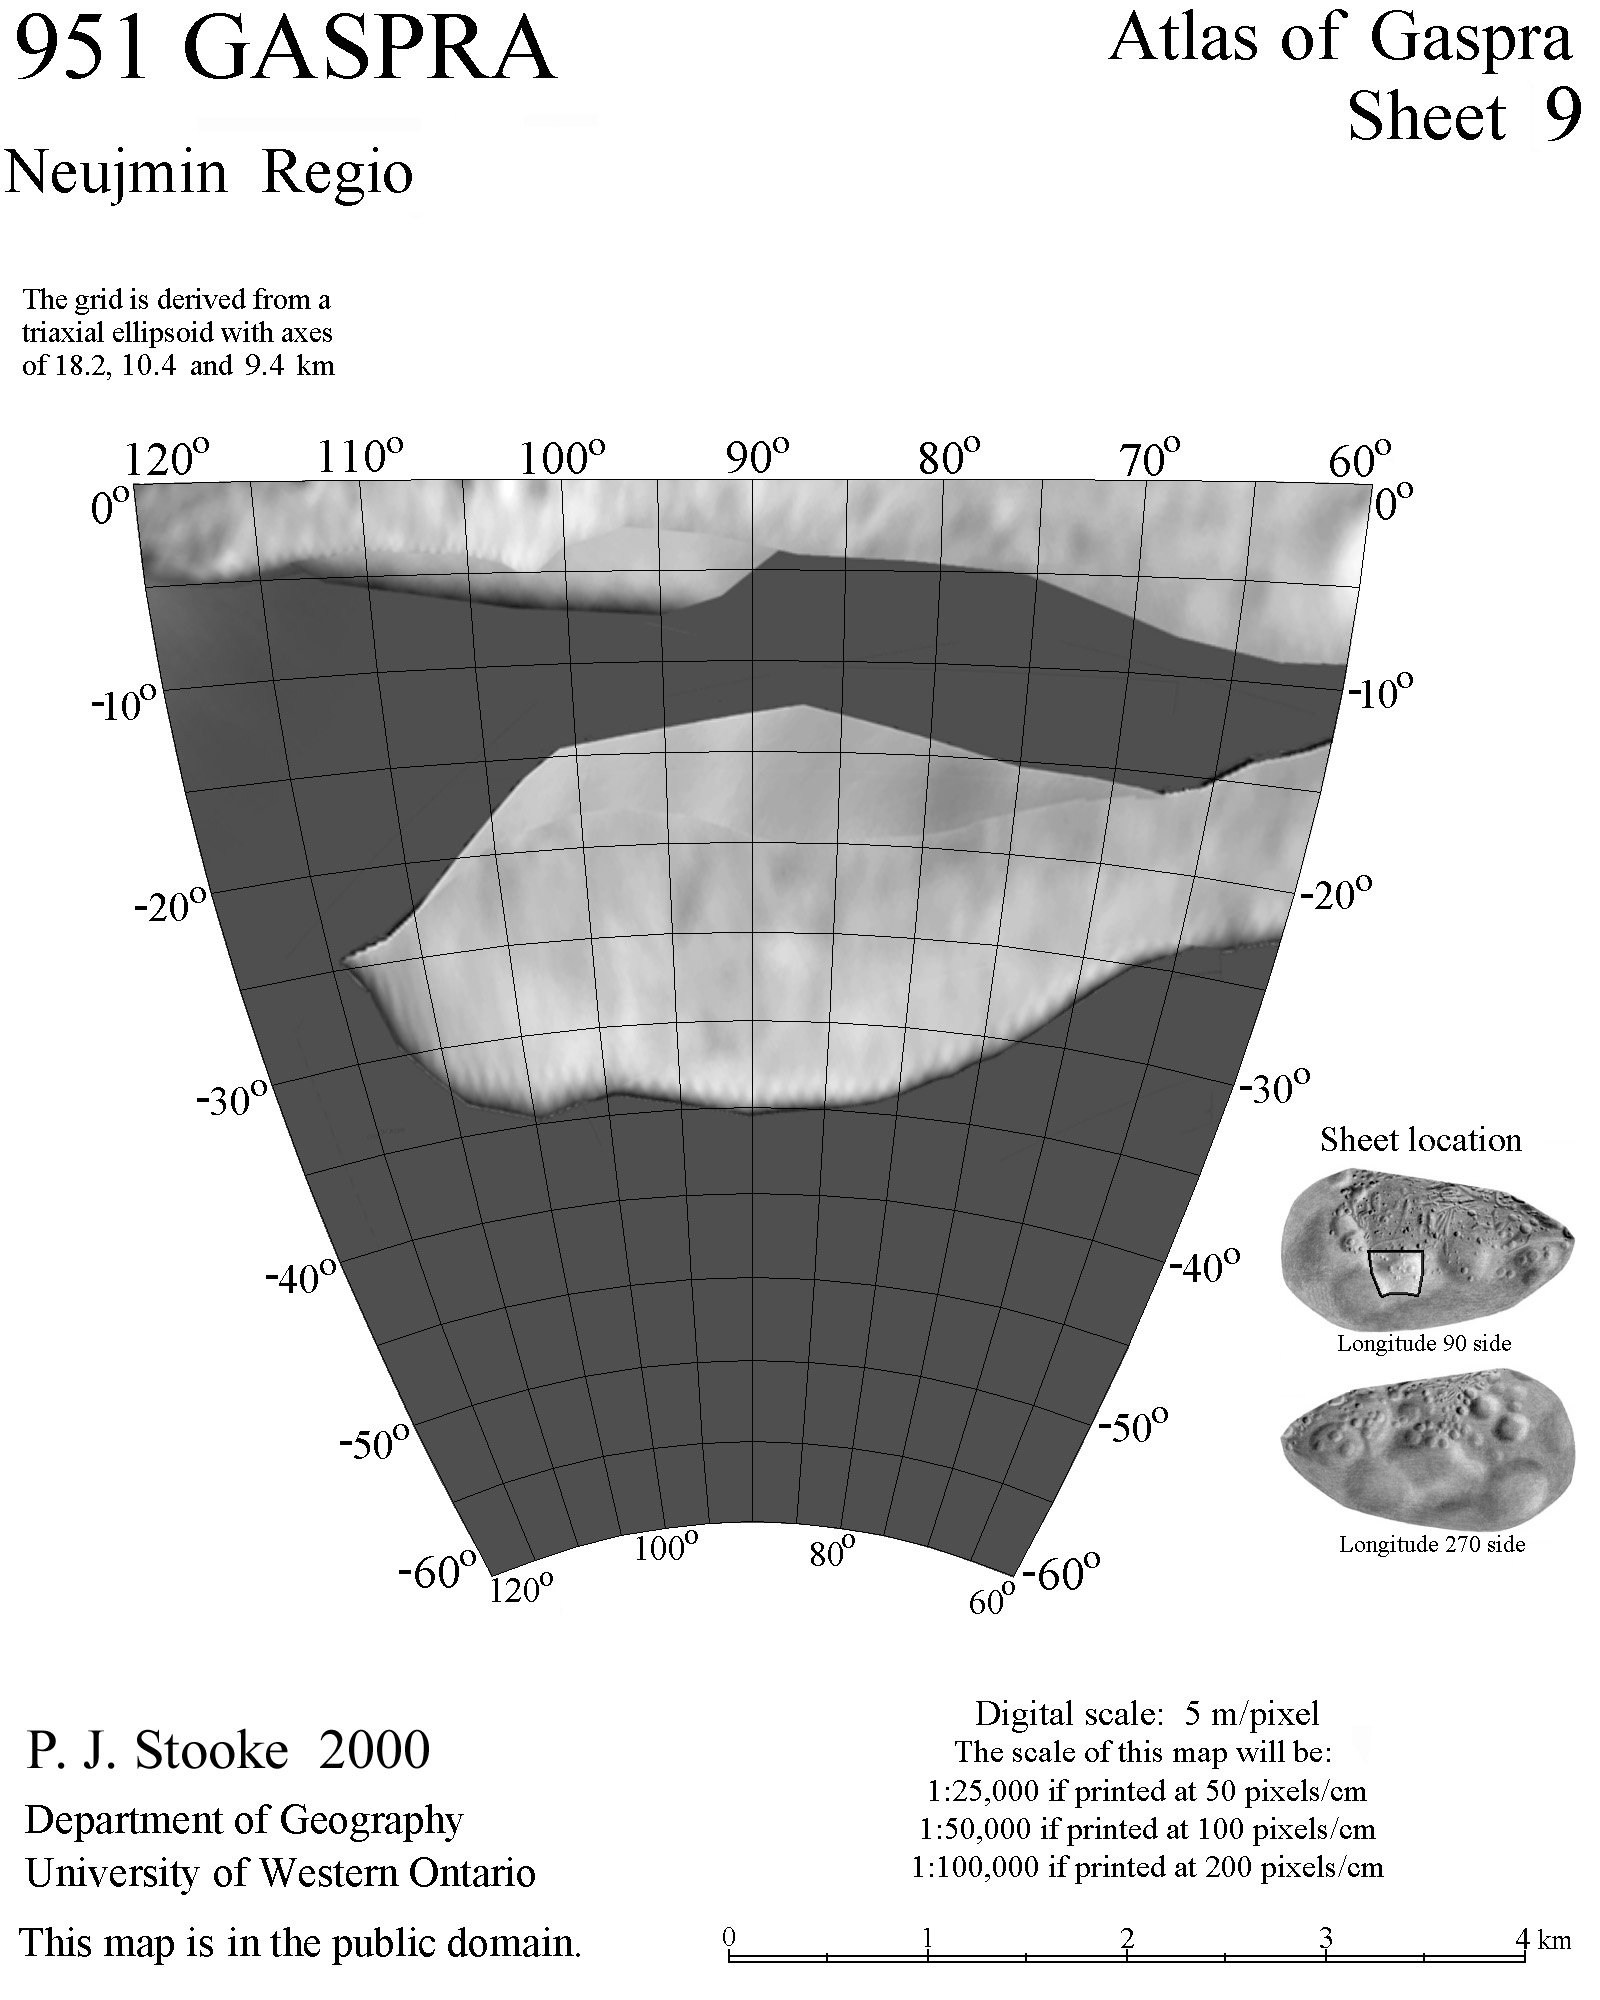
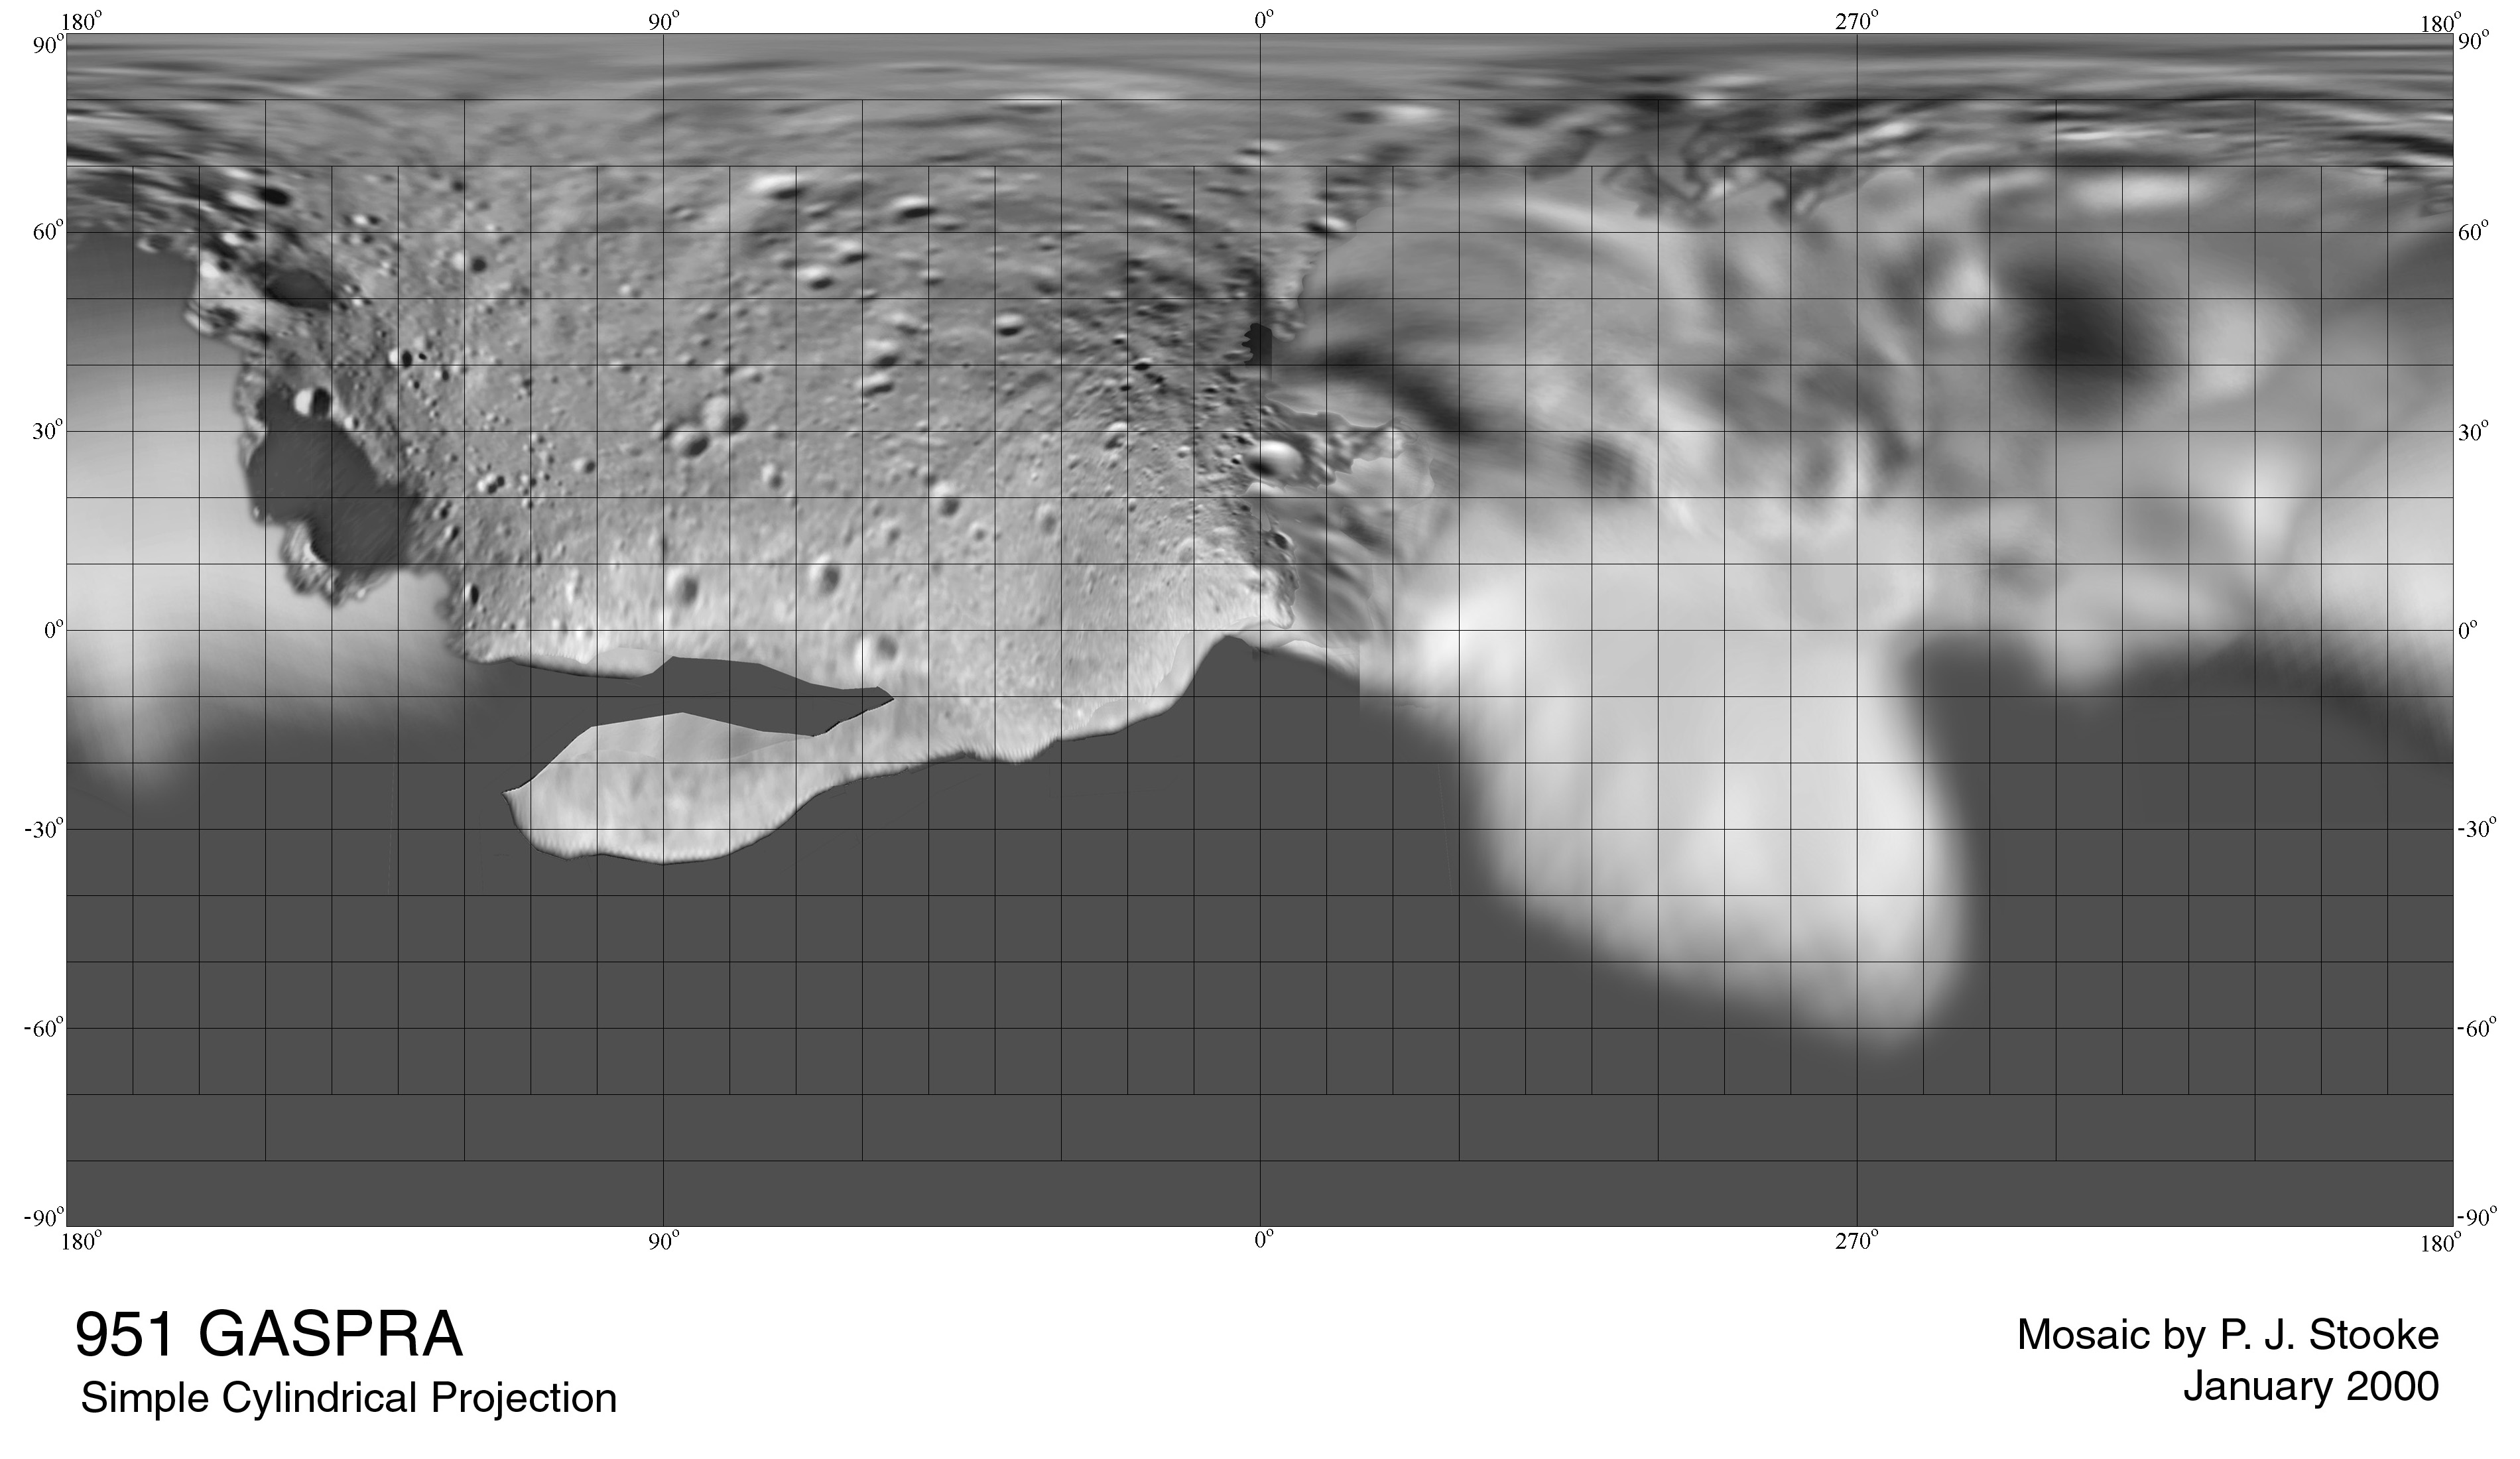
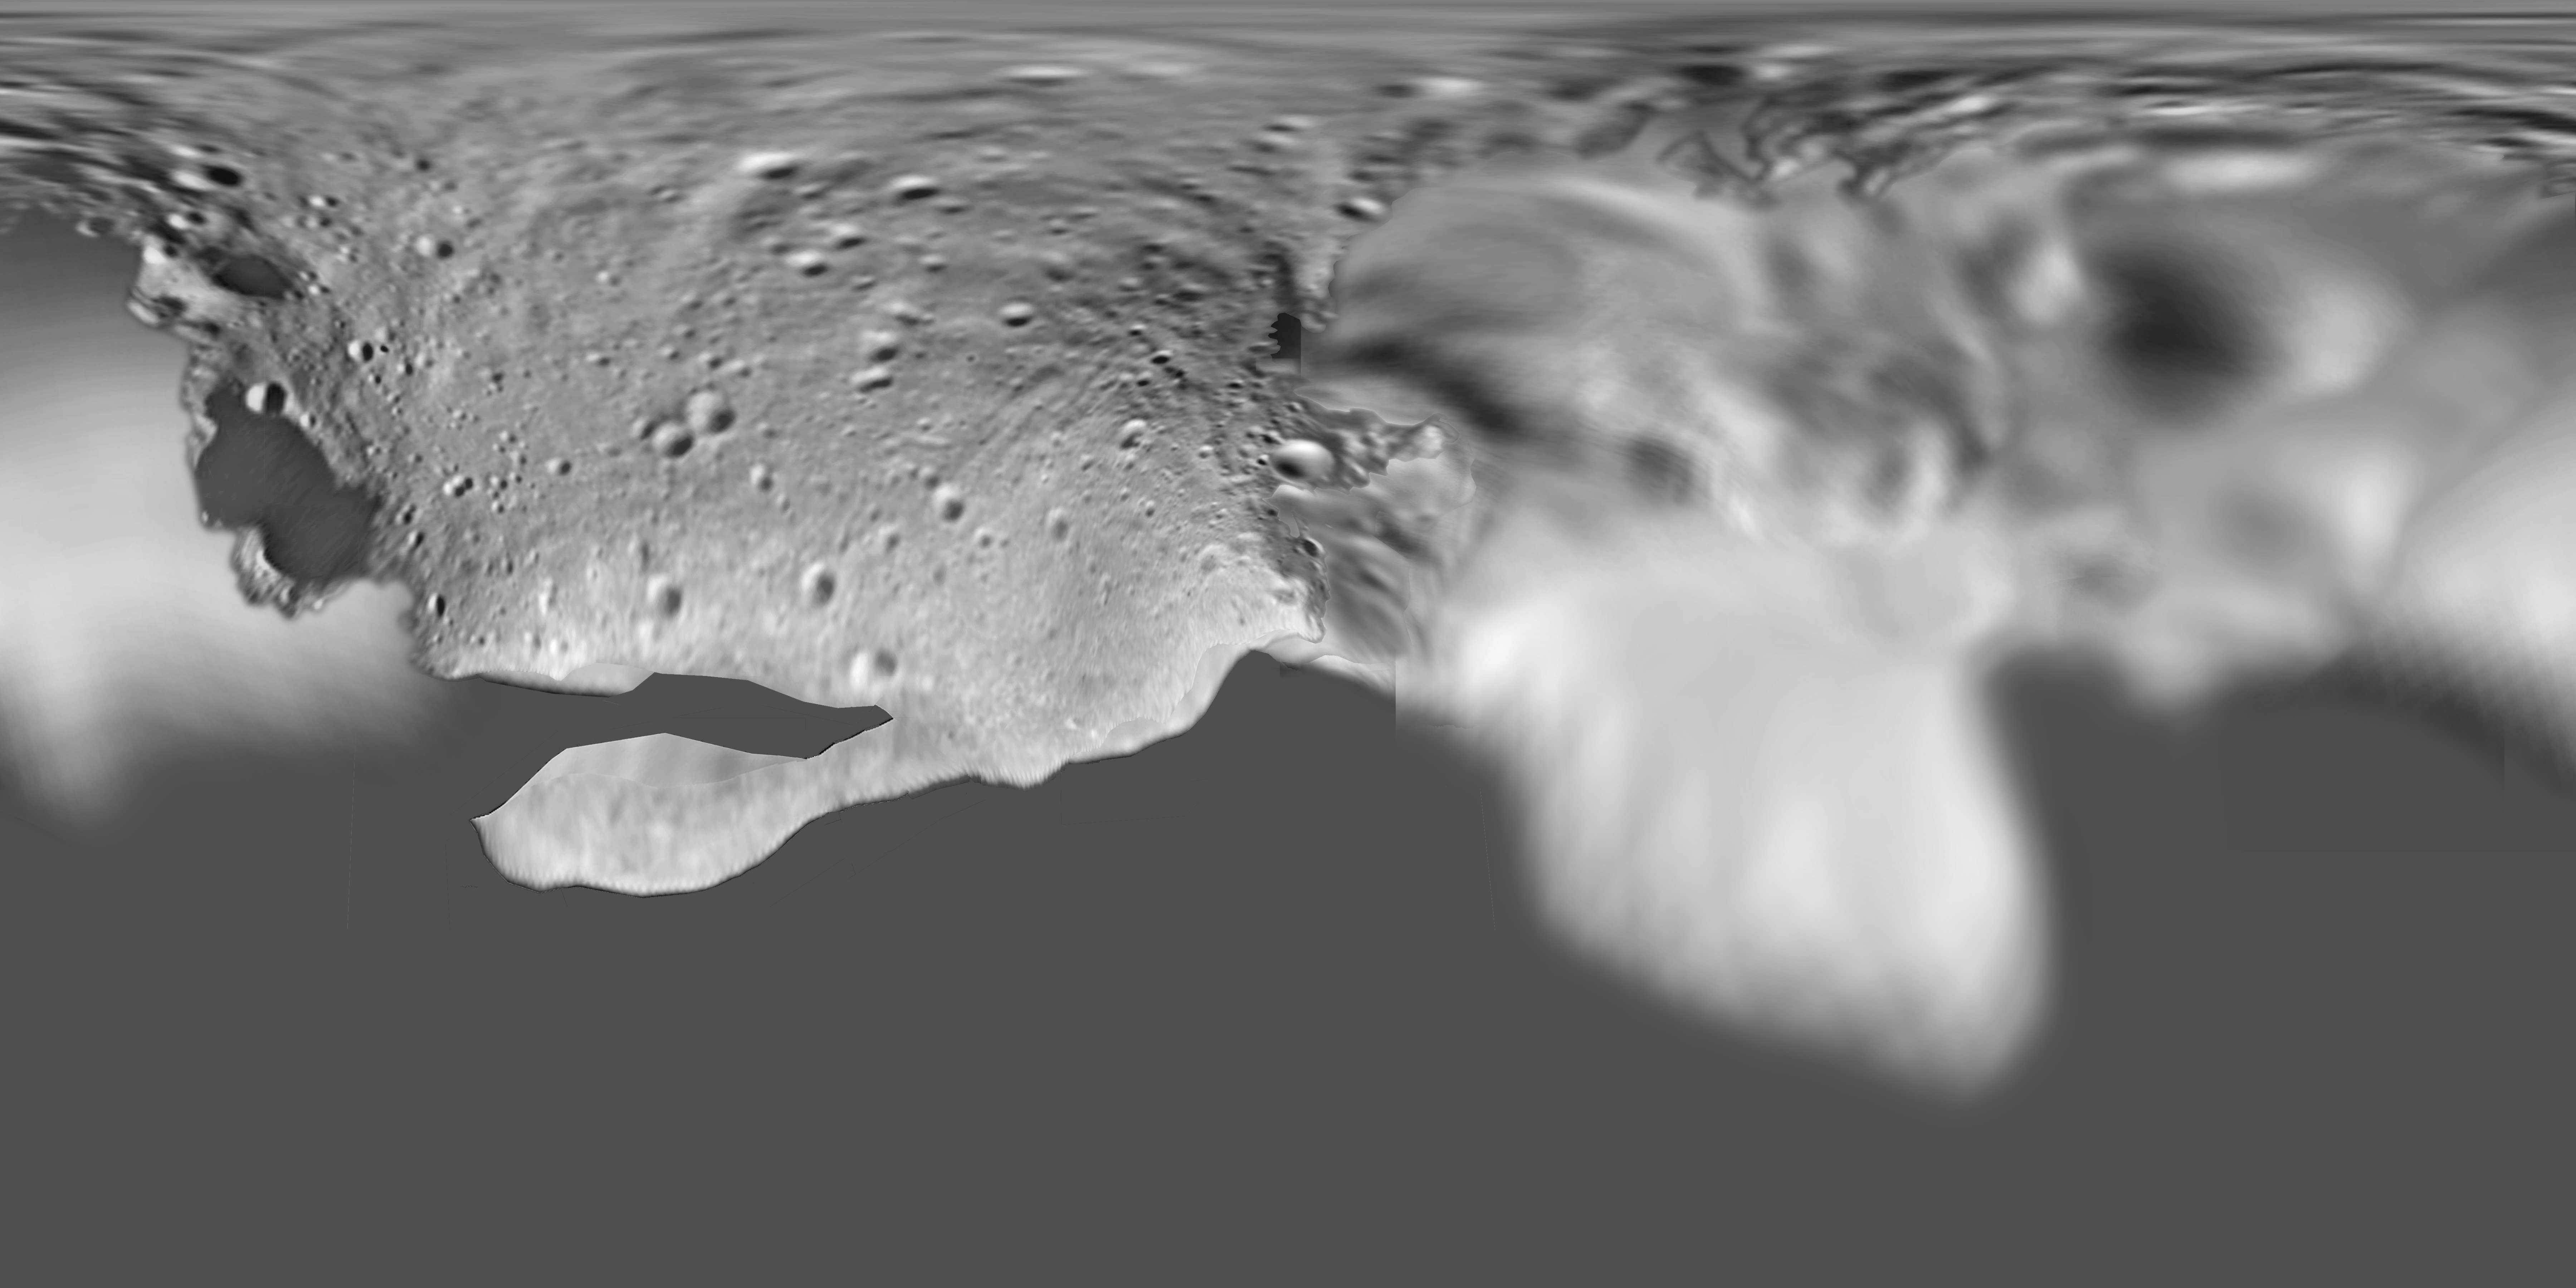
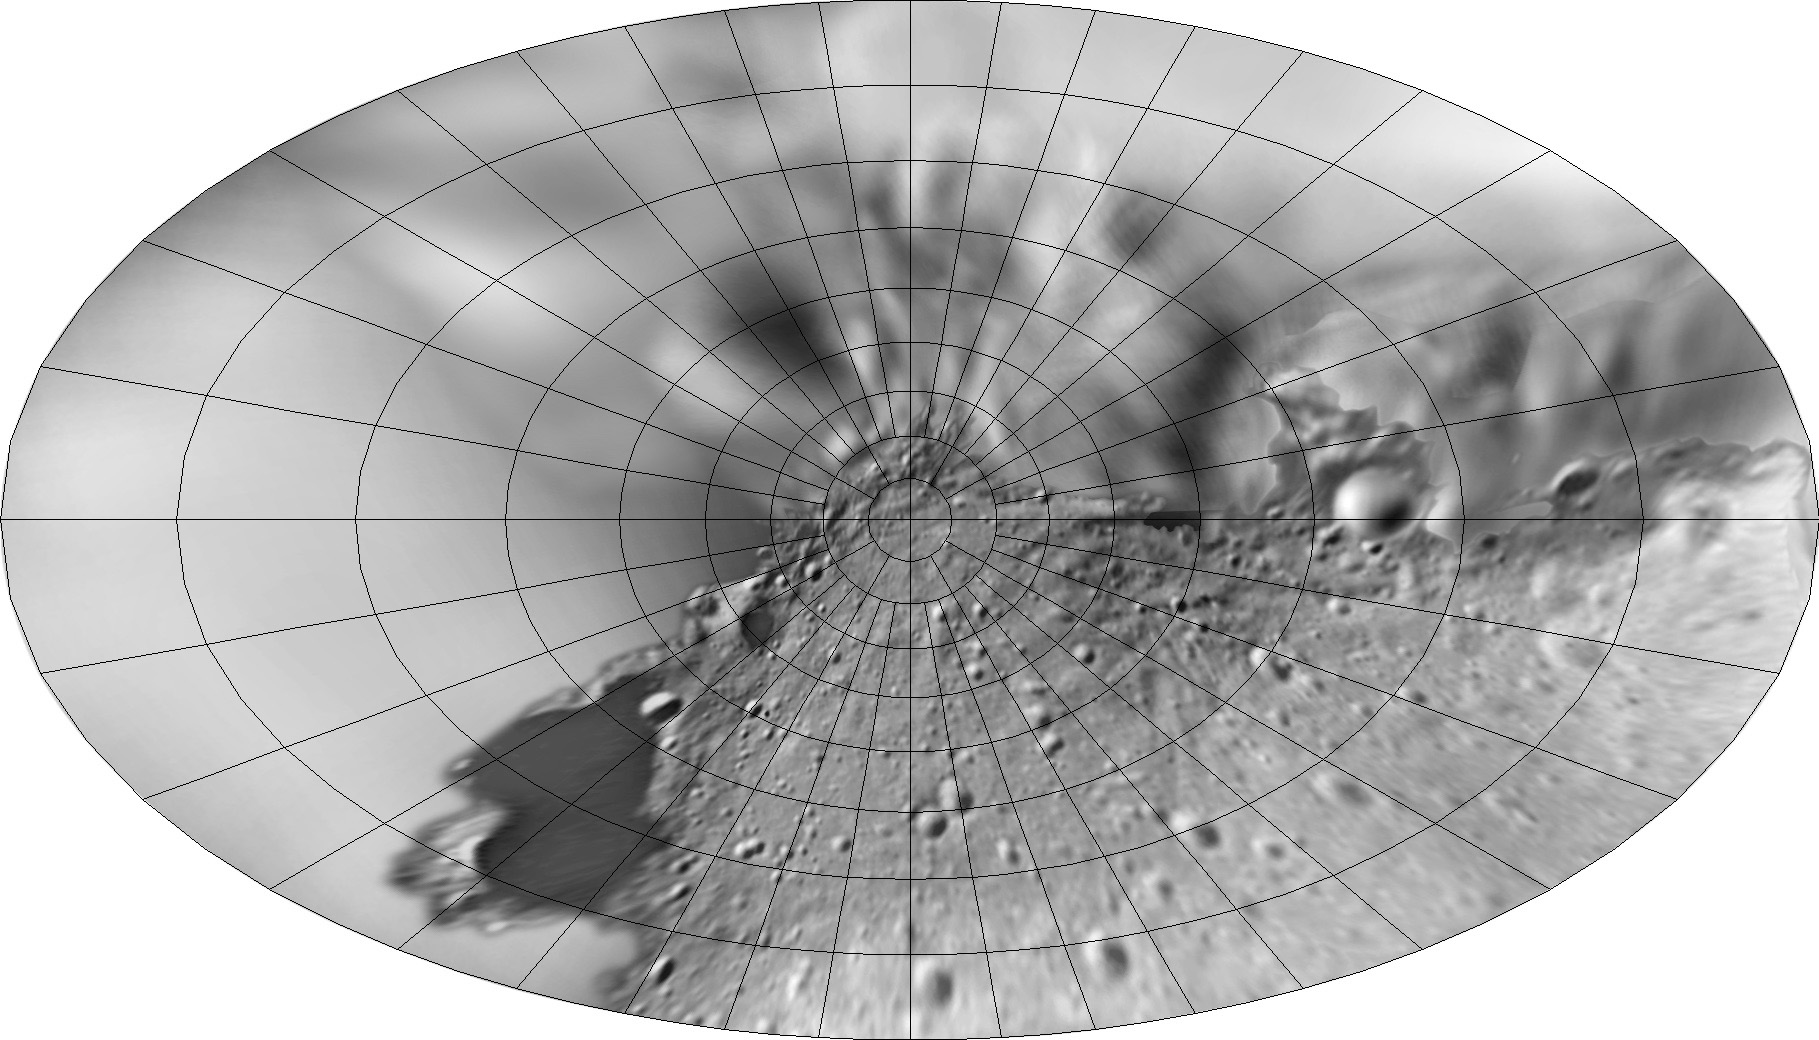
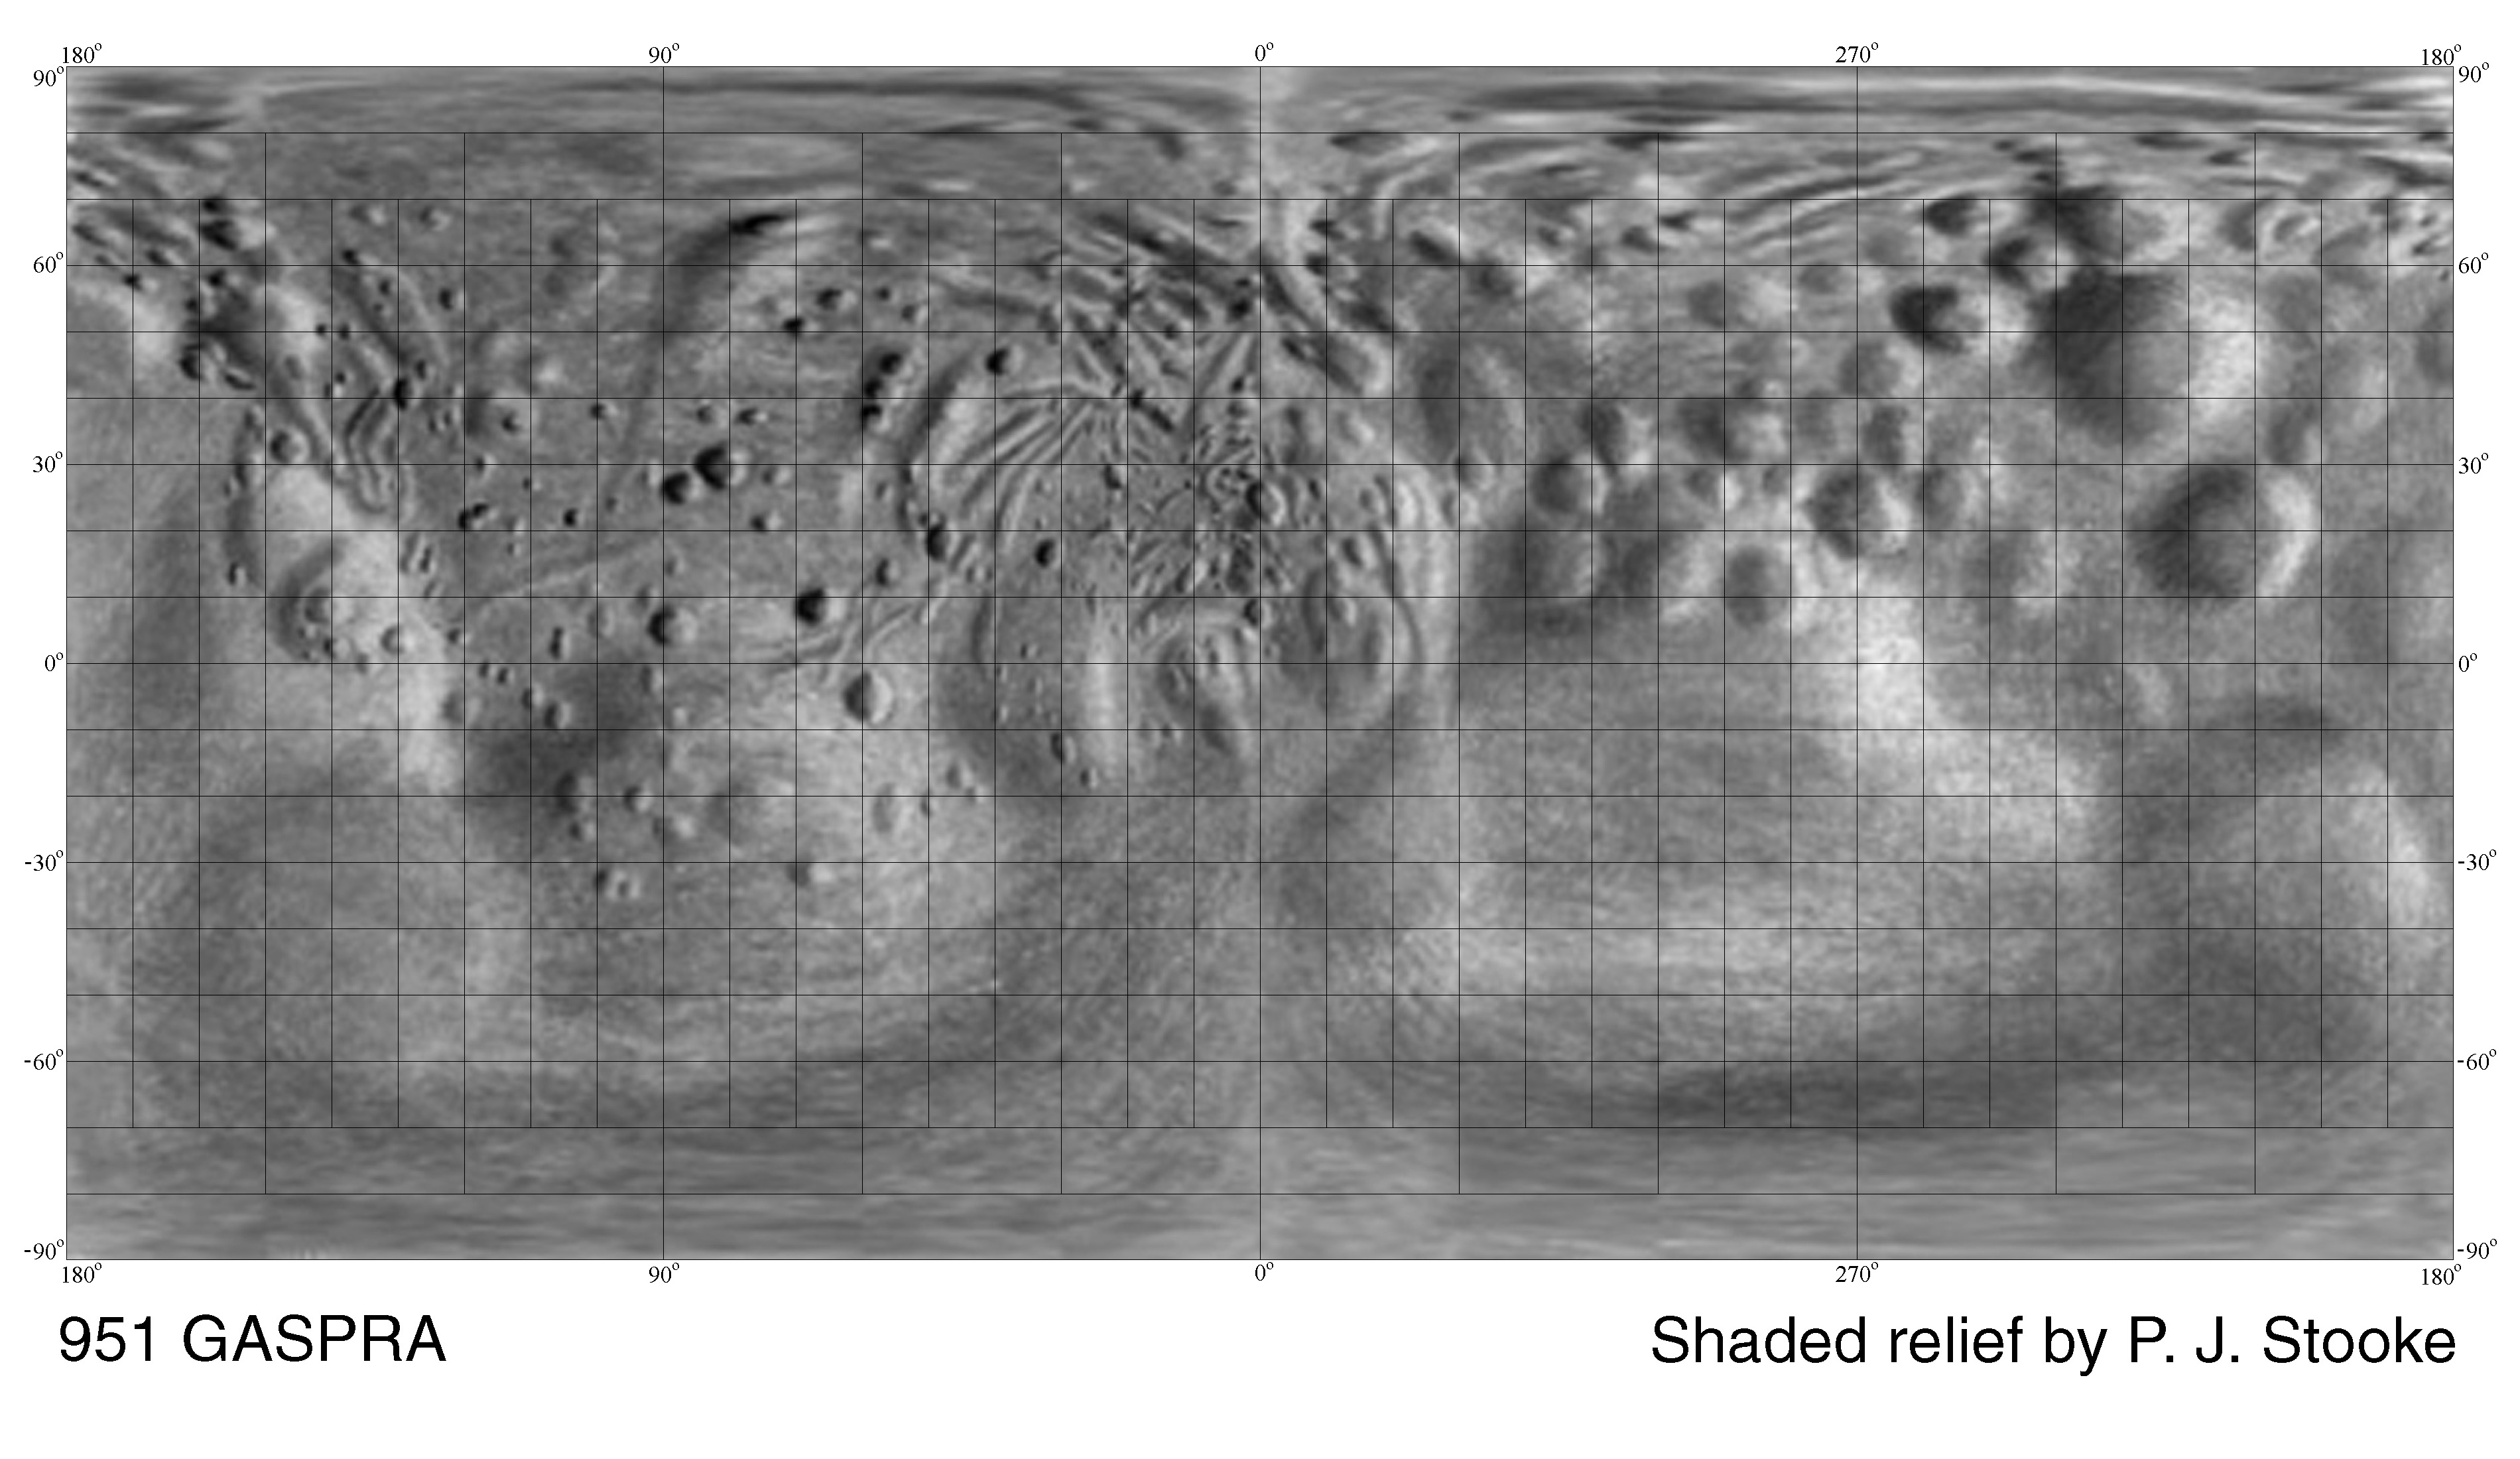
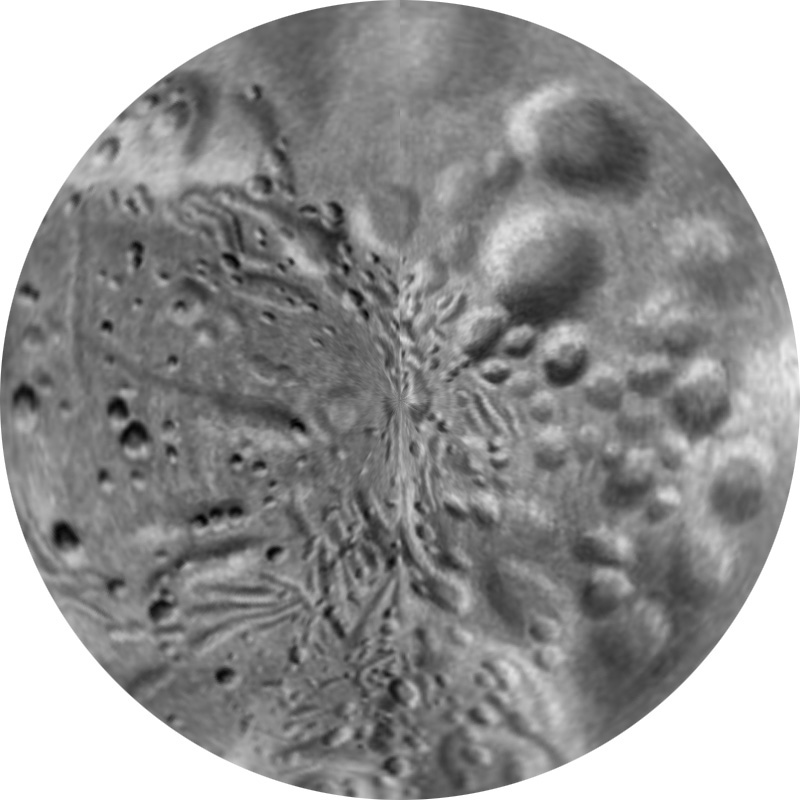
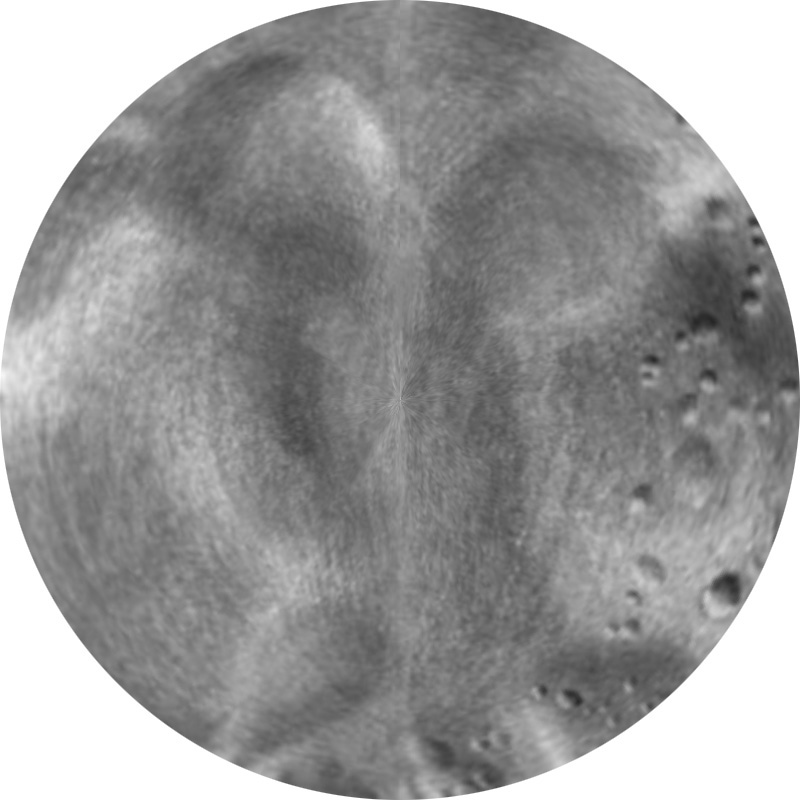
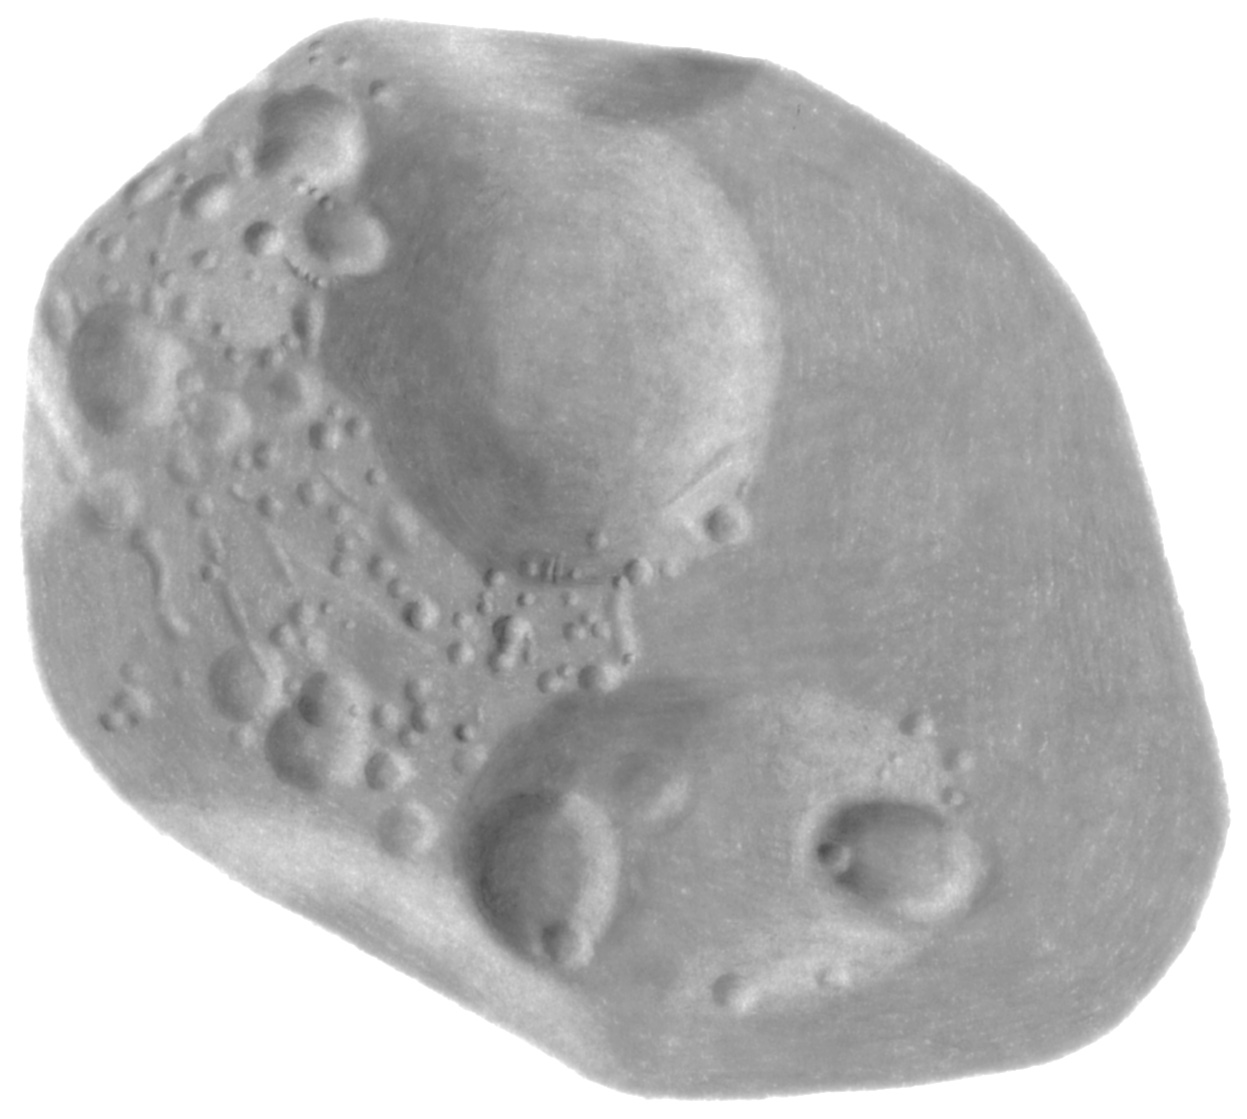
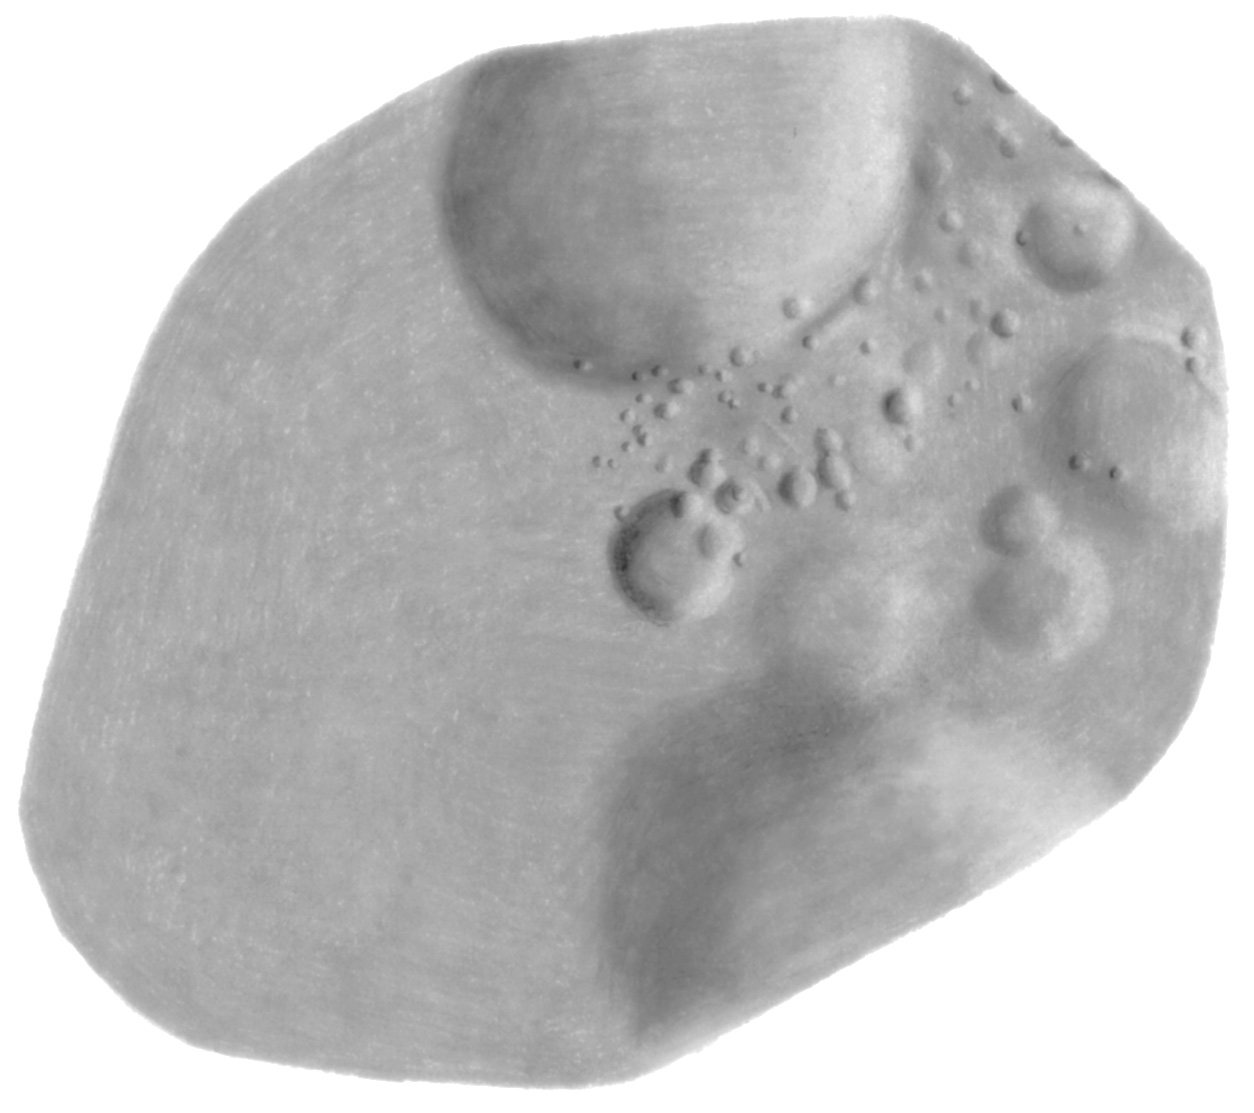
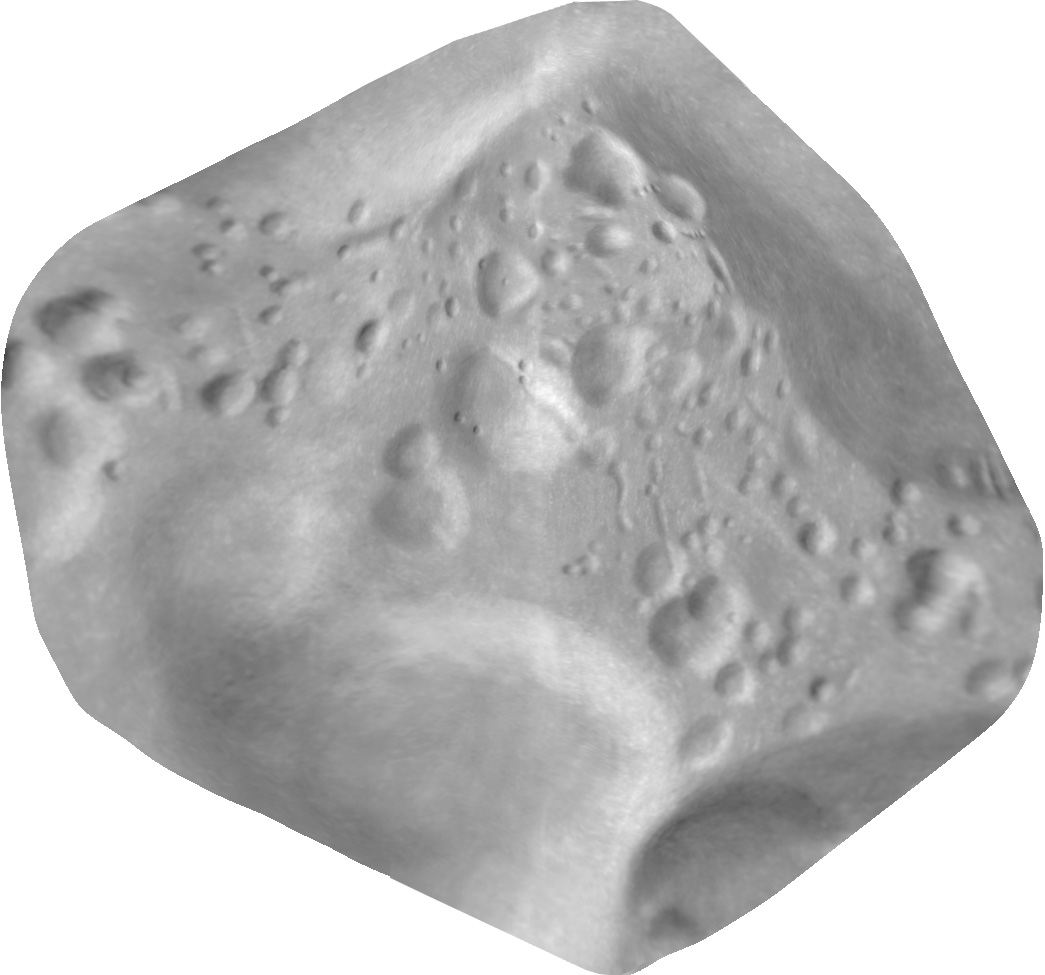
Asteroid 951 Gaspra
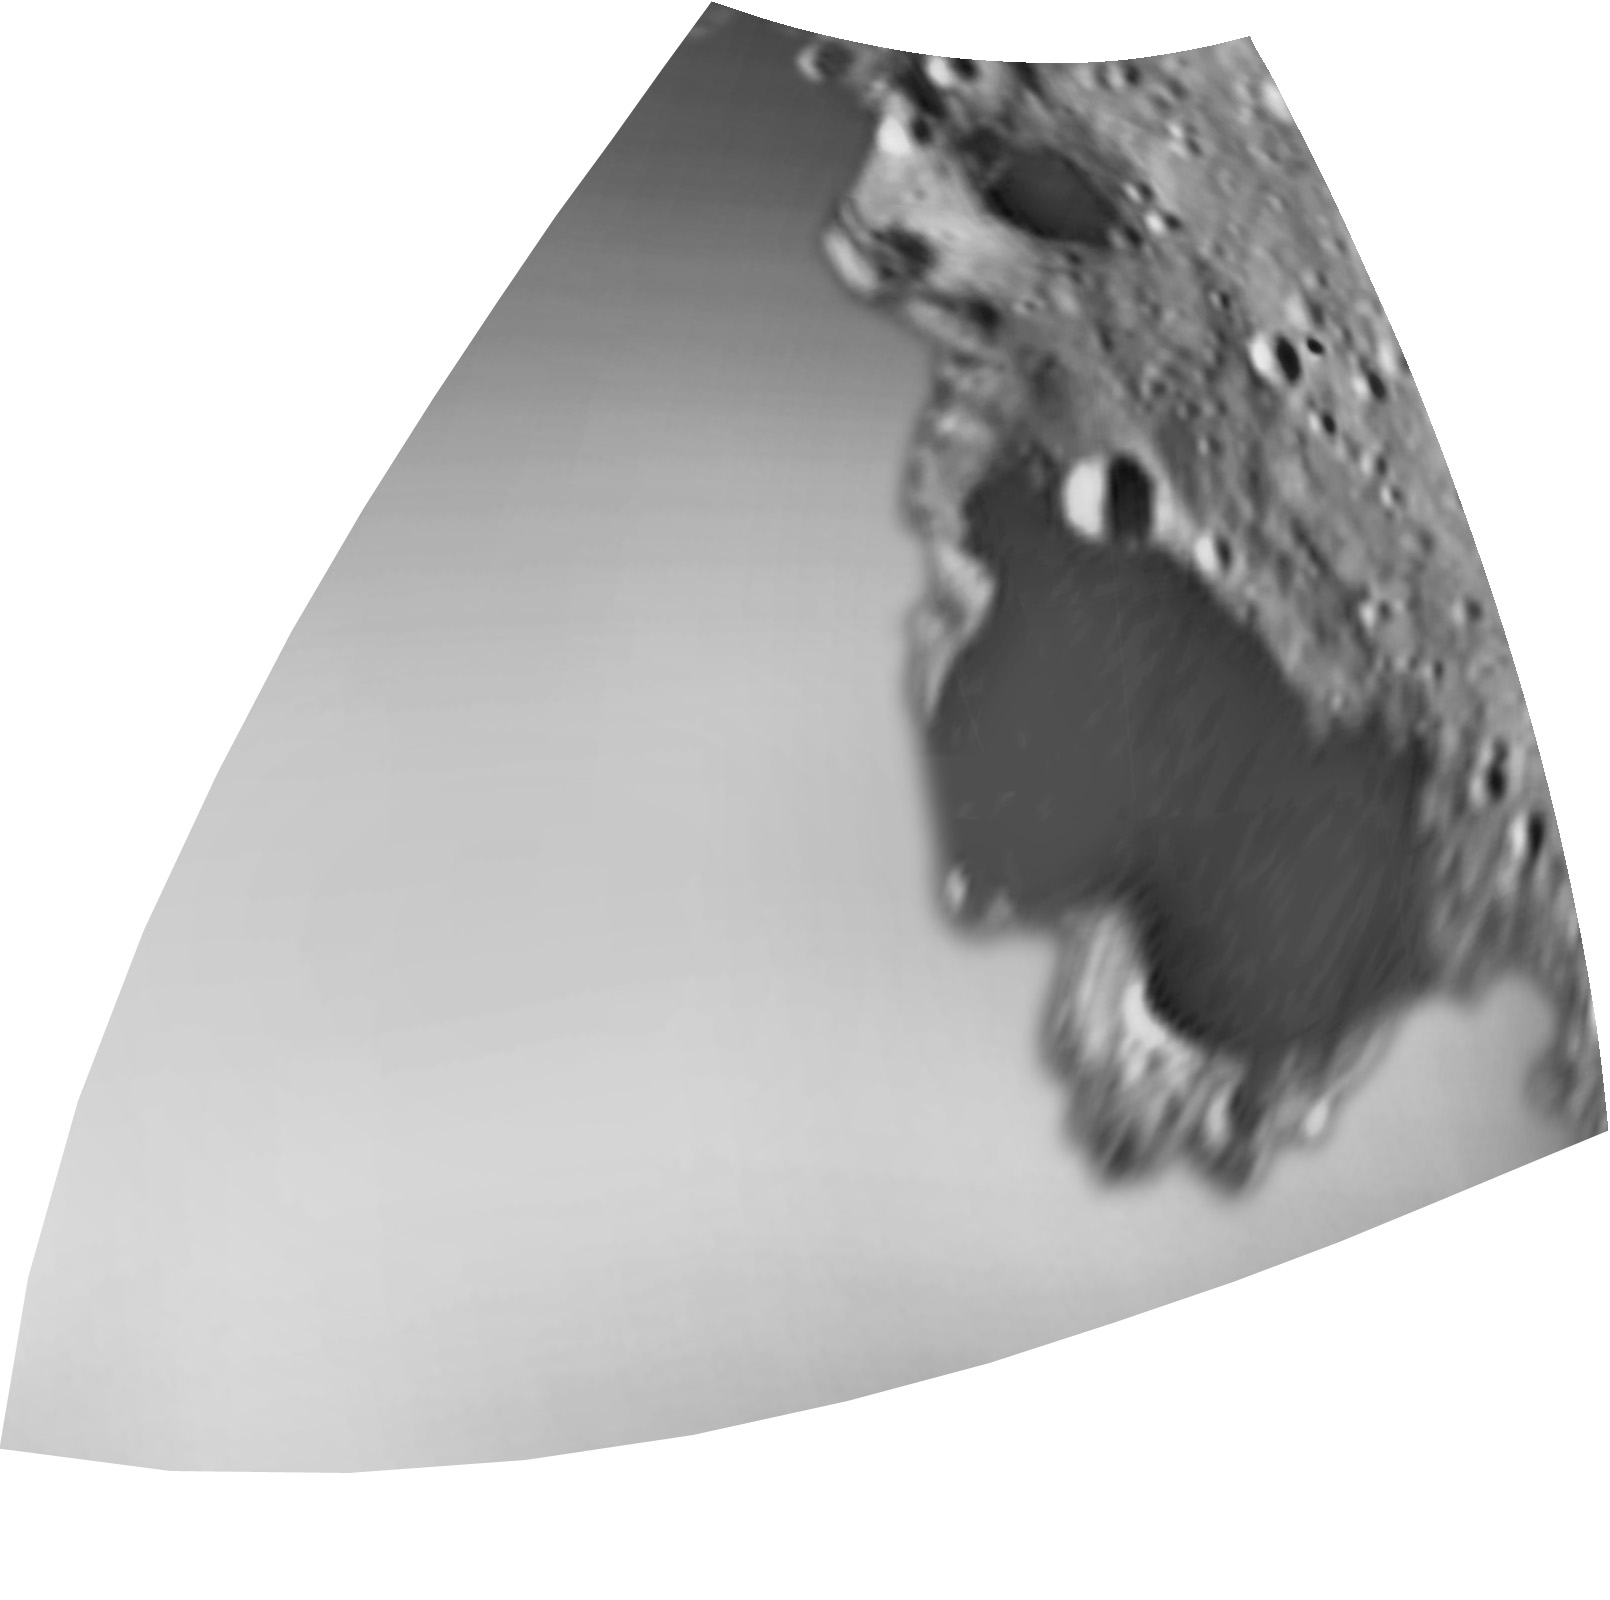
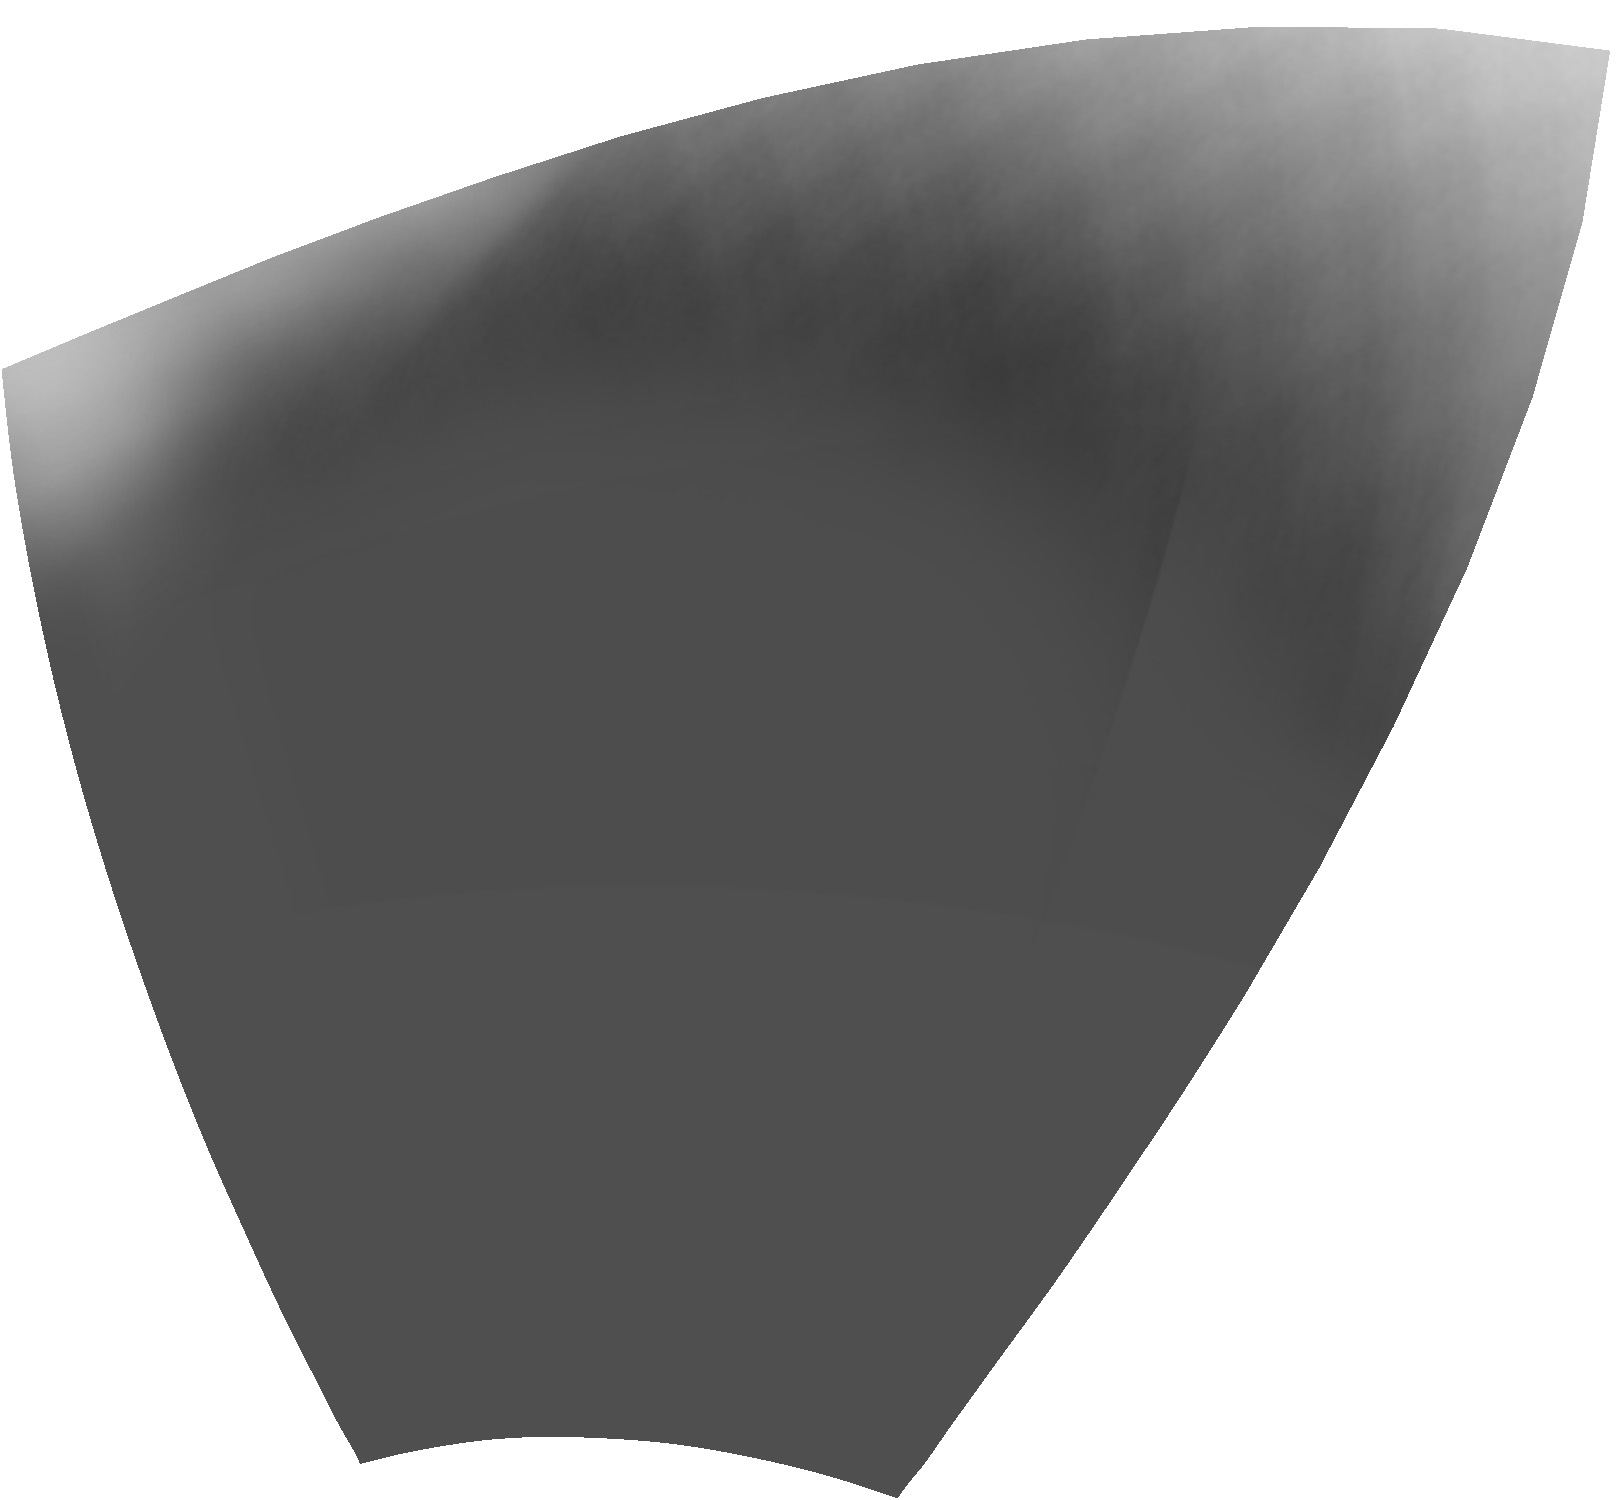
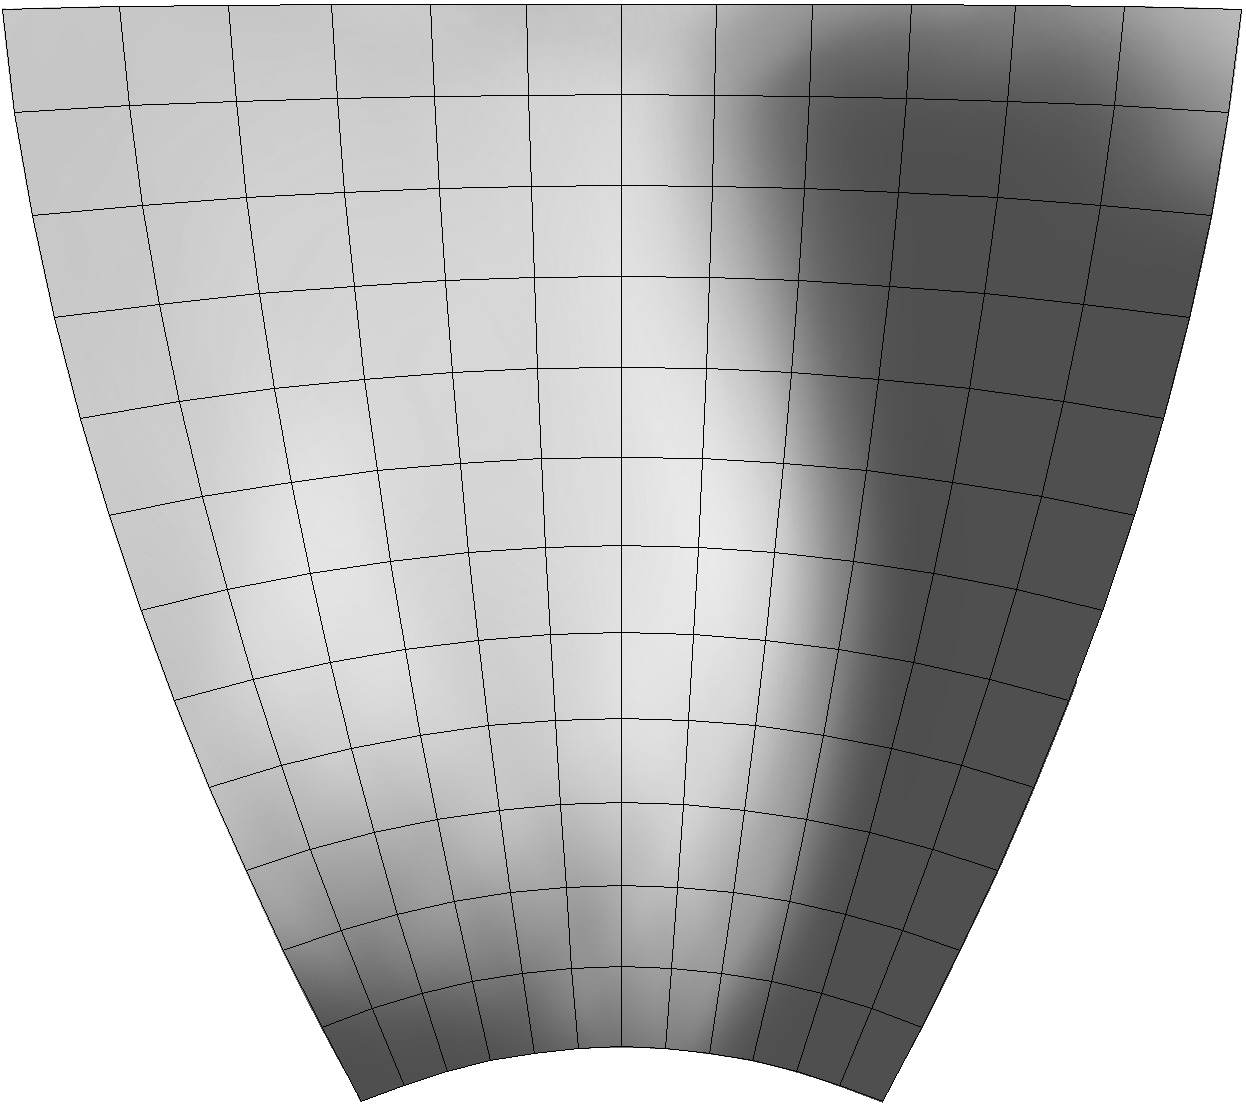
A. Azimuthal (Morphographic) Equidistant Projection photomosaics.
These cover all of Gaspra in 14 sheets, each 60 degrees by 60 degrees, sheet
limits shown on labelled and gridded versions, digital scale 5m/pixel.
An additional sheet (sheet 15) covers the whole area imaged at high
resolution at 10 m/pixel. Original photomosaic created by P. Stooke,
University of Western Ontario, based on positional control by P. Thomas.
Labelled and gridded versions have 5 degree grid spacing. Note: Only
sheets with some high resolution coverage are fully labeled.
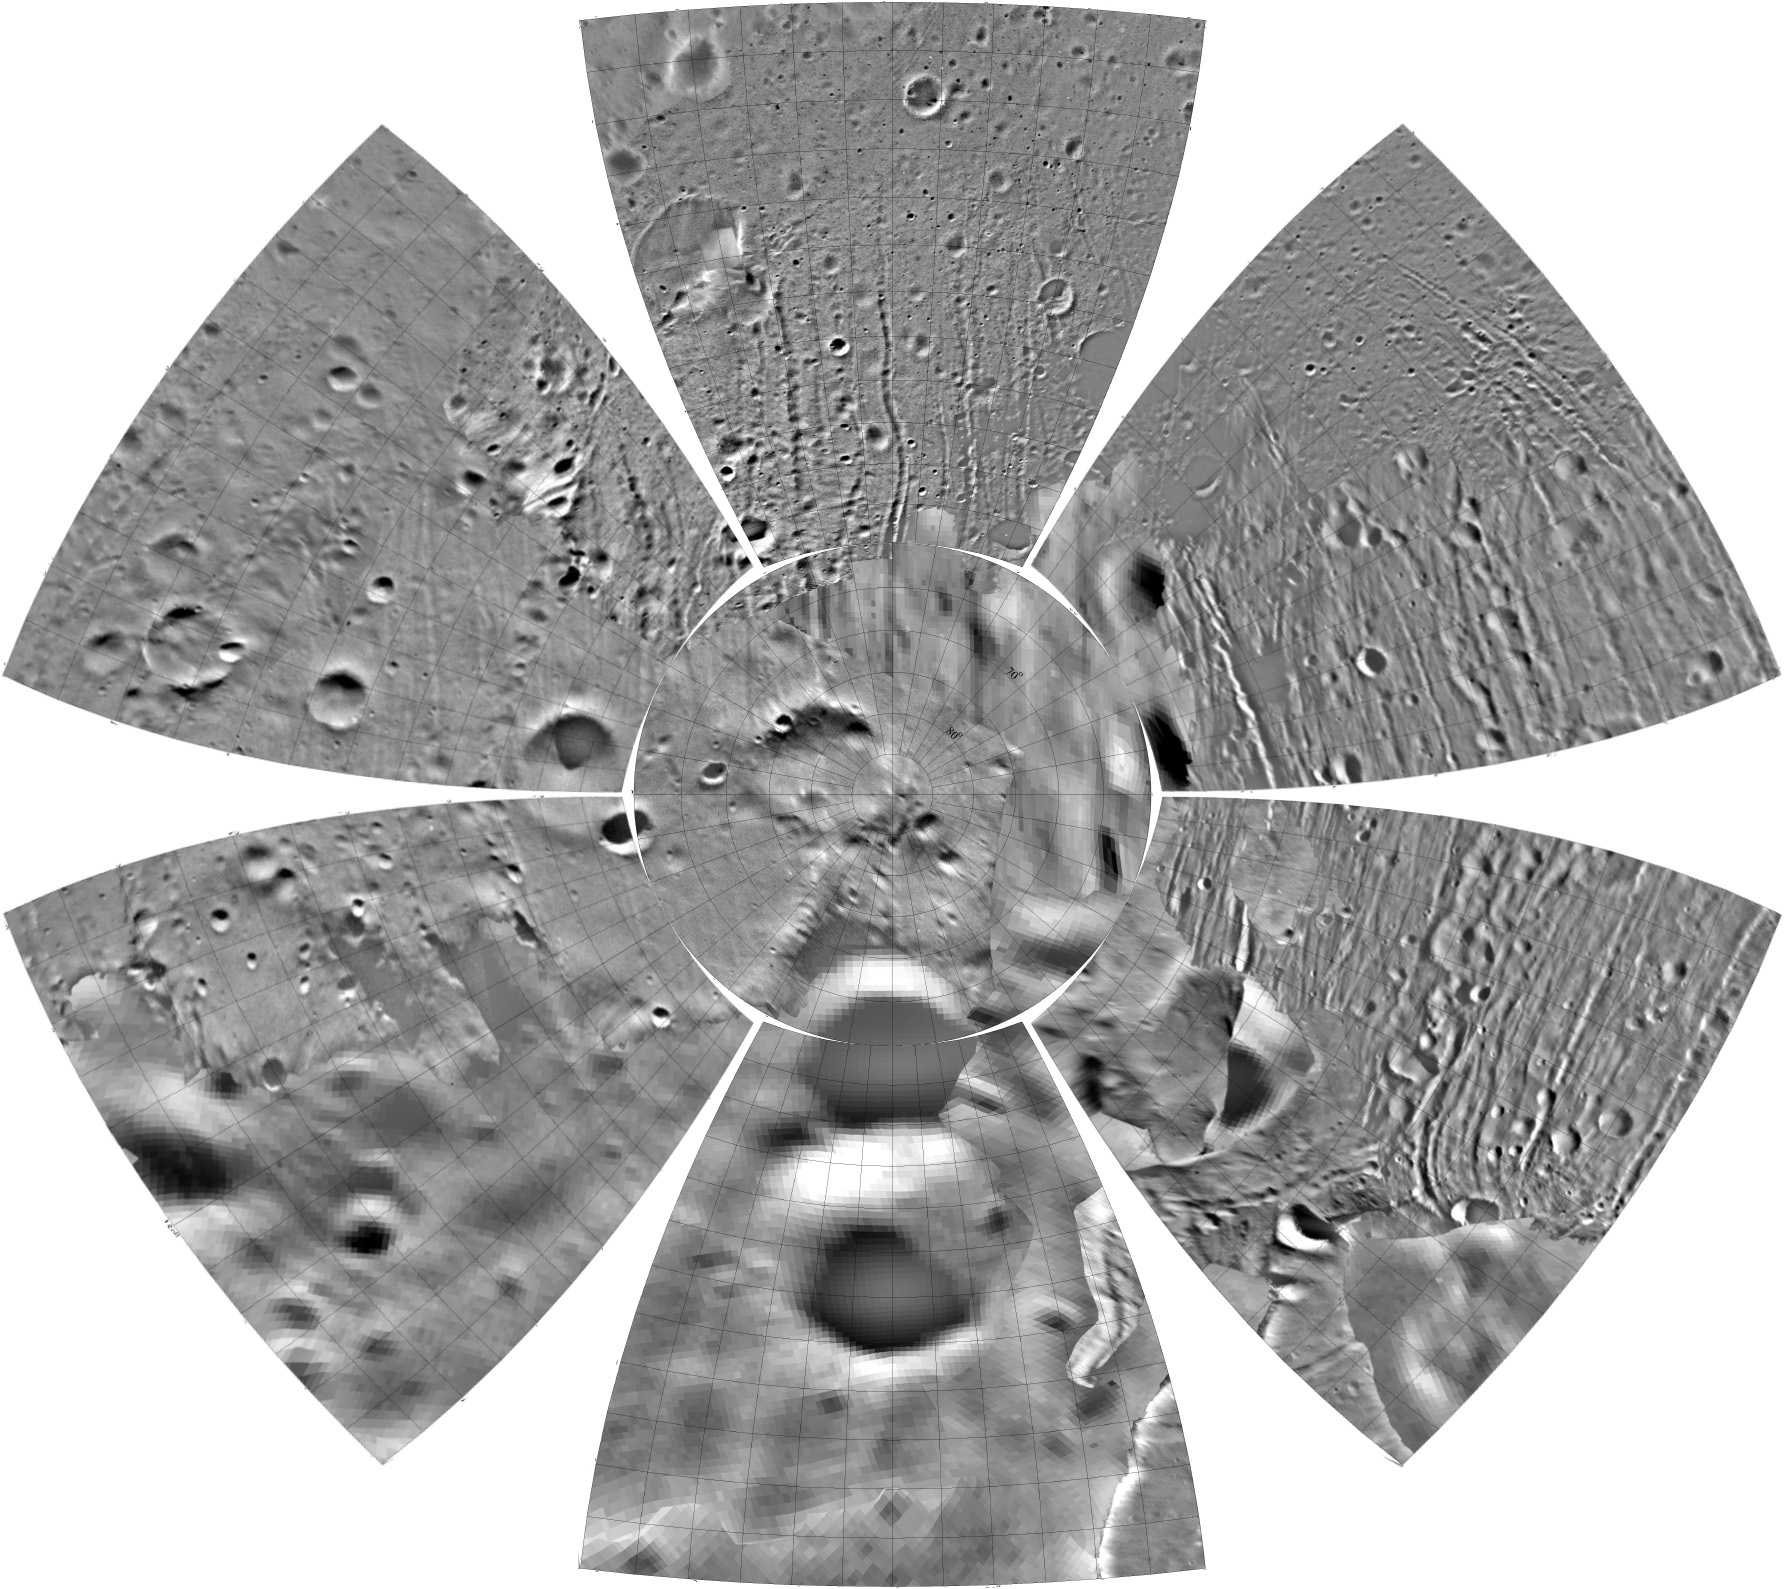
B. Globe gores: Composites of the gridded sheets above arranged around
the polar sheets in separate northern and southern hemispheres. These
may be cut out and assembled to make a globe.
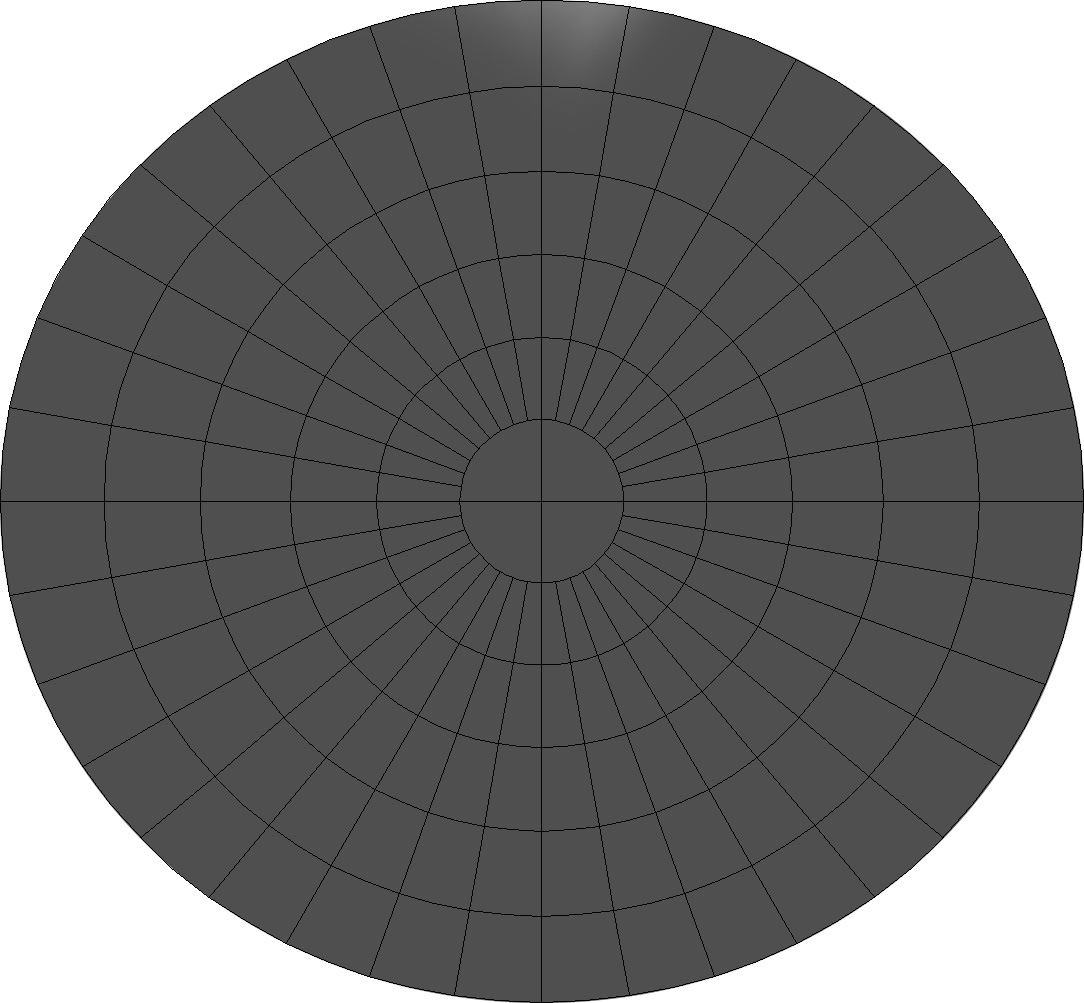
C. Global photomosaics, various projections. The photomosaic data used to
create the detailed maps above is also presented in full global form in the
following variations:
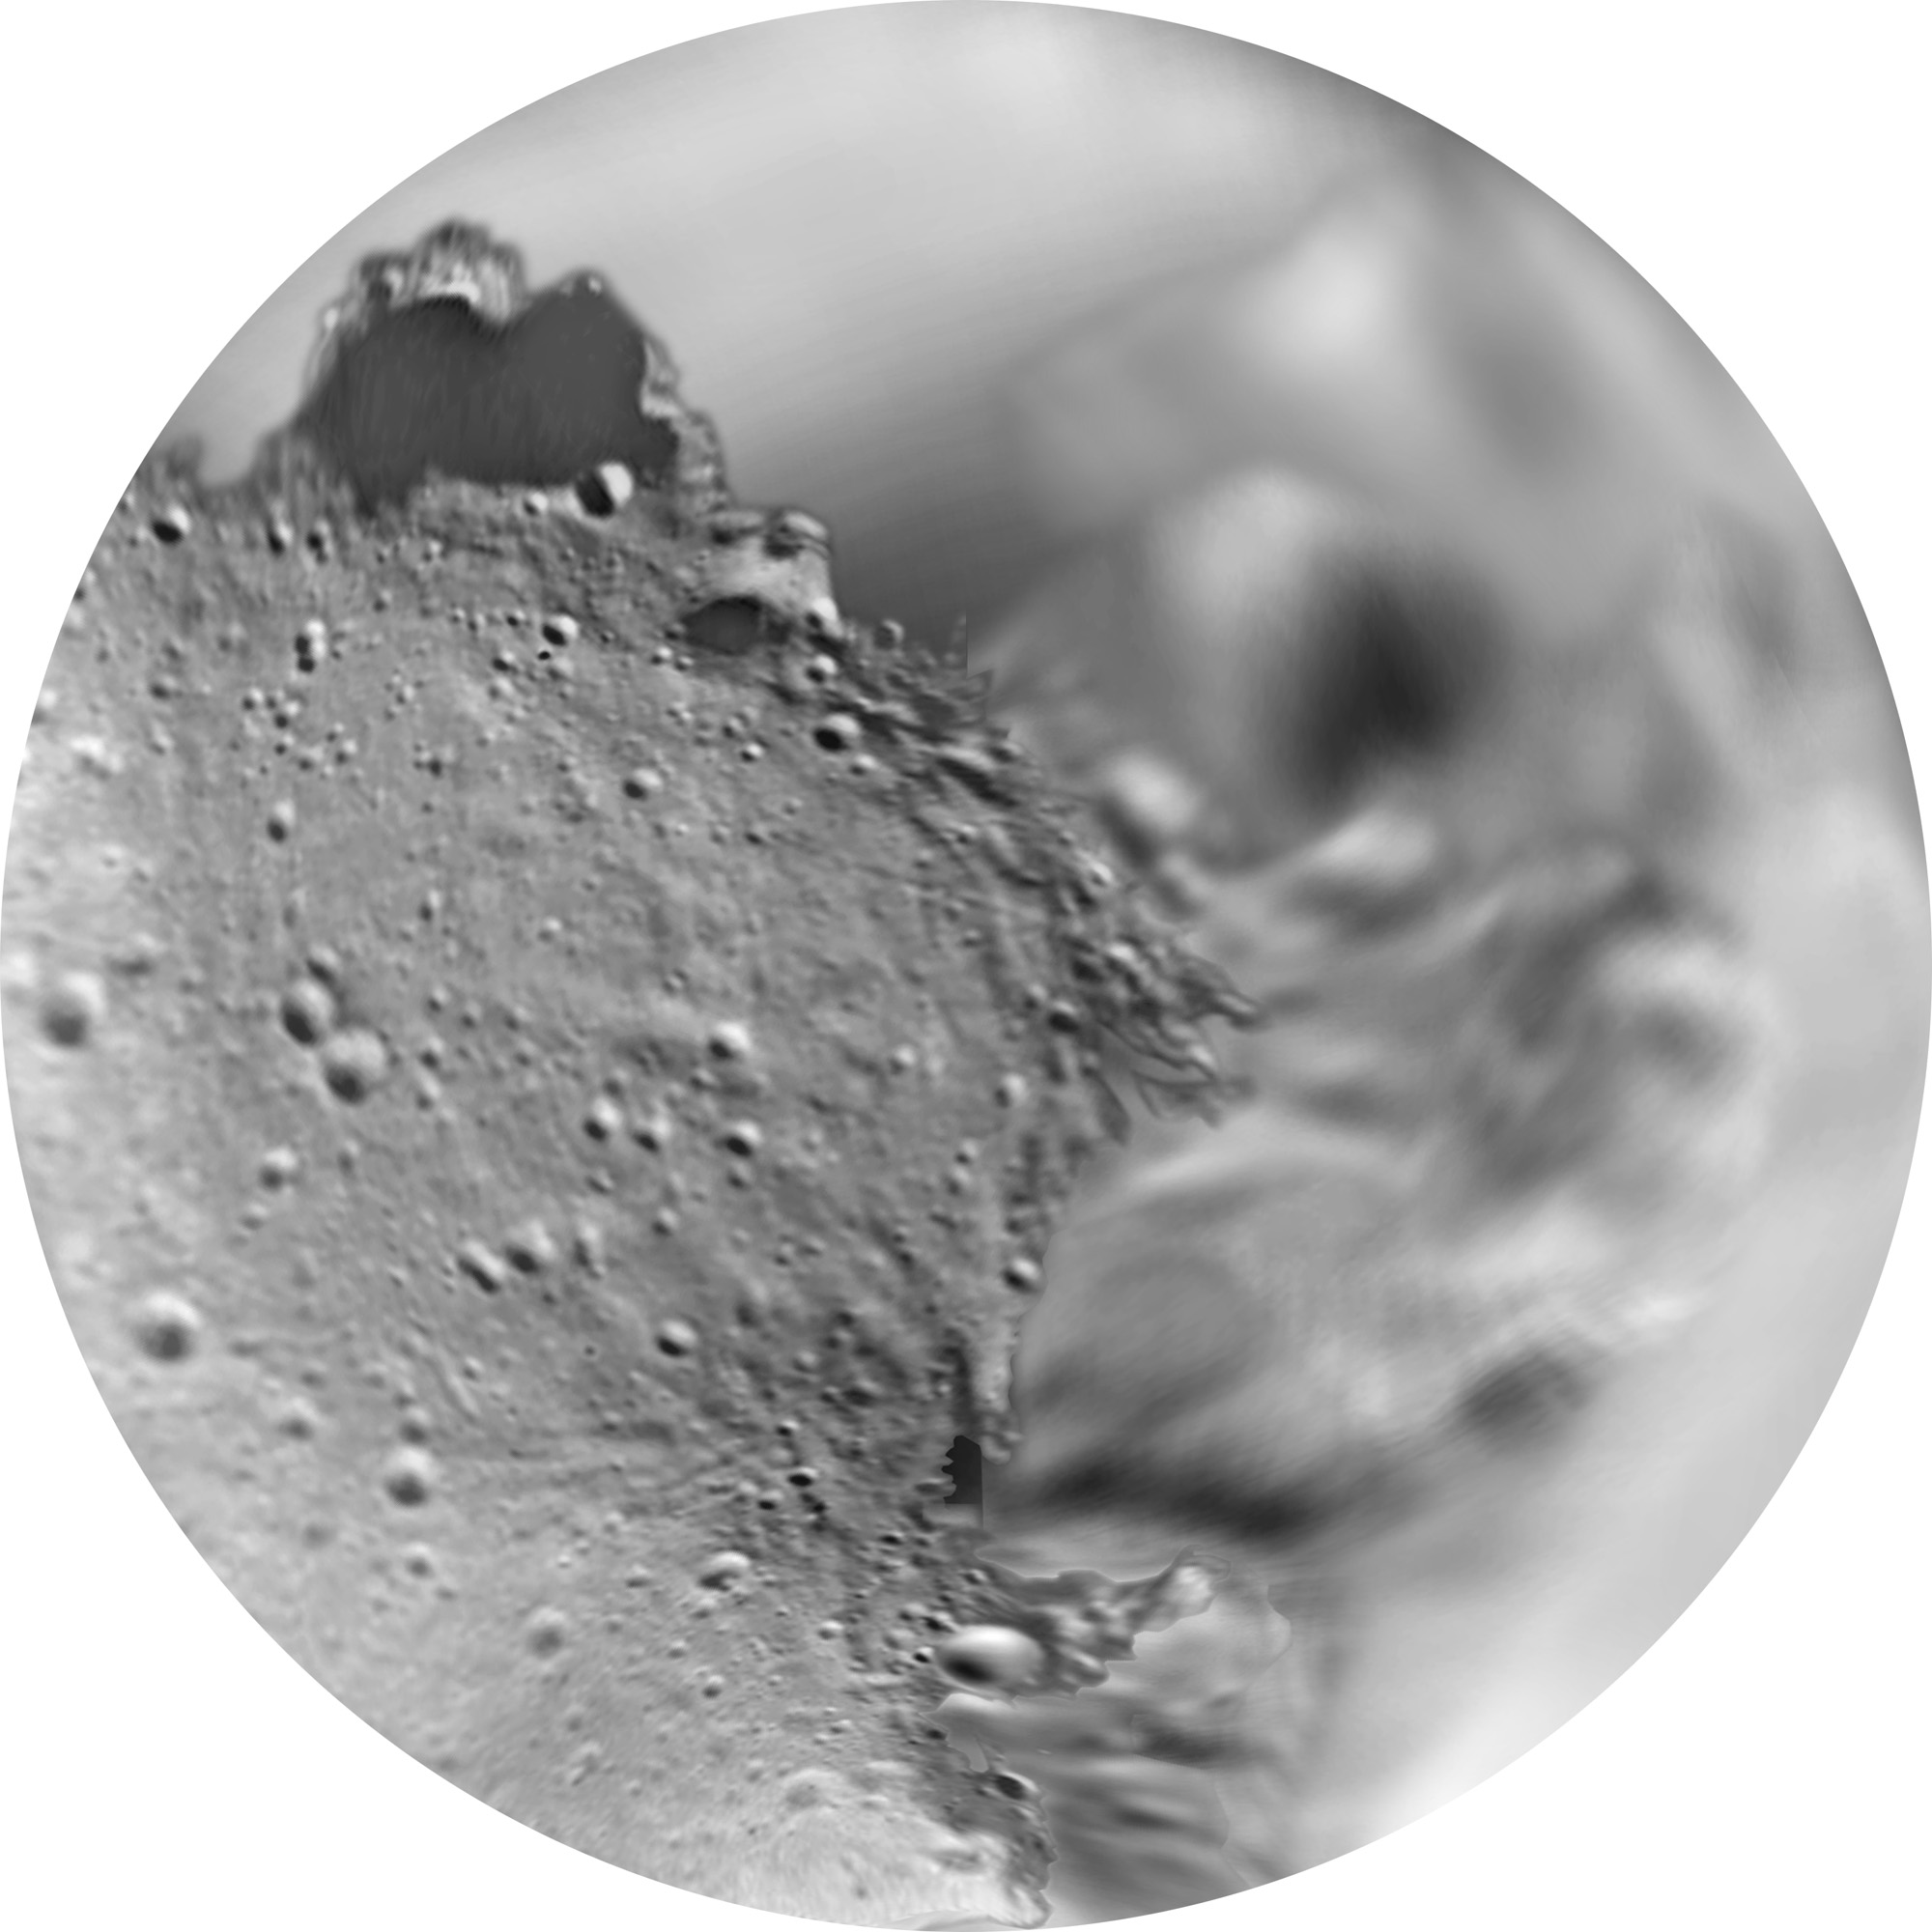
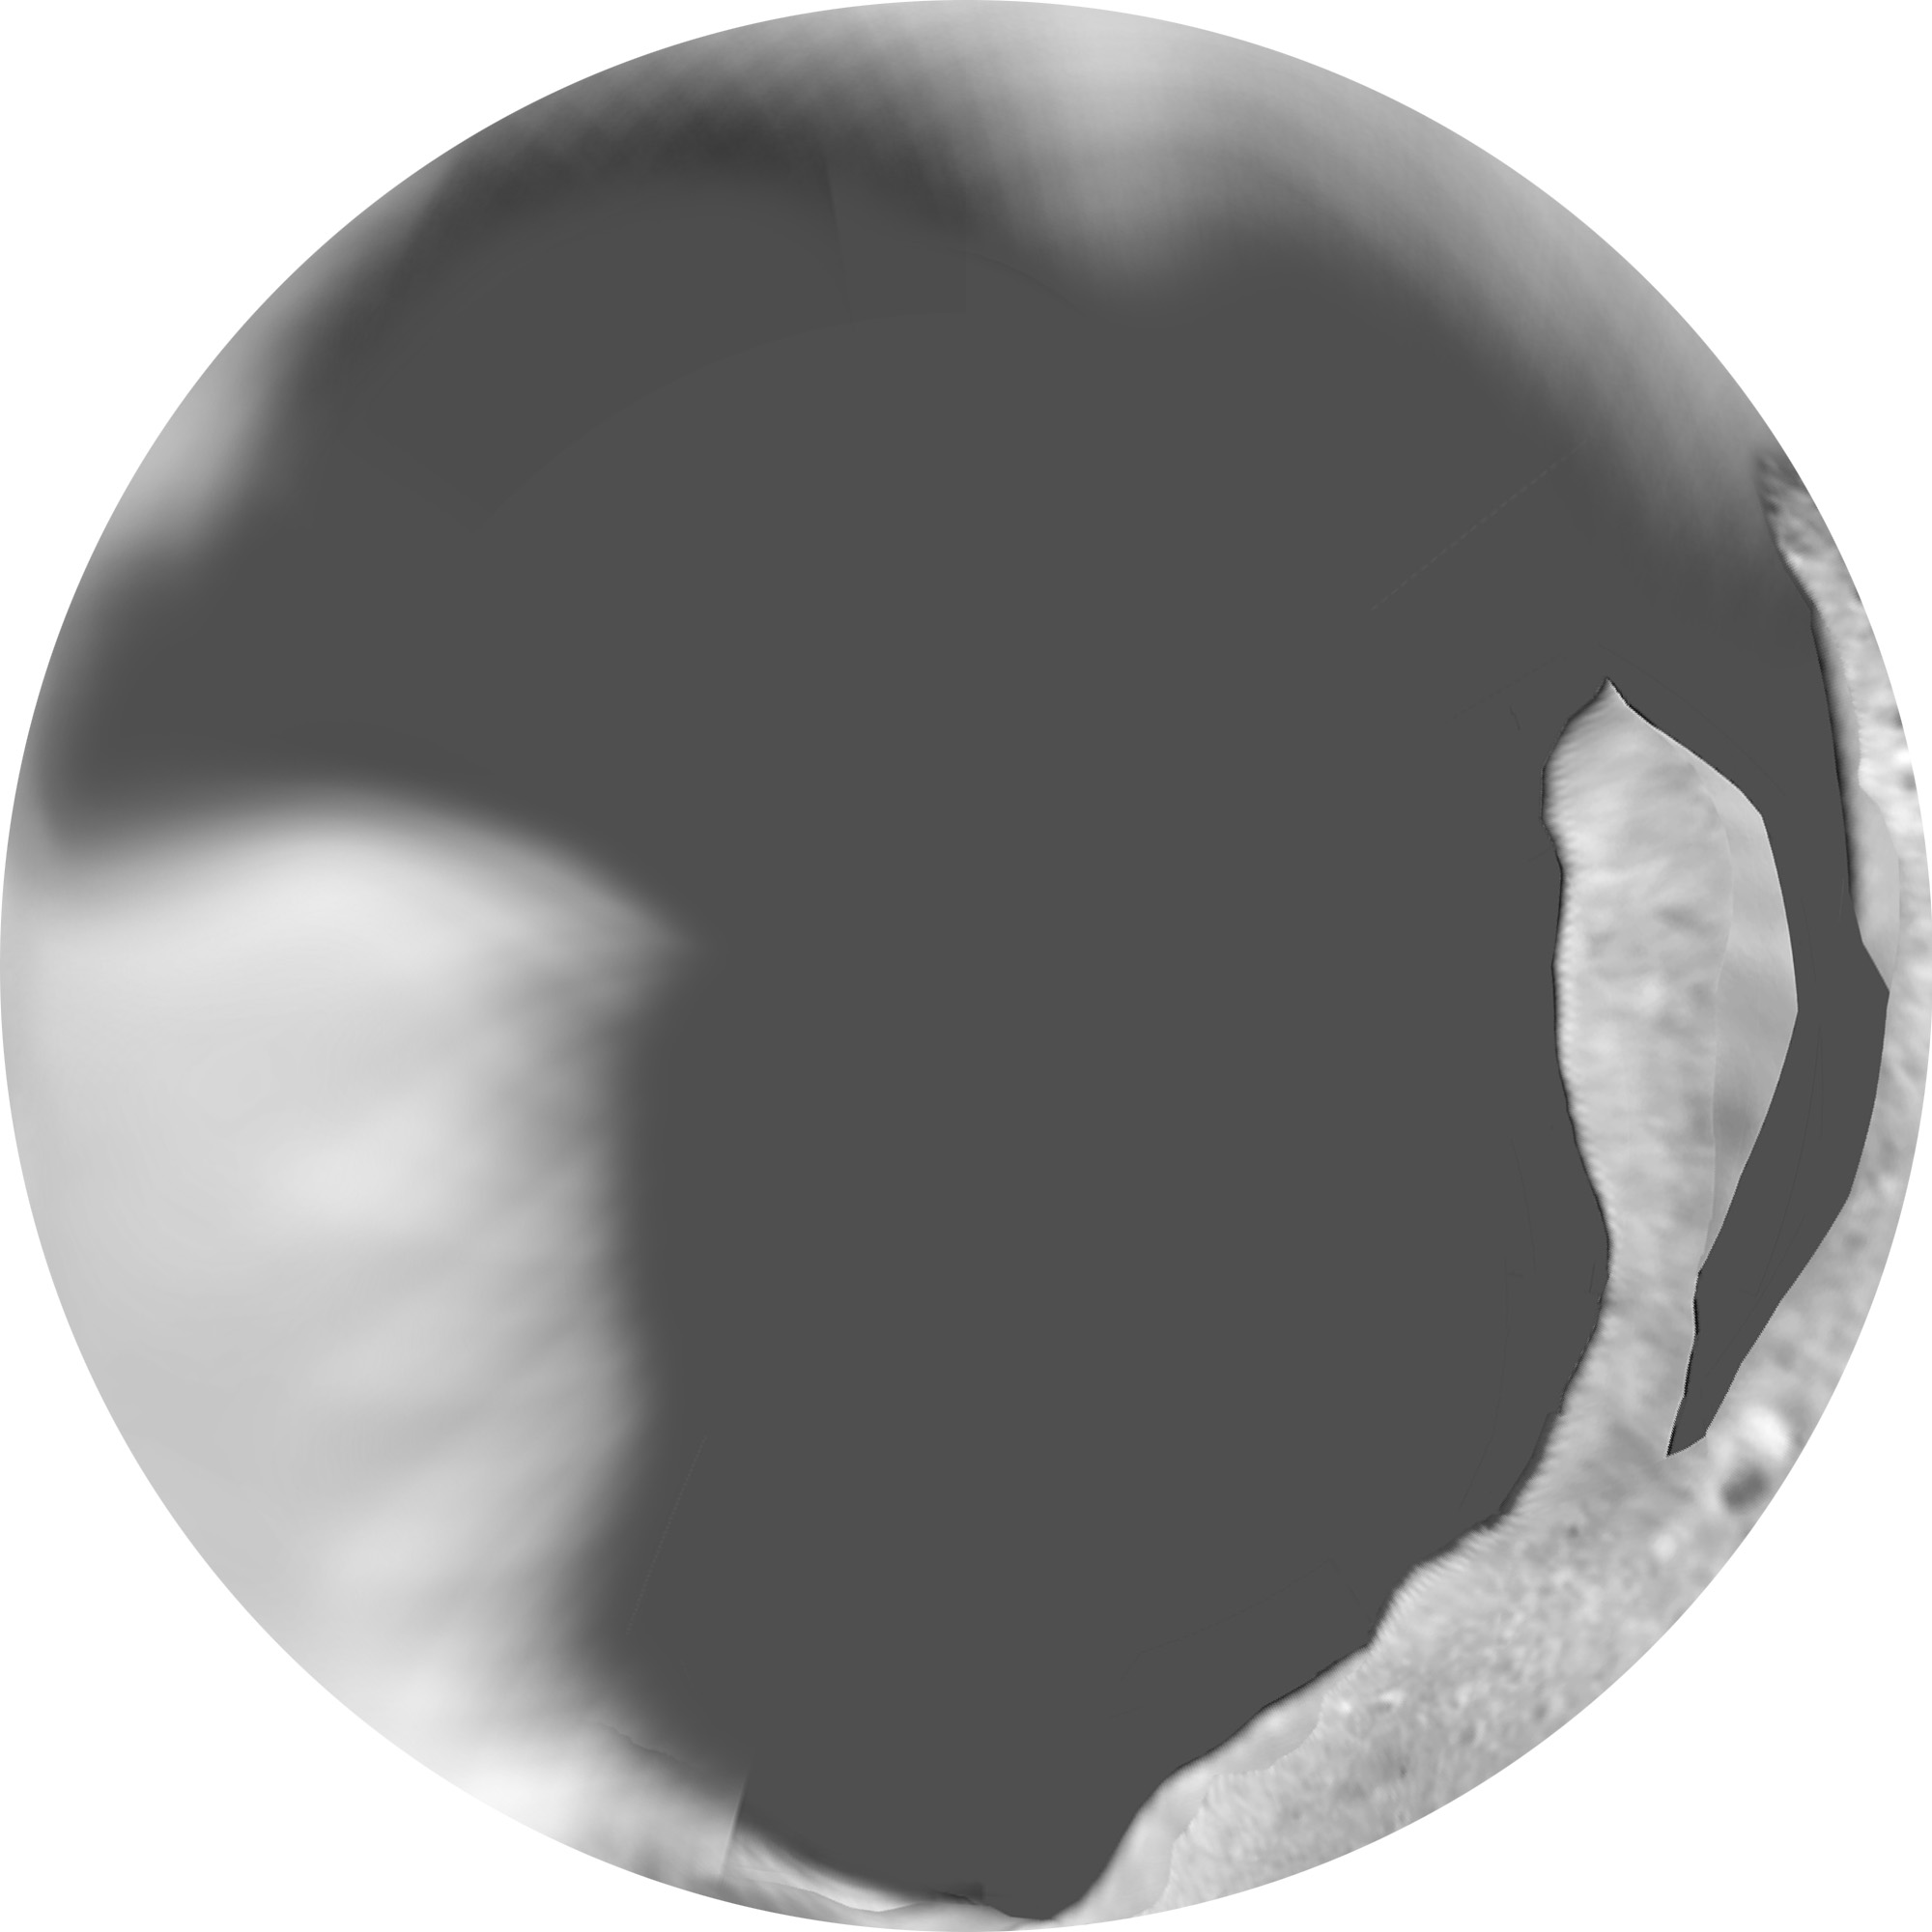
Morphographic Conformal Projections. As above, but the mosaic is projected
onto the best-fit triaxial ellipsoid to suggest the approximate shape.
Only the northern hemisphere was mapped this way because of the nature of
the image coverage. Six versions are offered: equal area, equidistant,
and conformal (effectively = stereographic) projections of the triaxial
ellipsoid, with and without grids. The grids are not labeled.
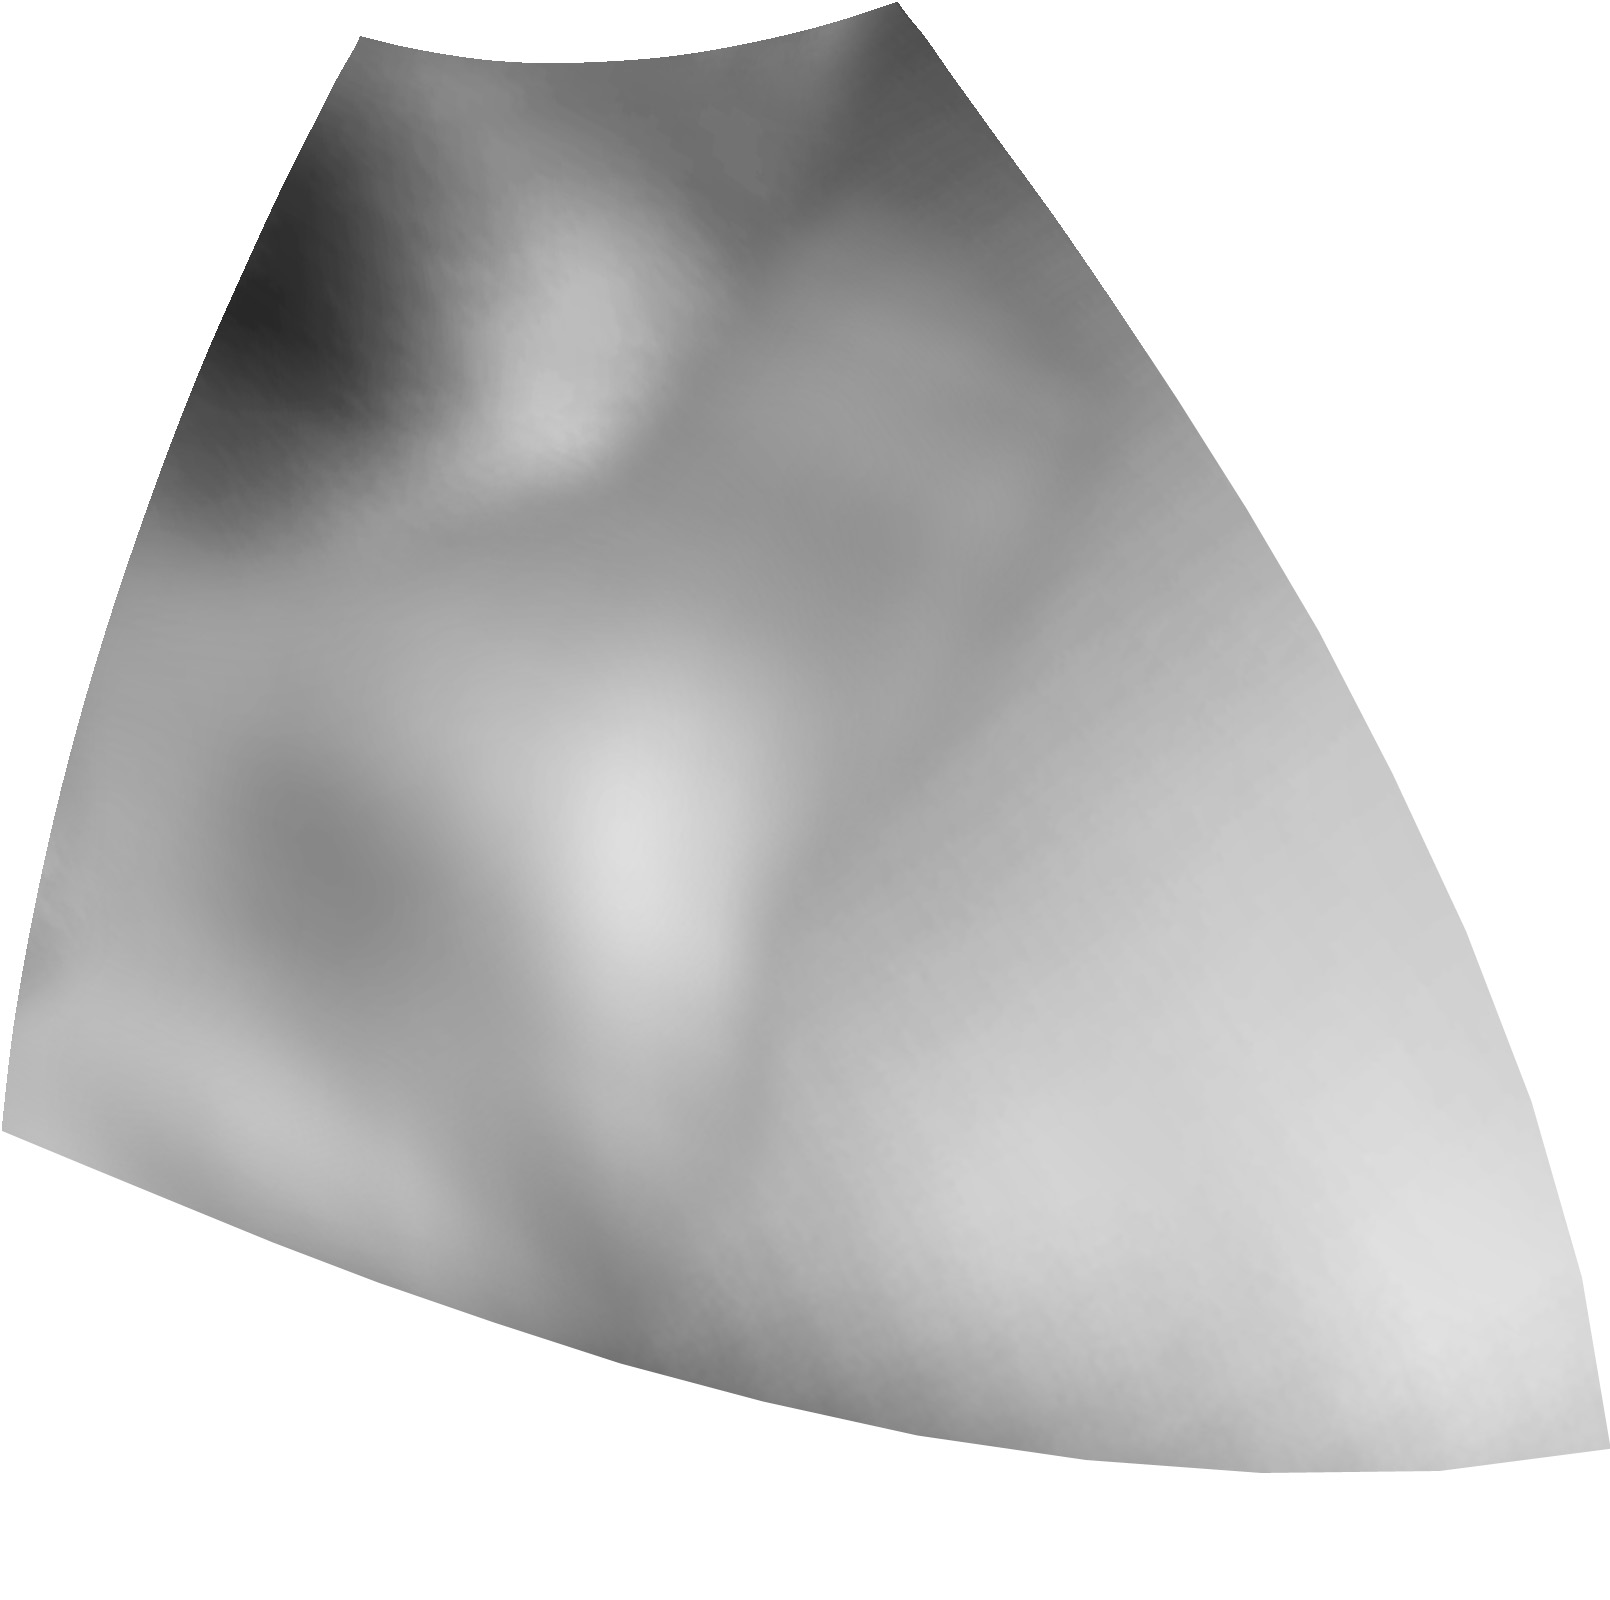
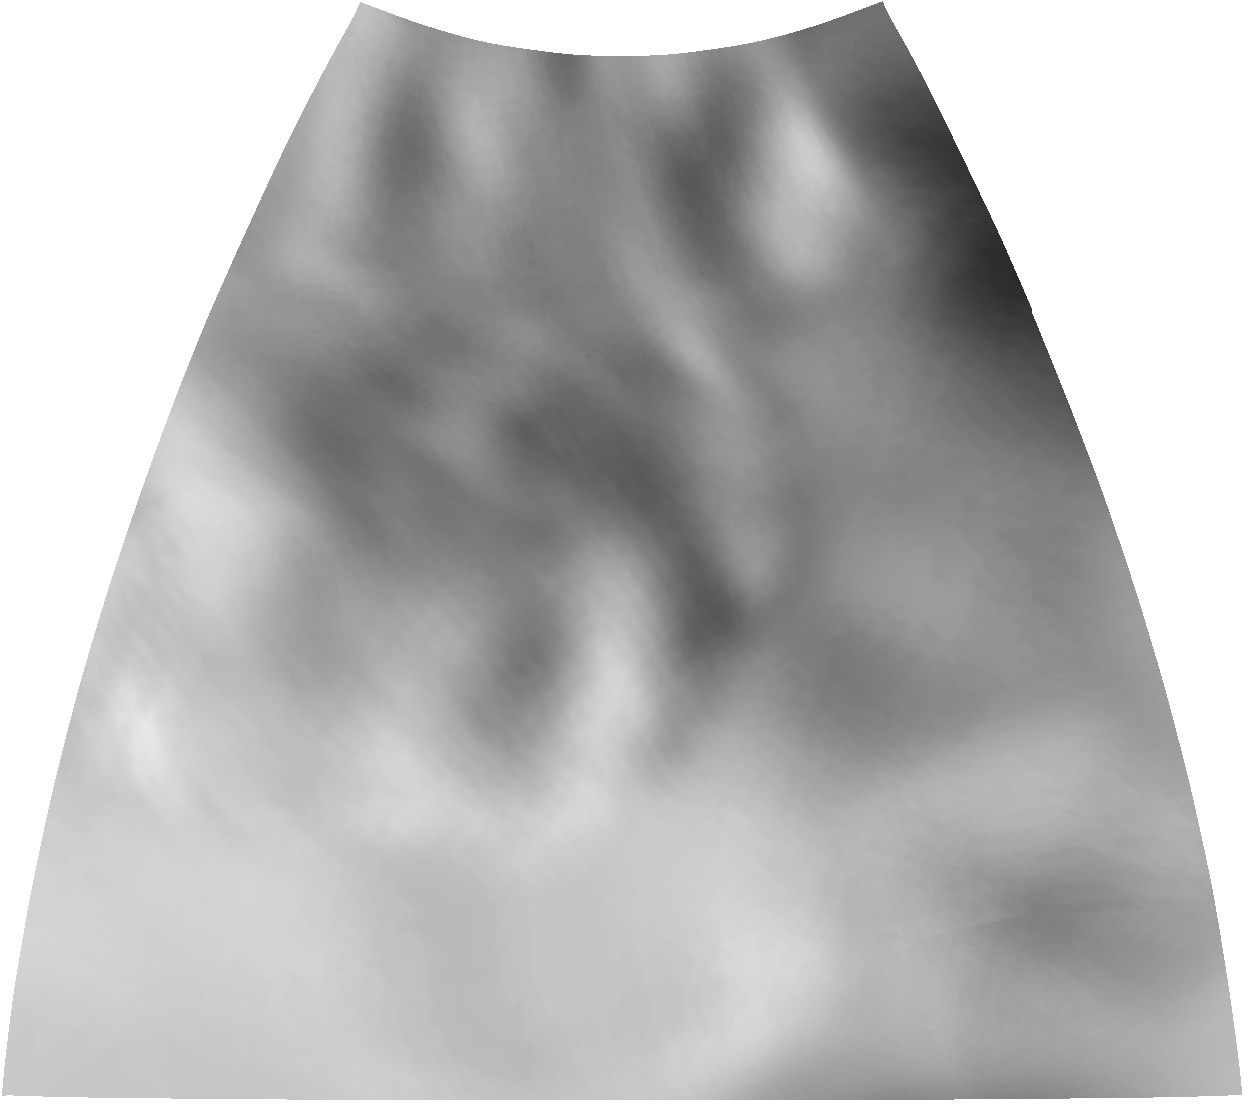
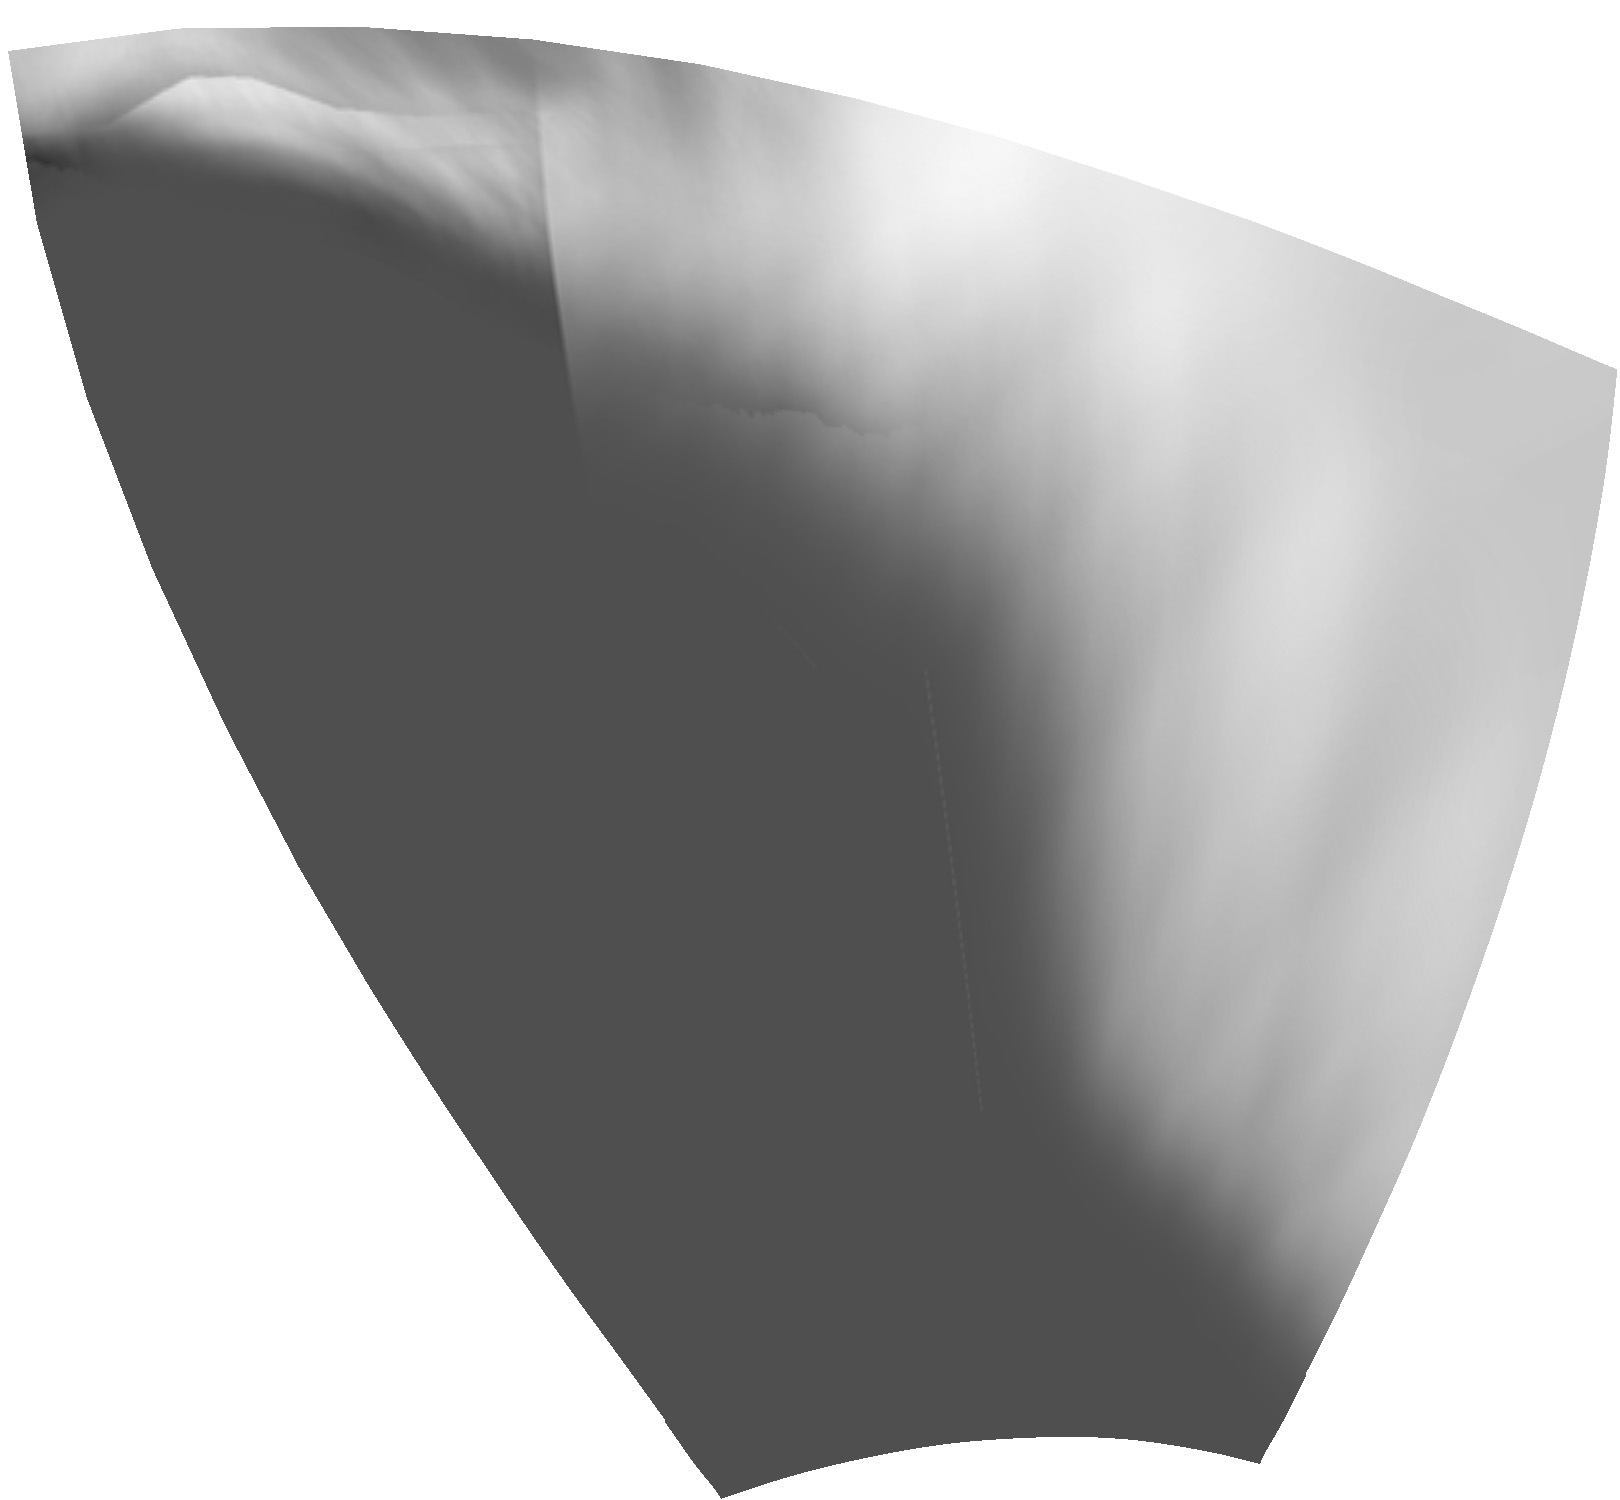
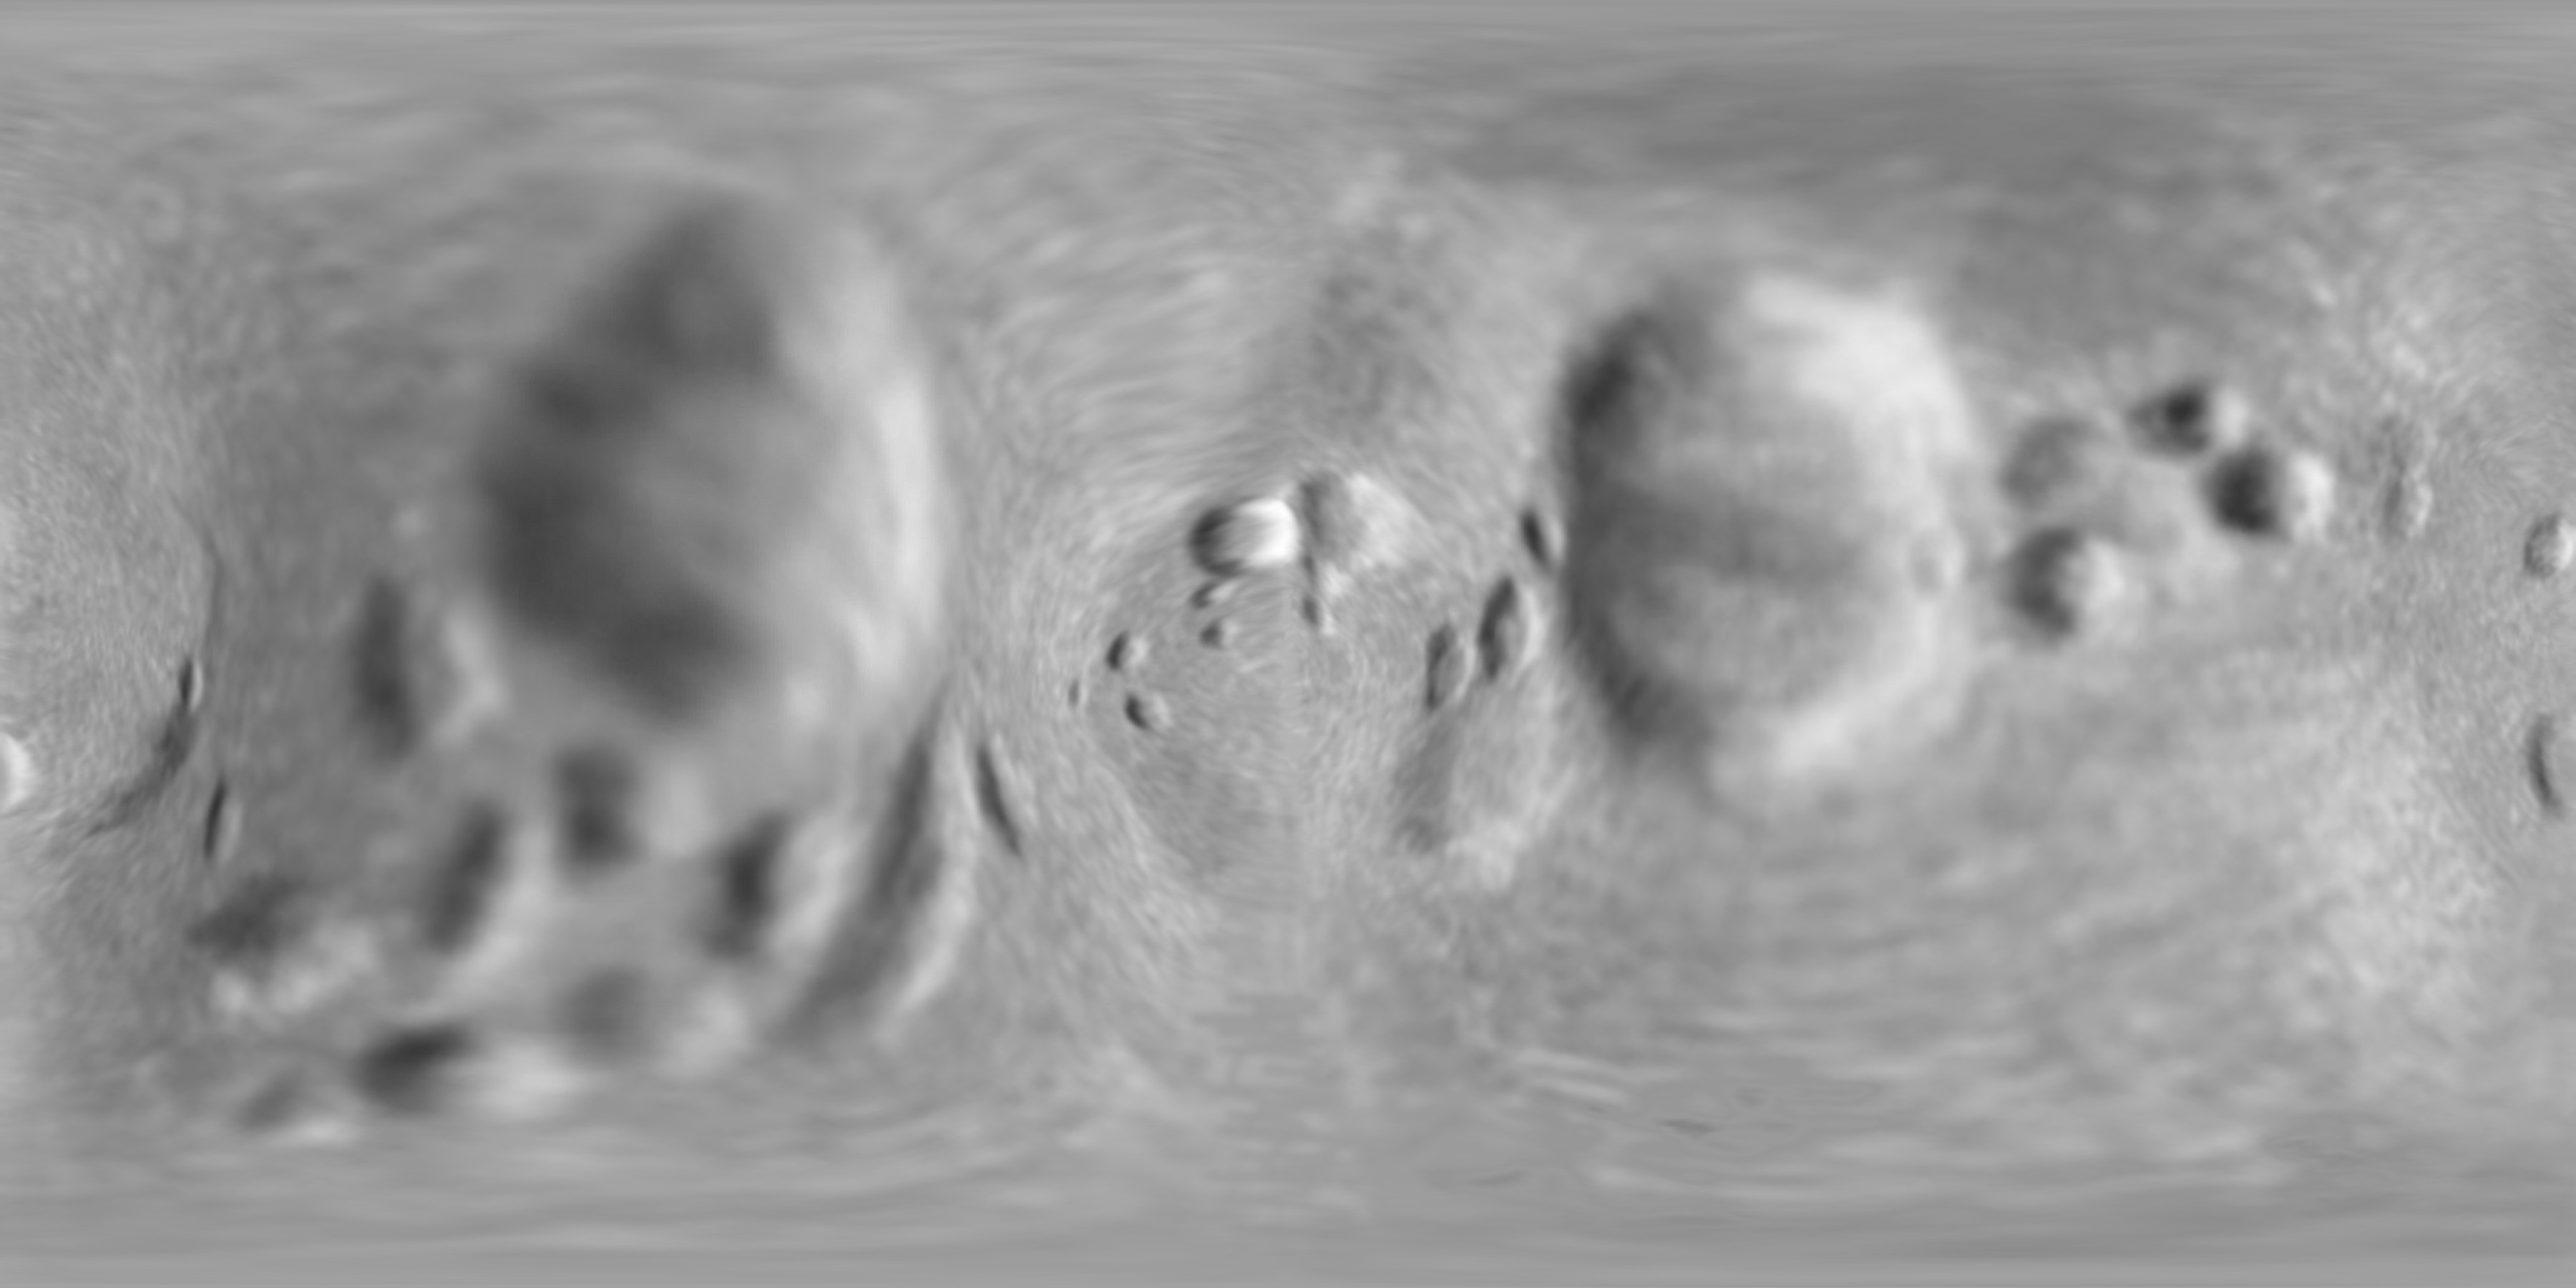
D. Shaded relief maps.
This shaded relief drawing was prepared at lower resolution than the
photomosaic and differs slightly in positional control - it is based on
earlier work and needs to be redrawn. However, it may still be useful in
the absence of any effort by USGS to prepare relief drawings of these
worlds. The map is available in several projections. The morphographic
conformal projections are shaded relief drawings projected onto the 3D
convex hull of the shape, then reprojected to Morphographic Conformal
(effectively Stereographic) projection, in two hemispheres centered
on the equator and longitudes 90 and 270.
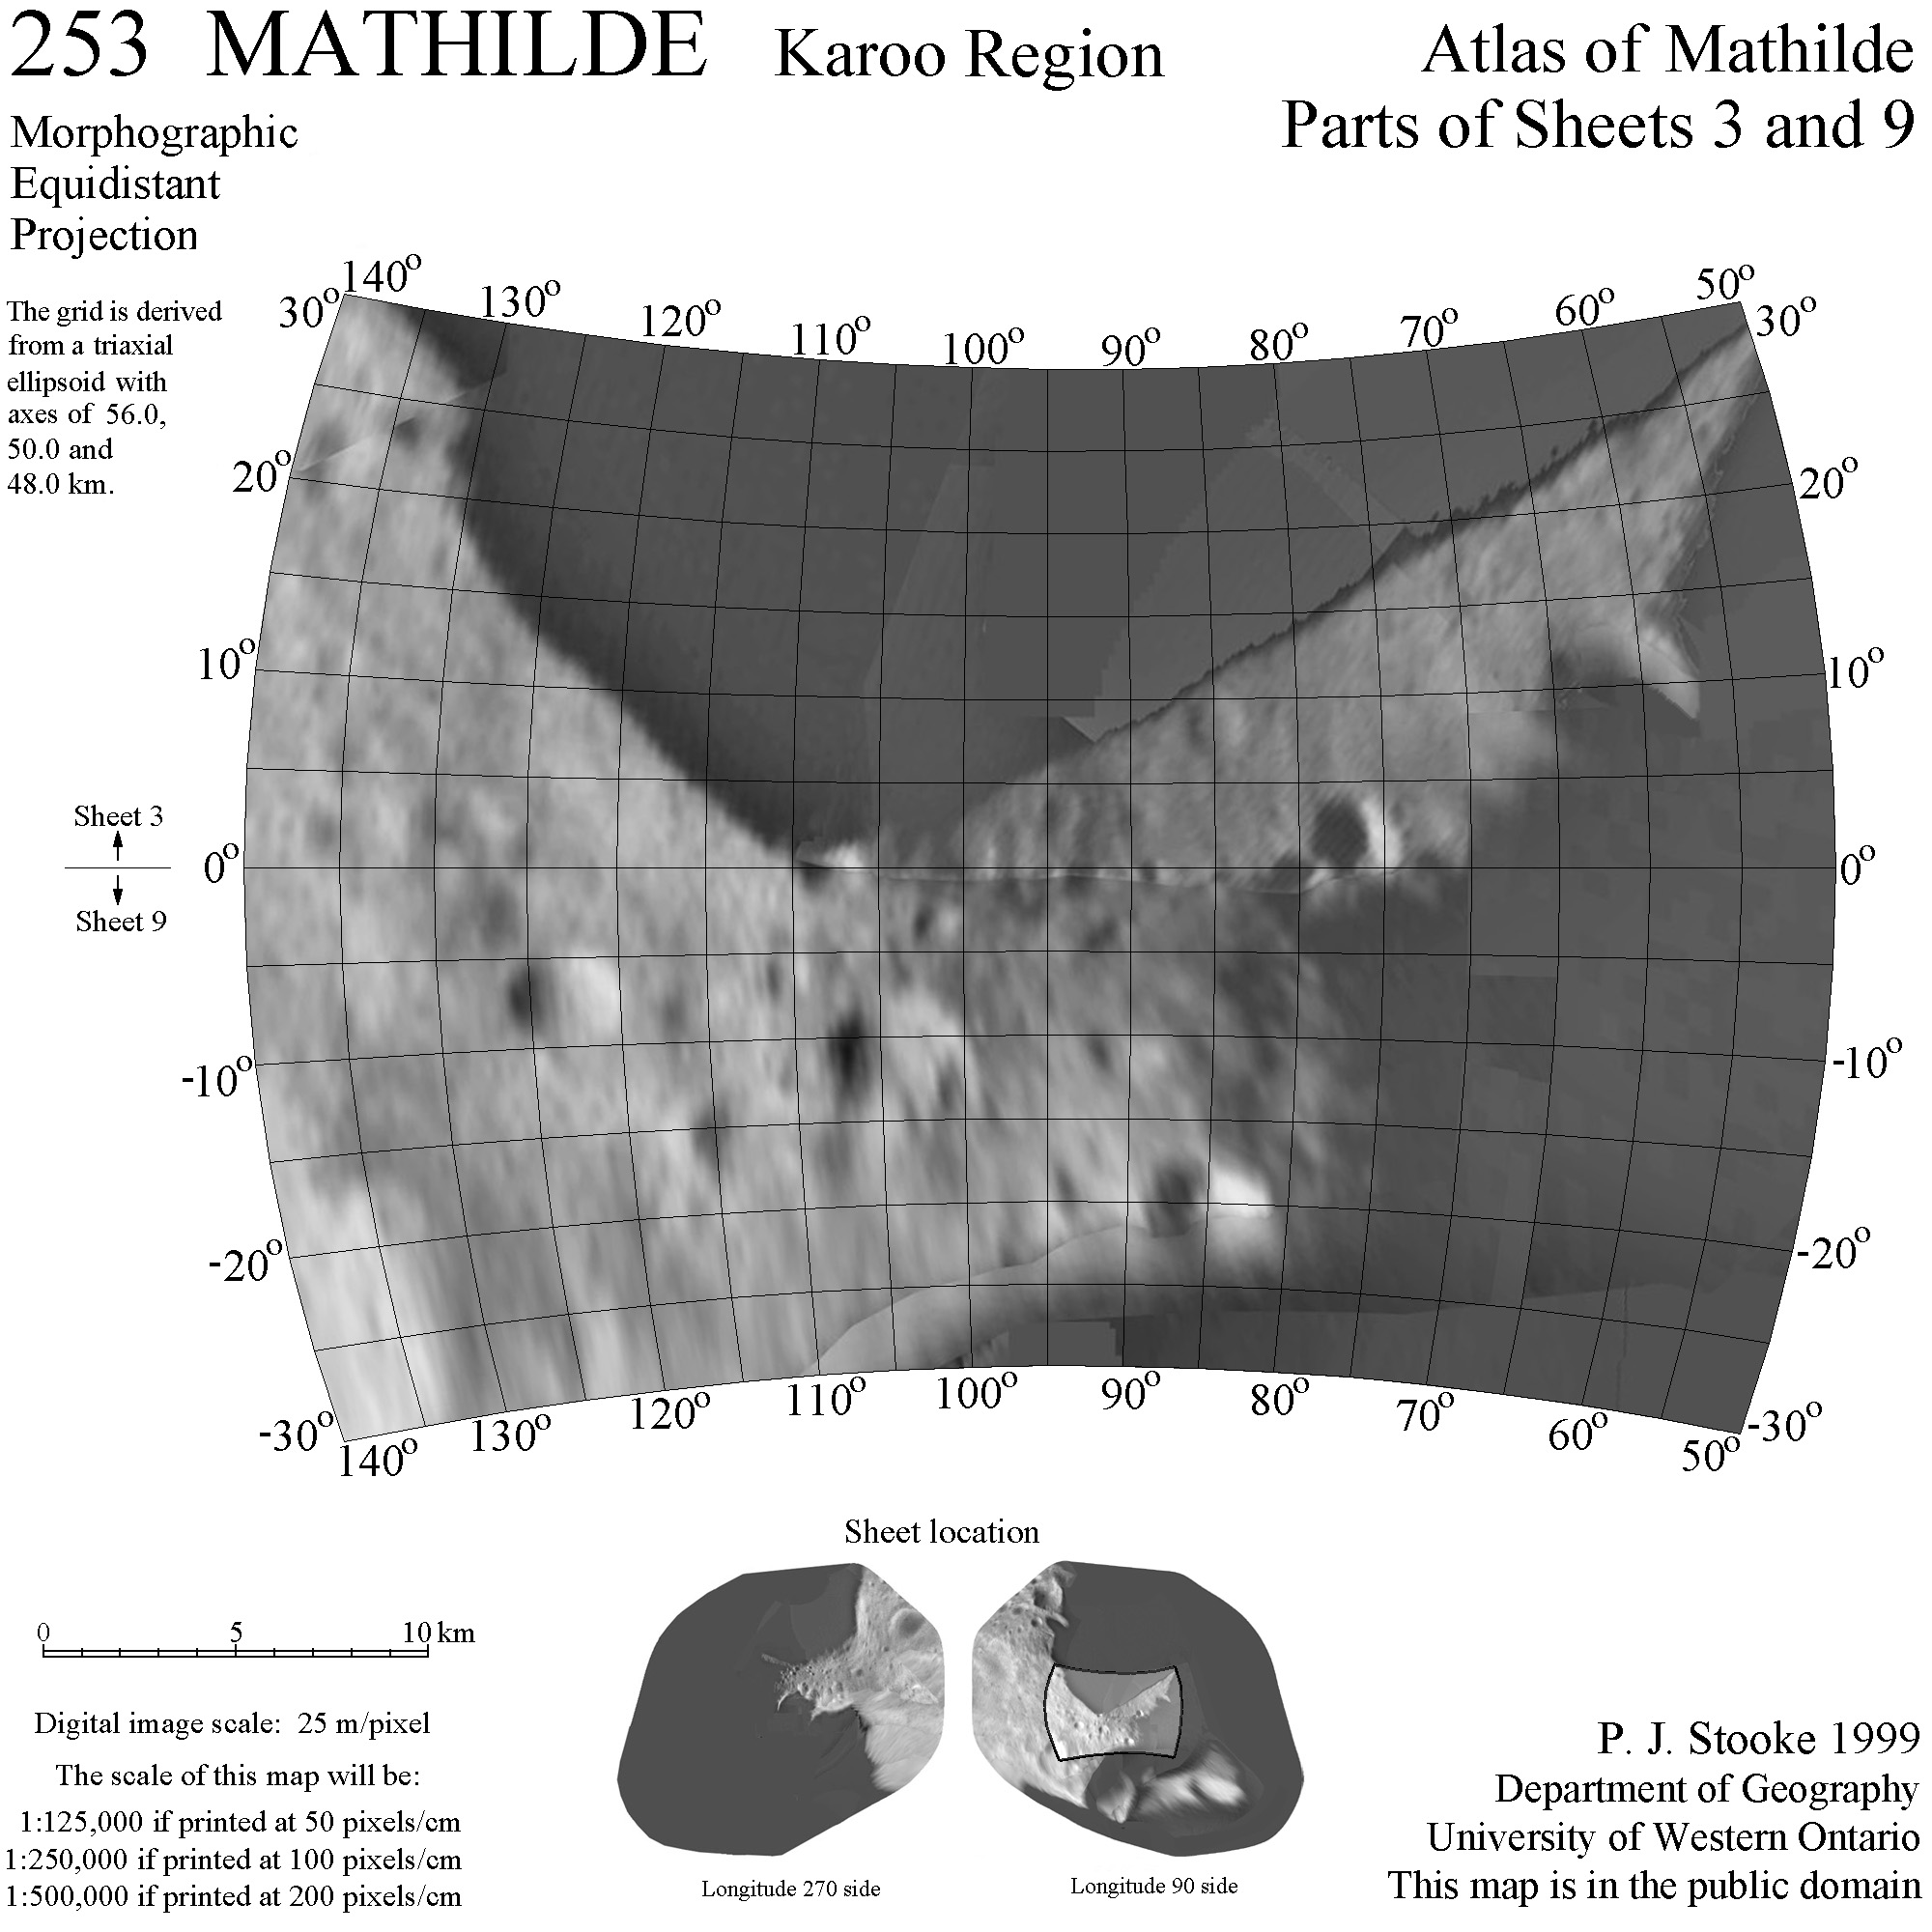
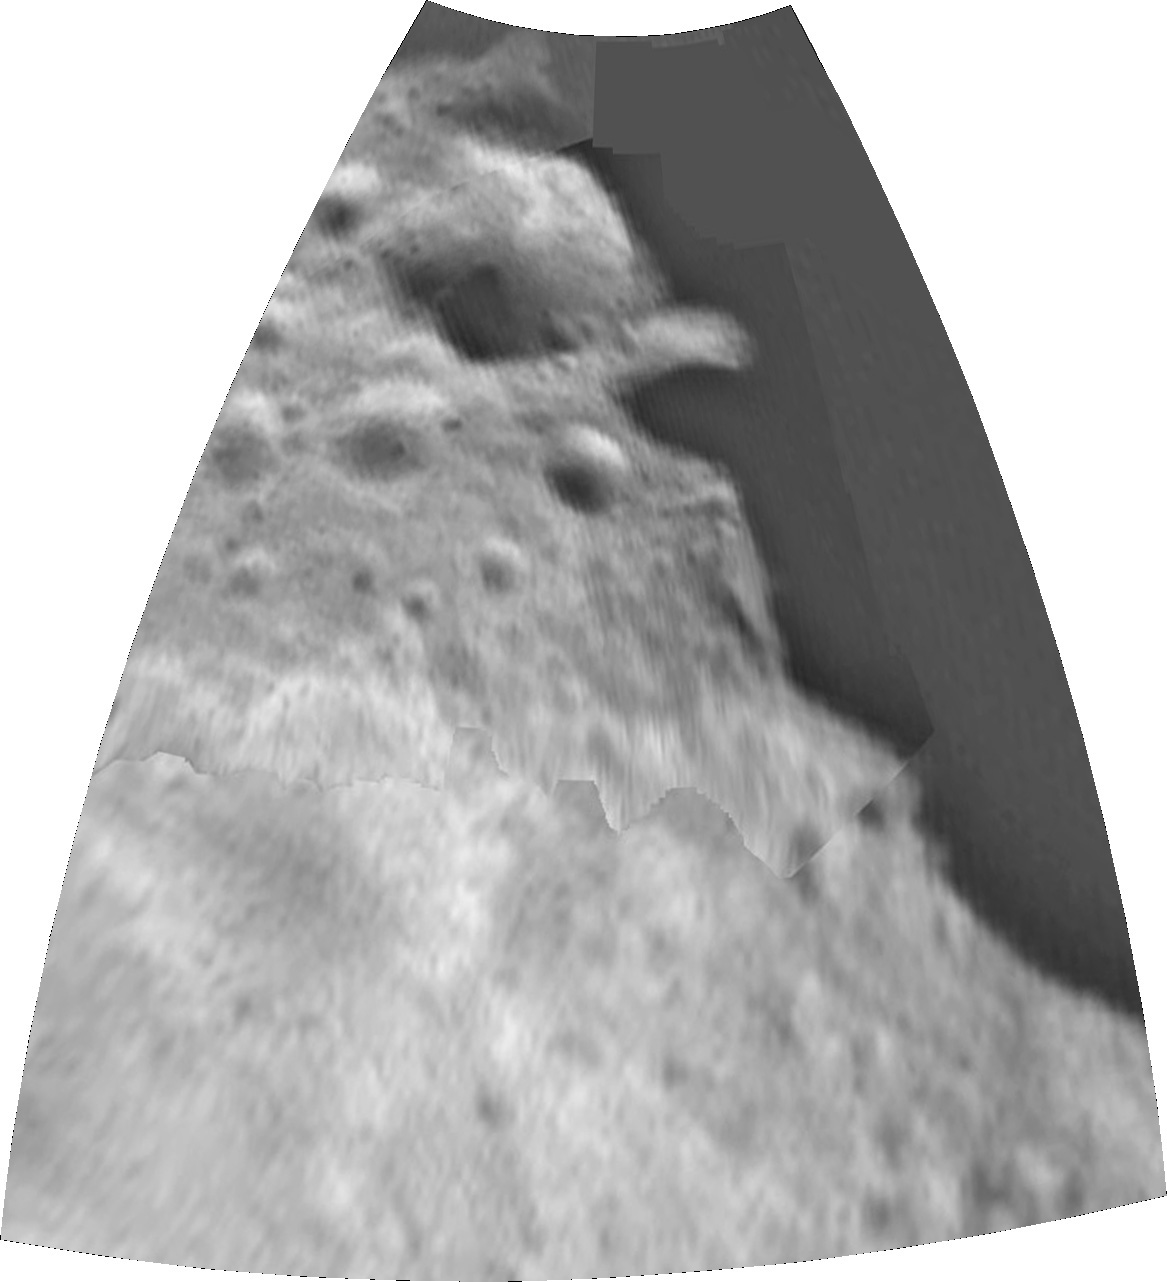
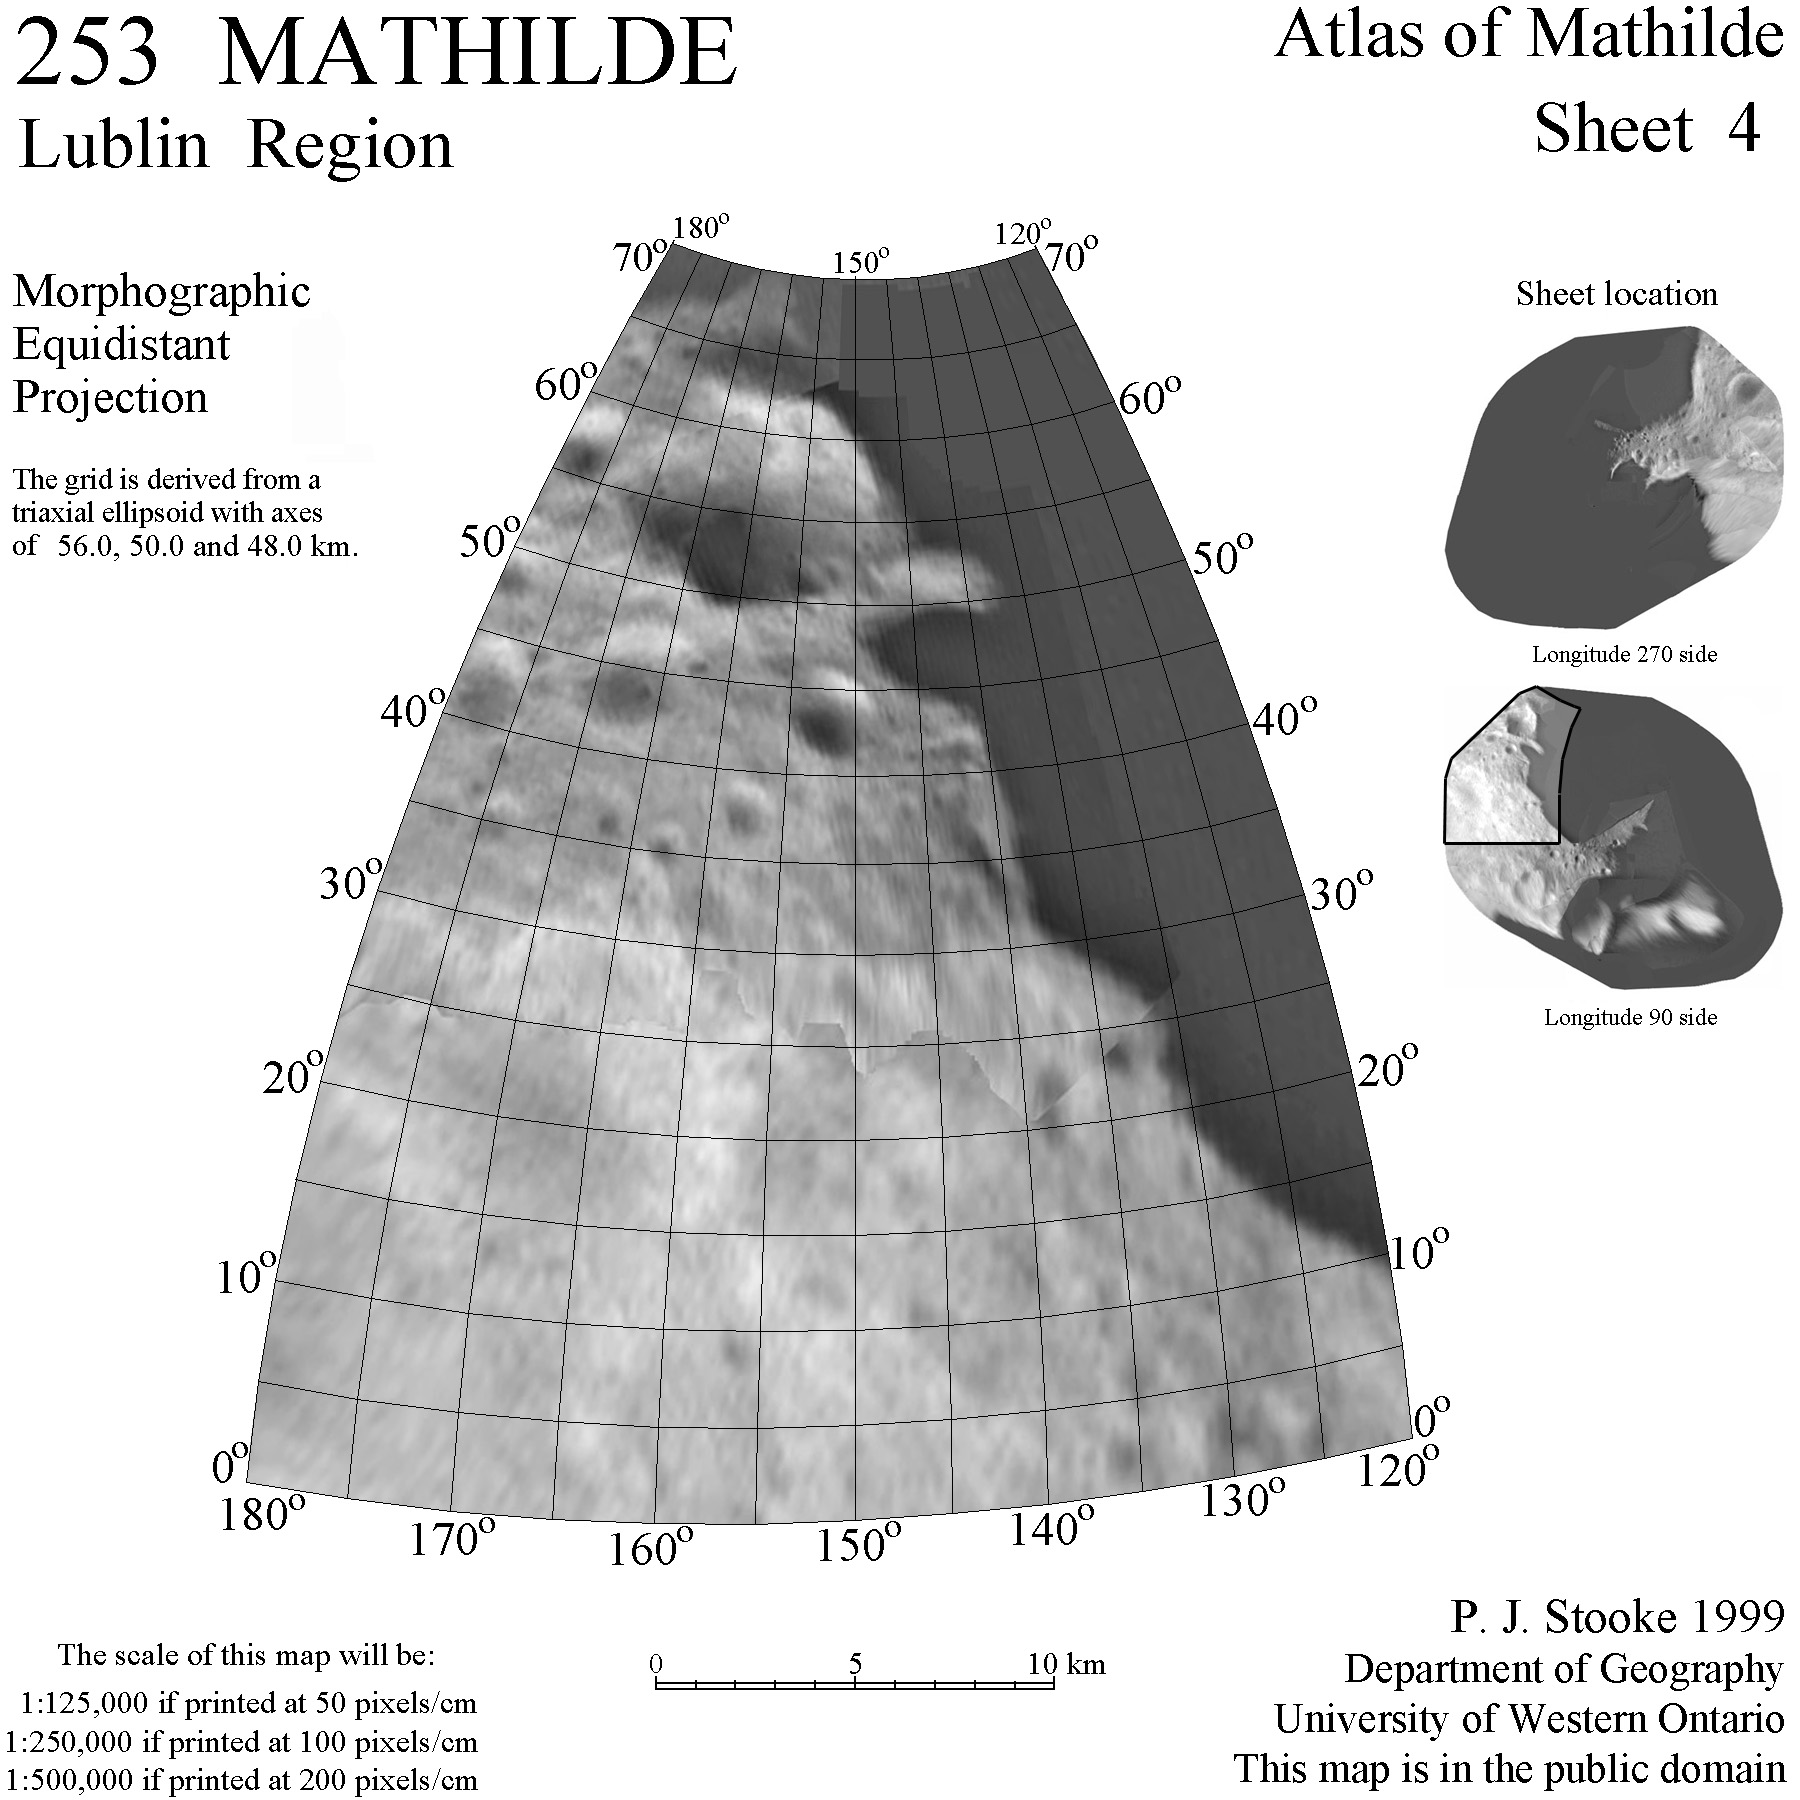
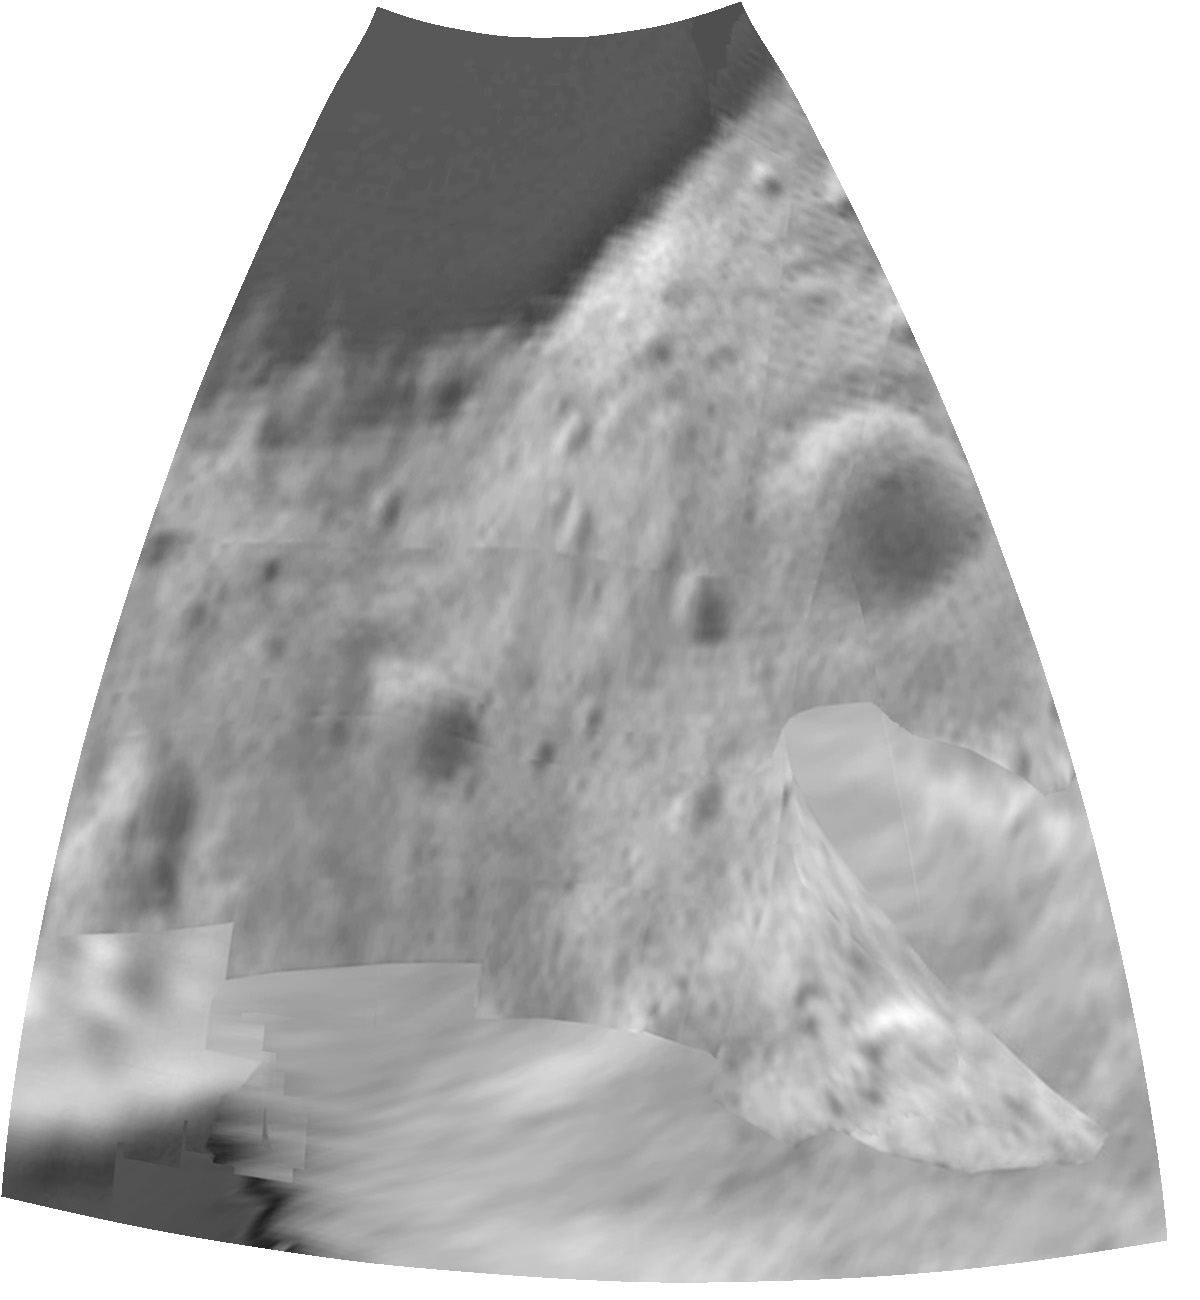
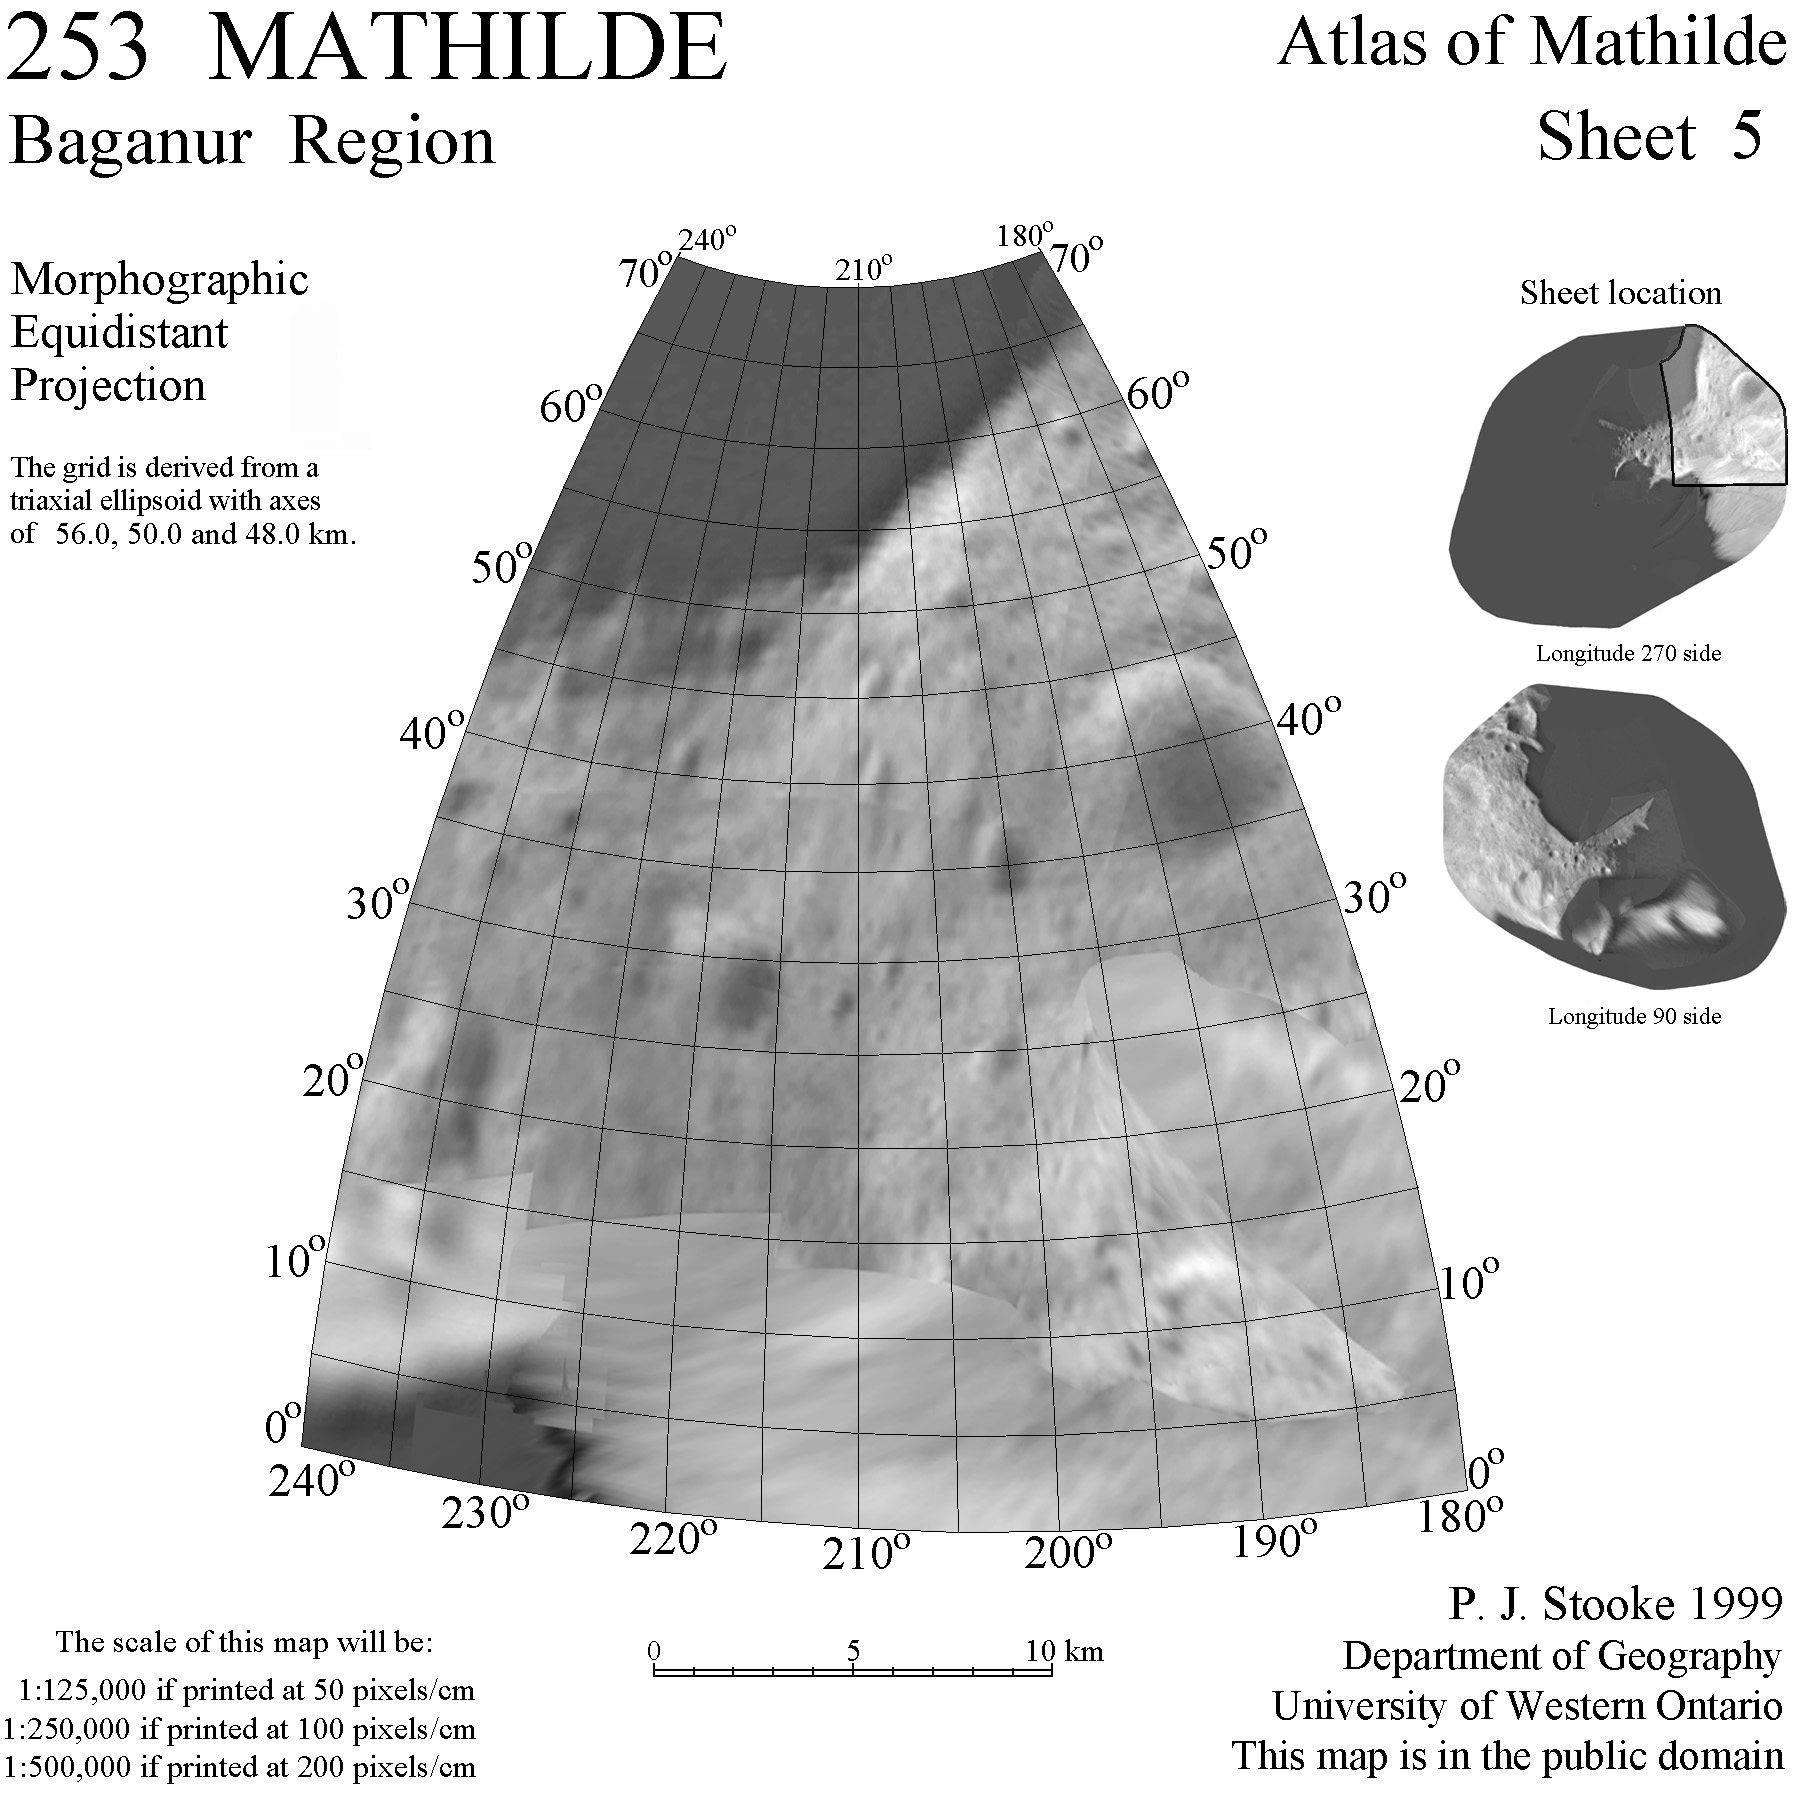
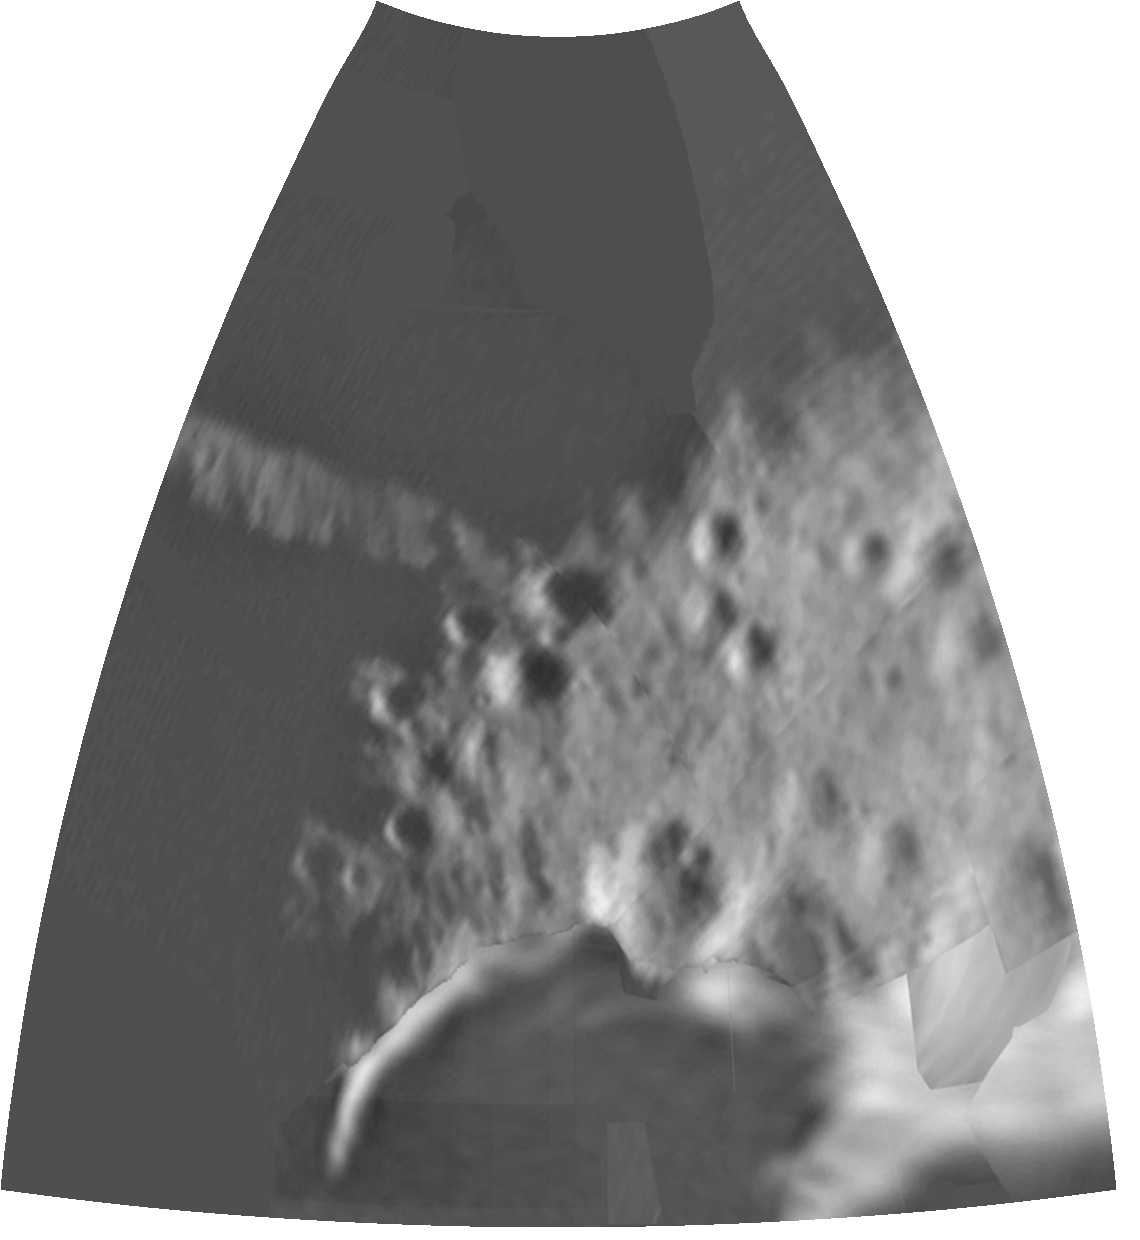
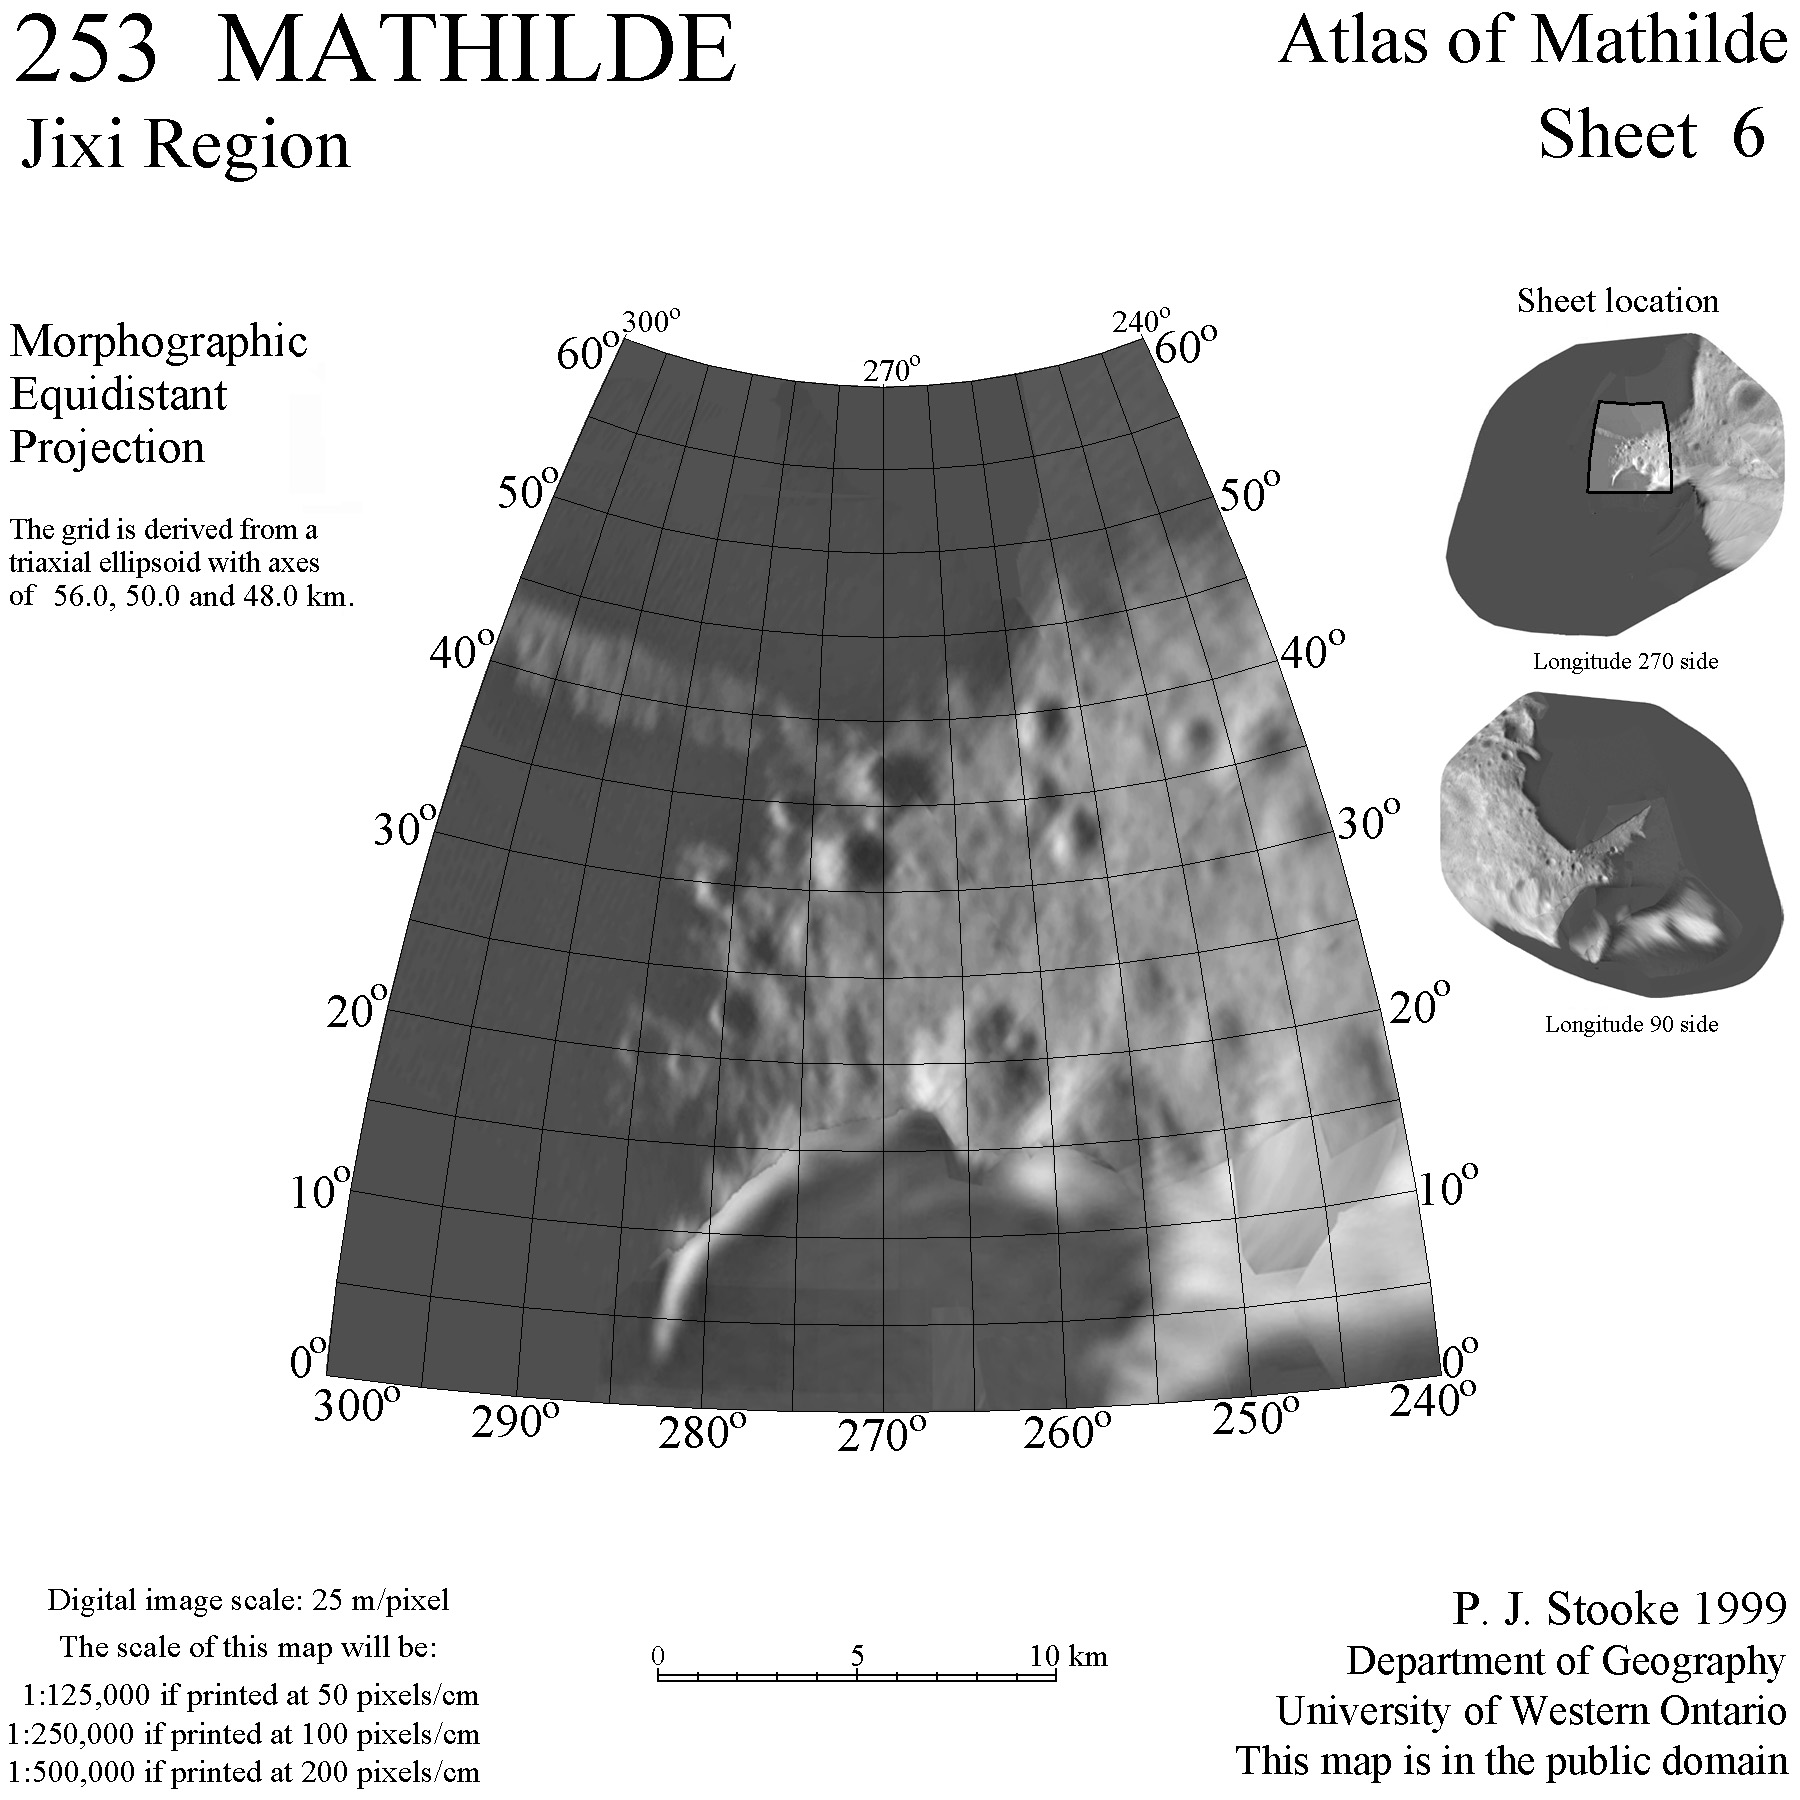
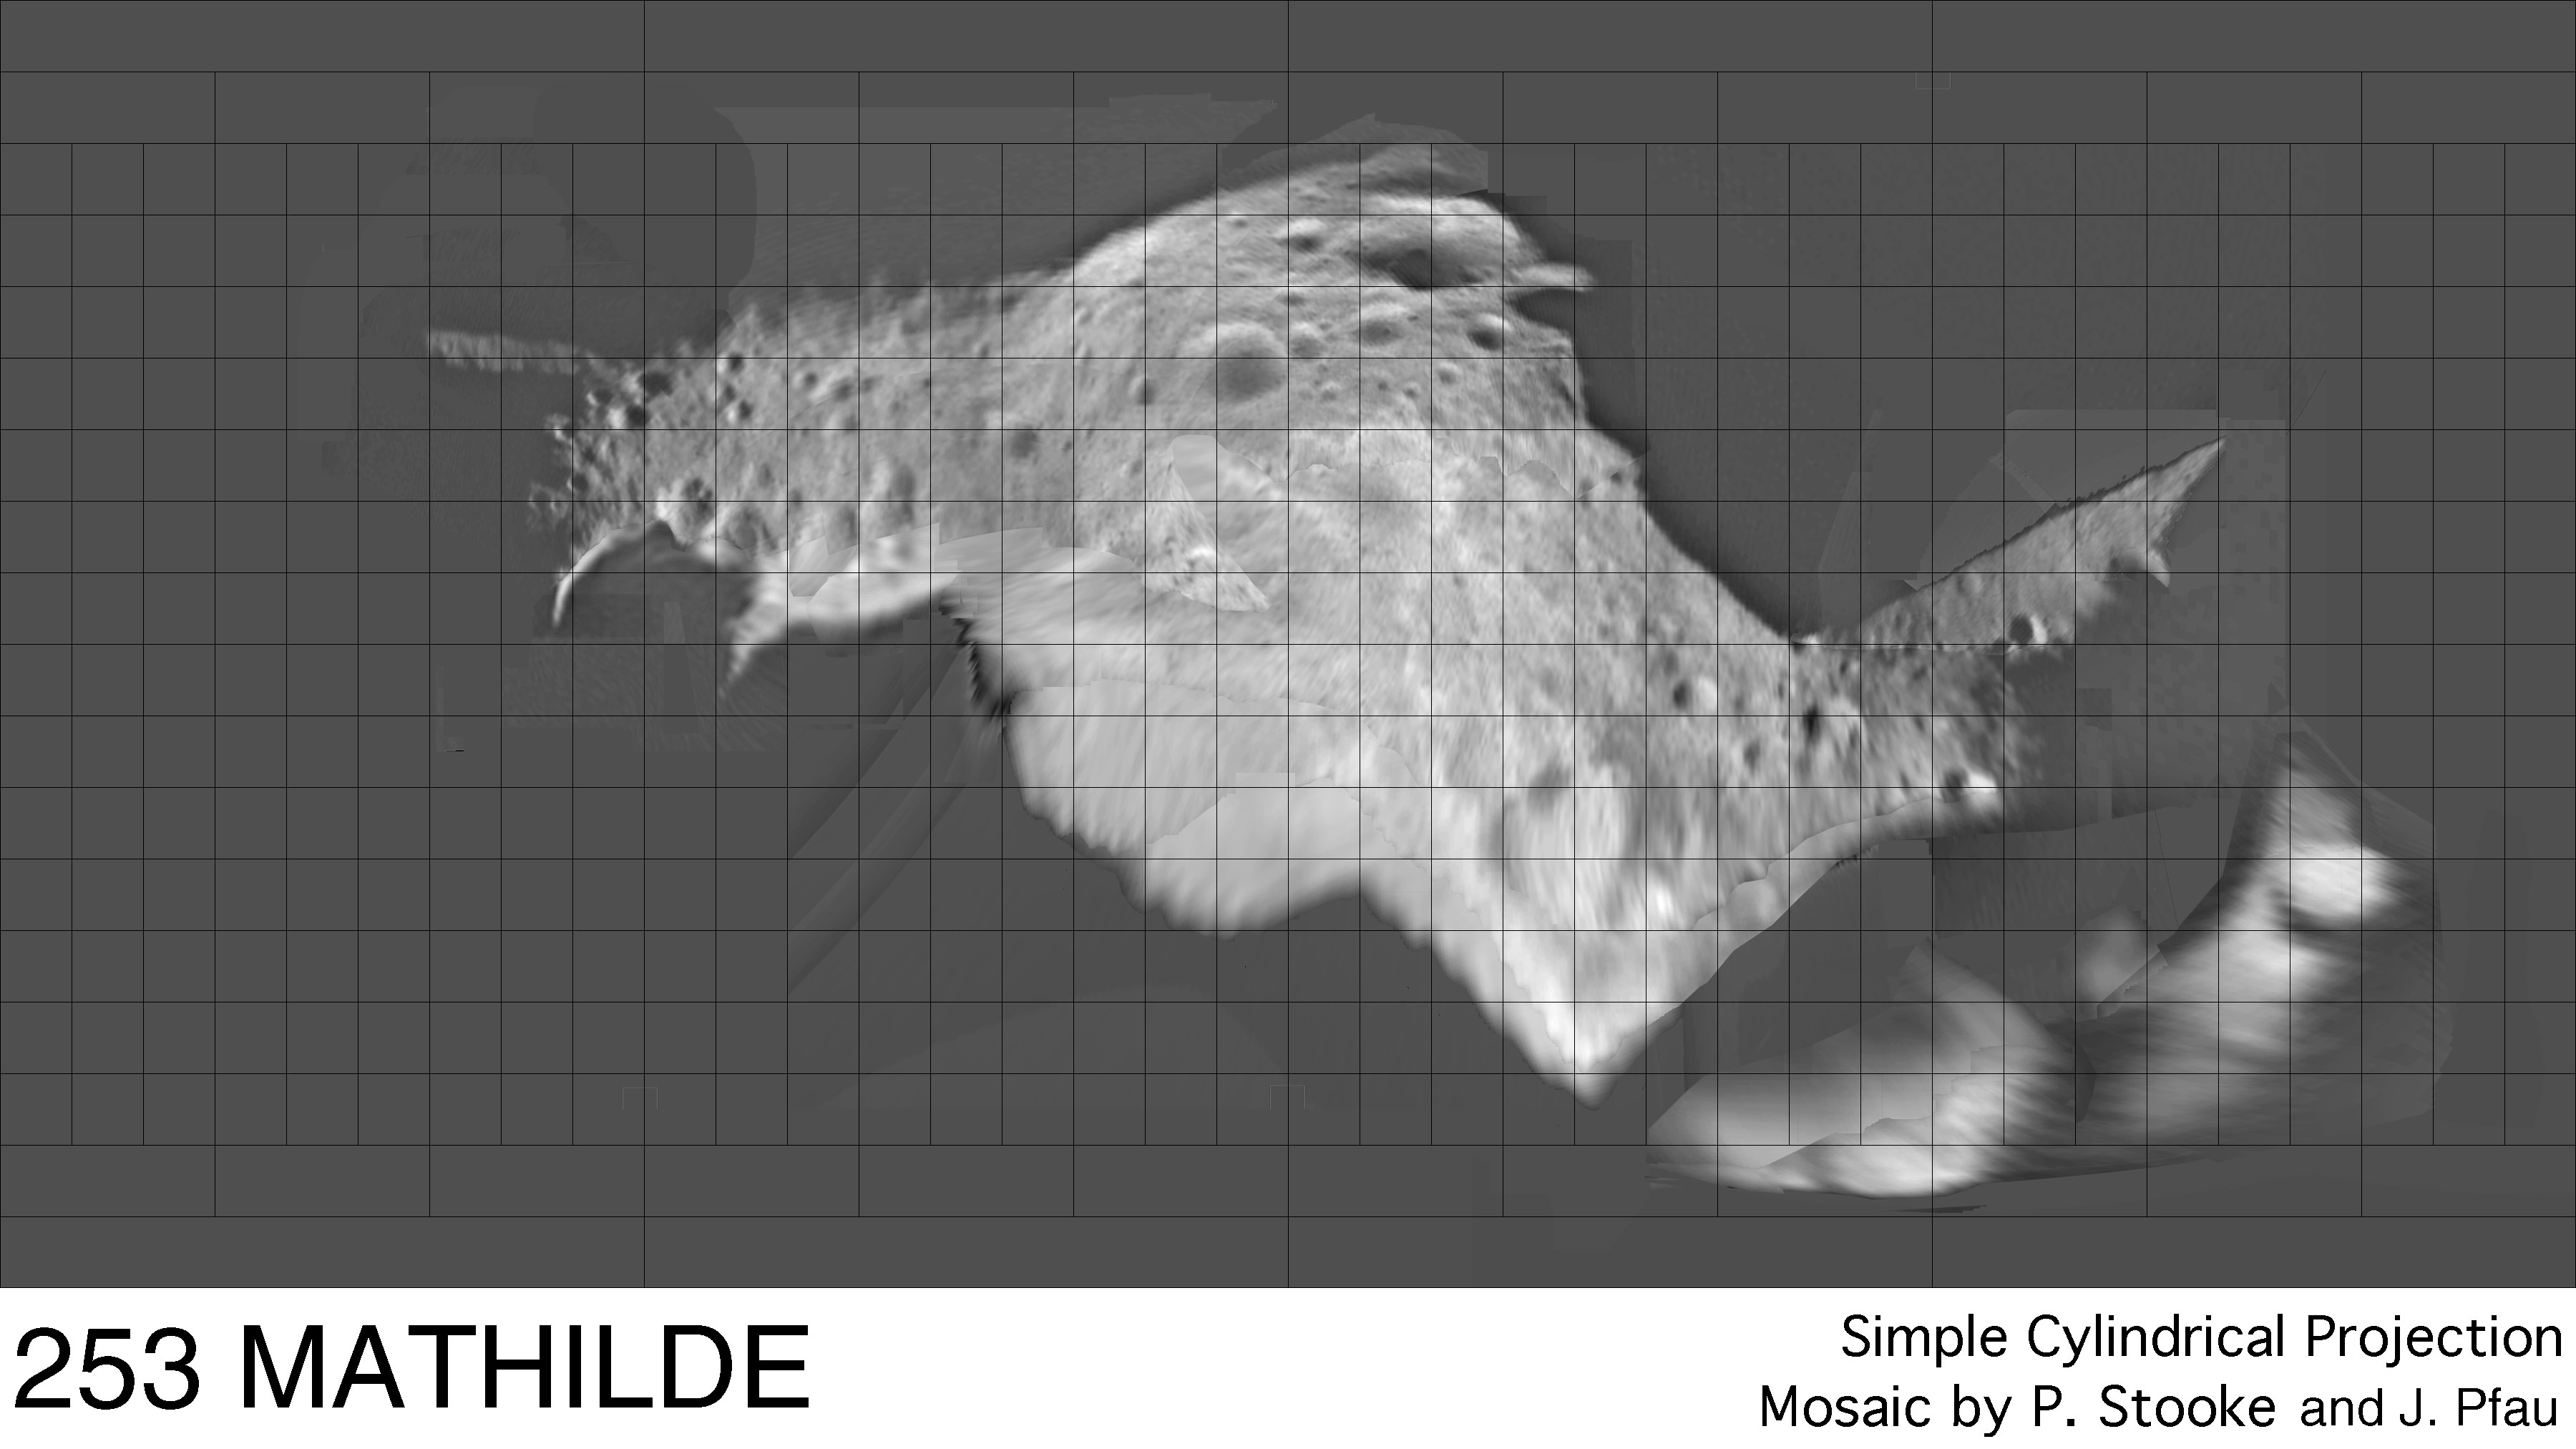
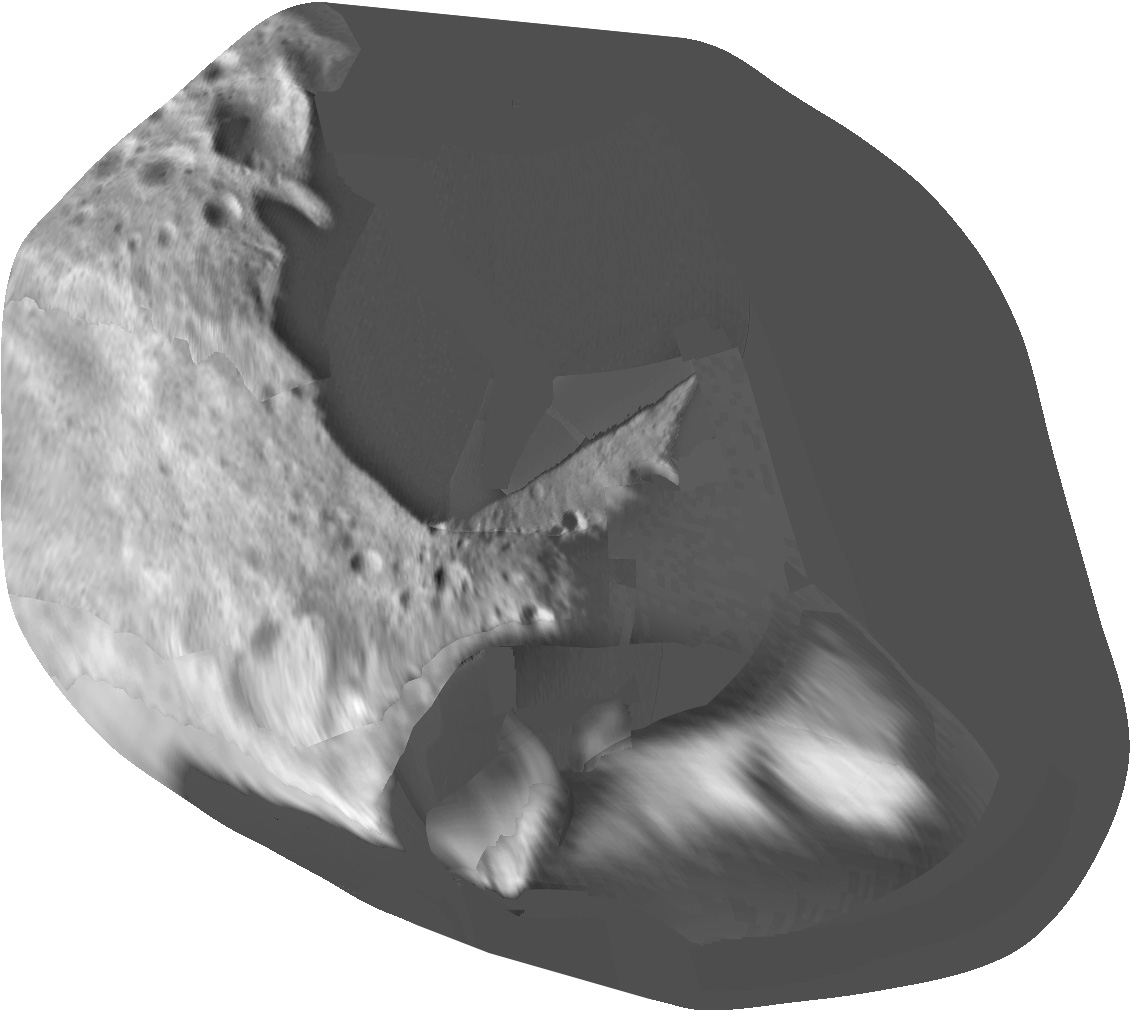
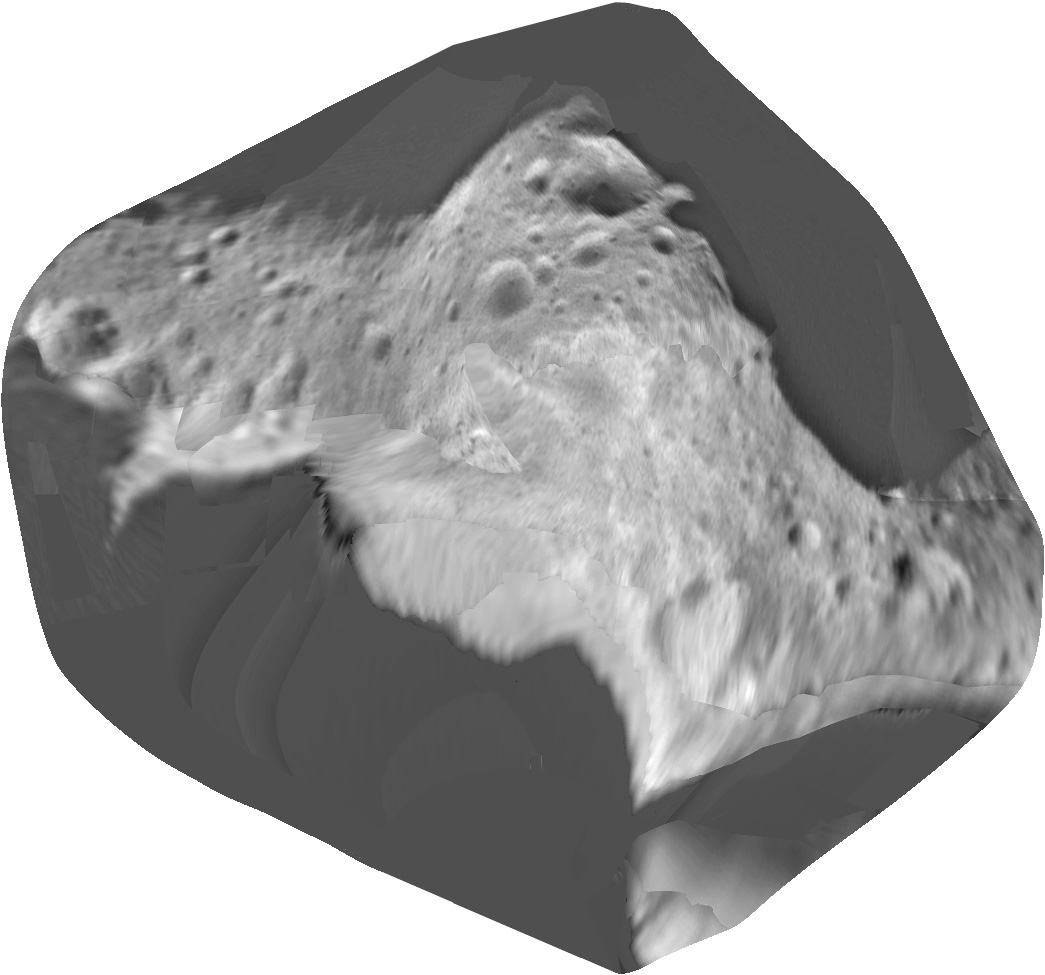
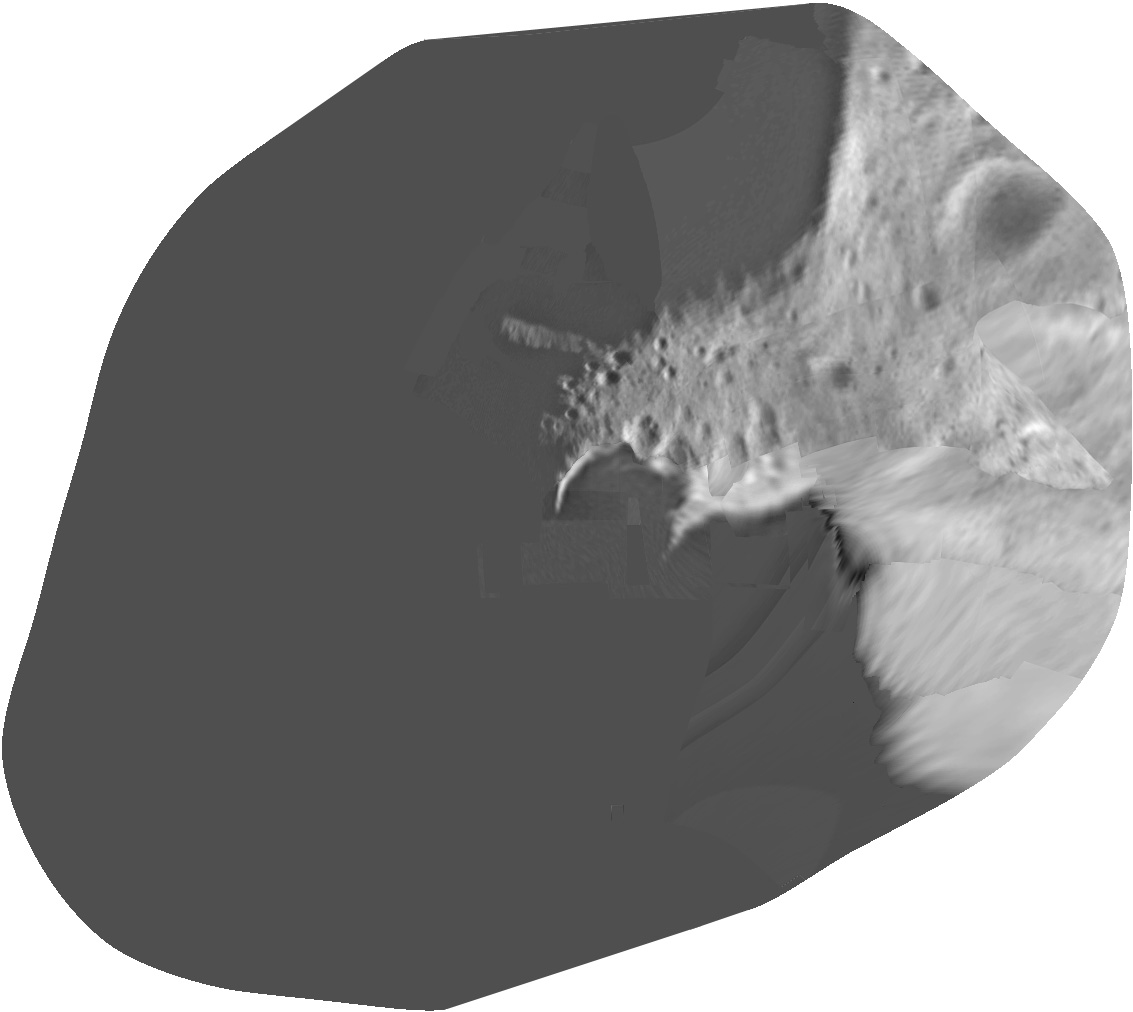
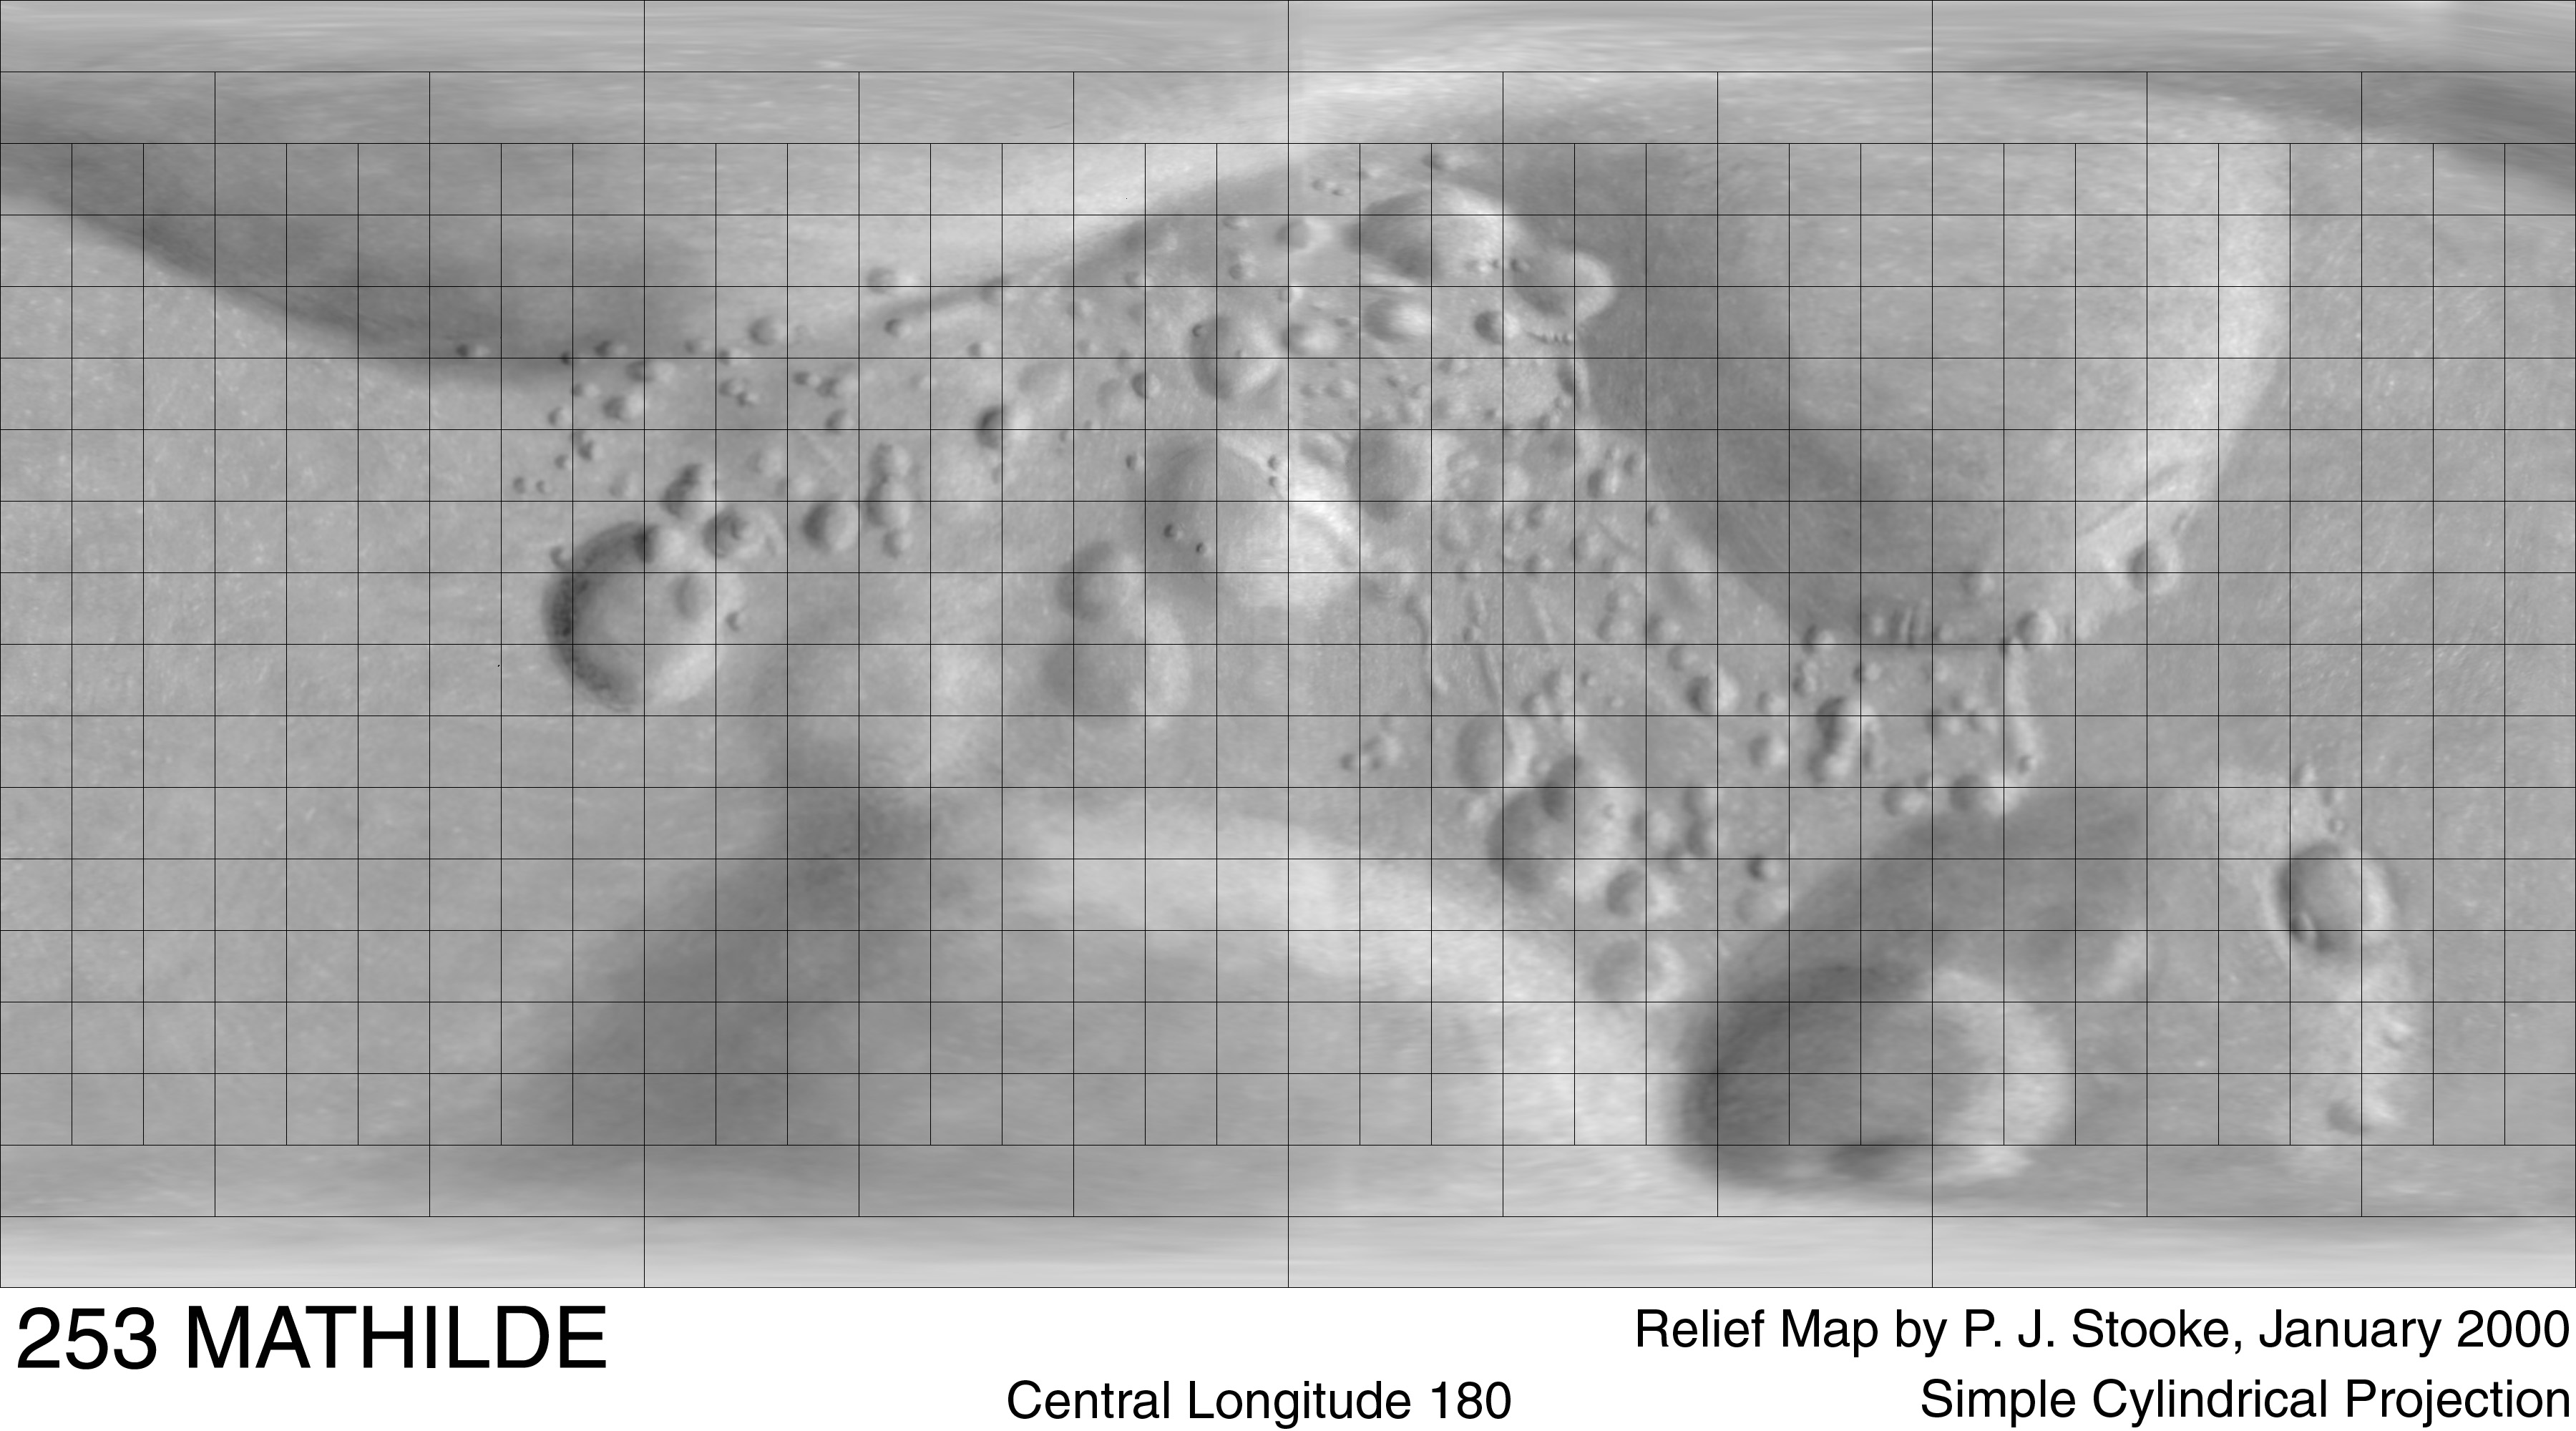
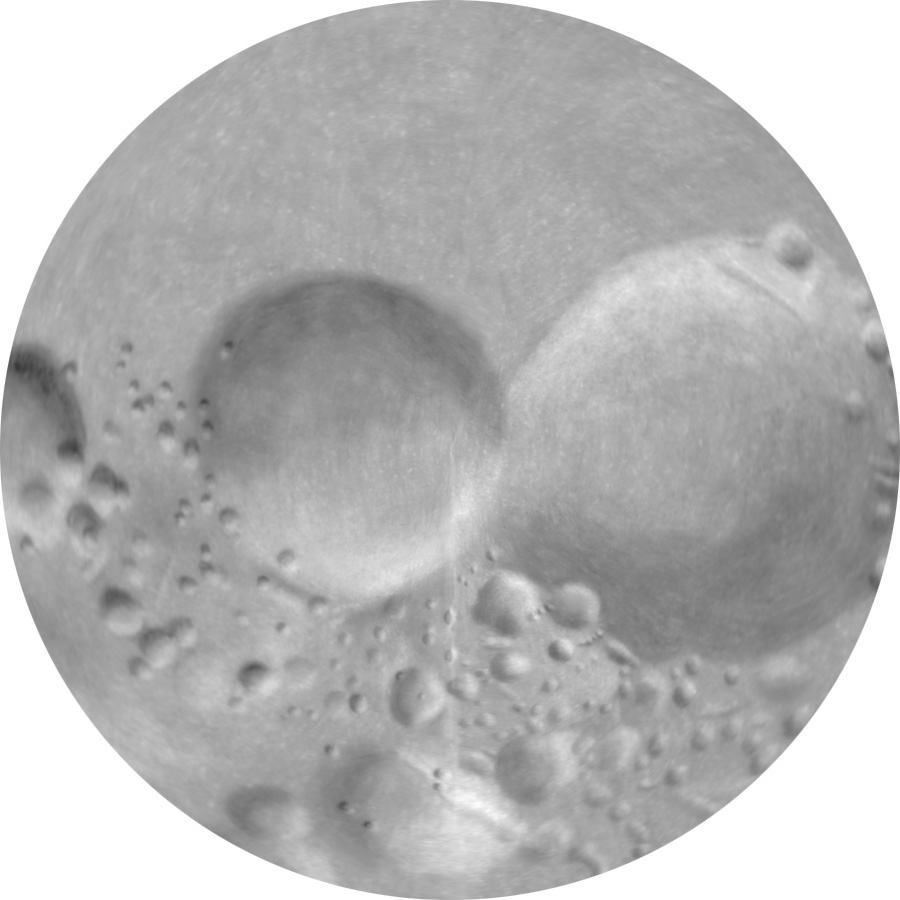
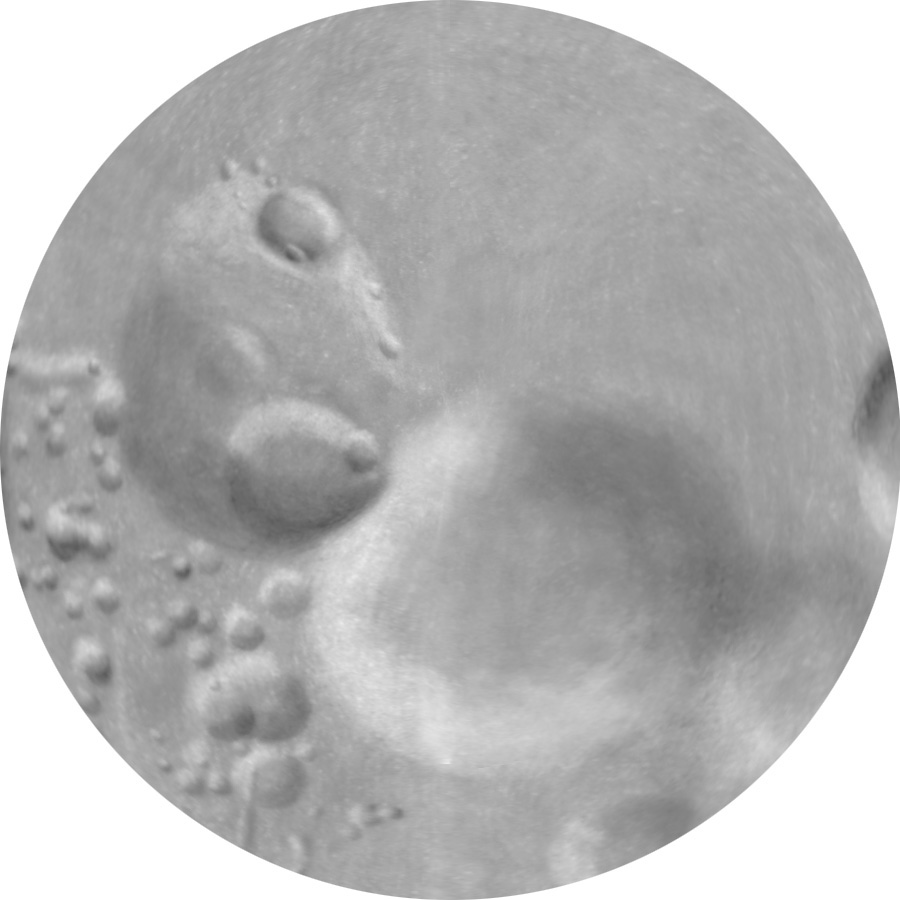
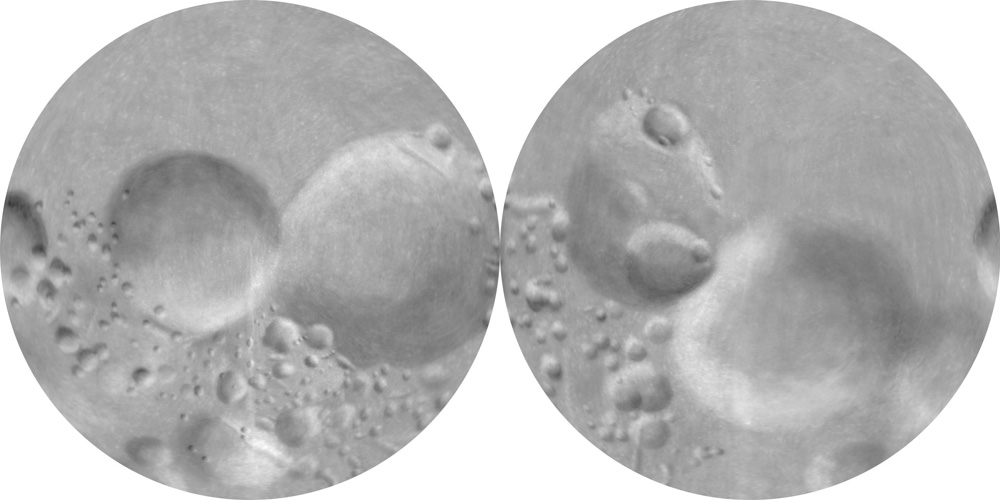
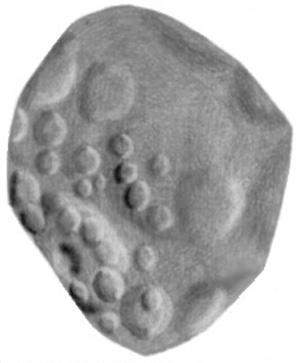
Asteroid 253 Mathilde
A. Azimuthal (Morphographic) Equidistant Projection photomosaics.
These would cover all of Mathilde in 14 sheets, but limited coverage by
the NEAR camera results in only 4 sheets being produced. Sheet limits
are shown on the gridded and labeled versions. Digital scale is
25 m/pixel. Original photomosaic created by P. Stooke and J Pfau,
University of Western Ontario, using positional control from P. Thomas.
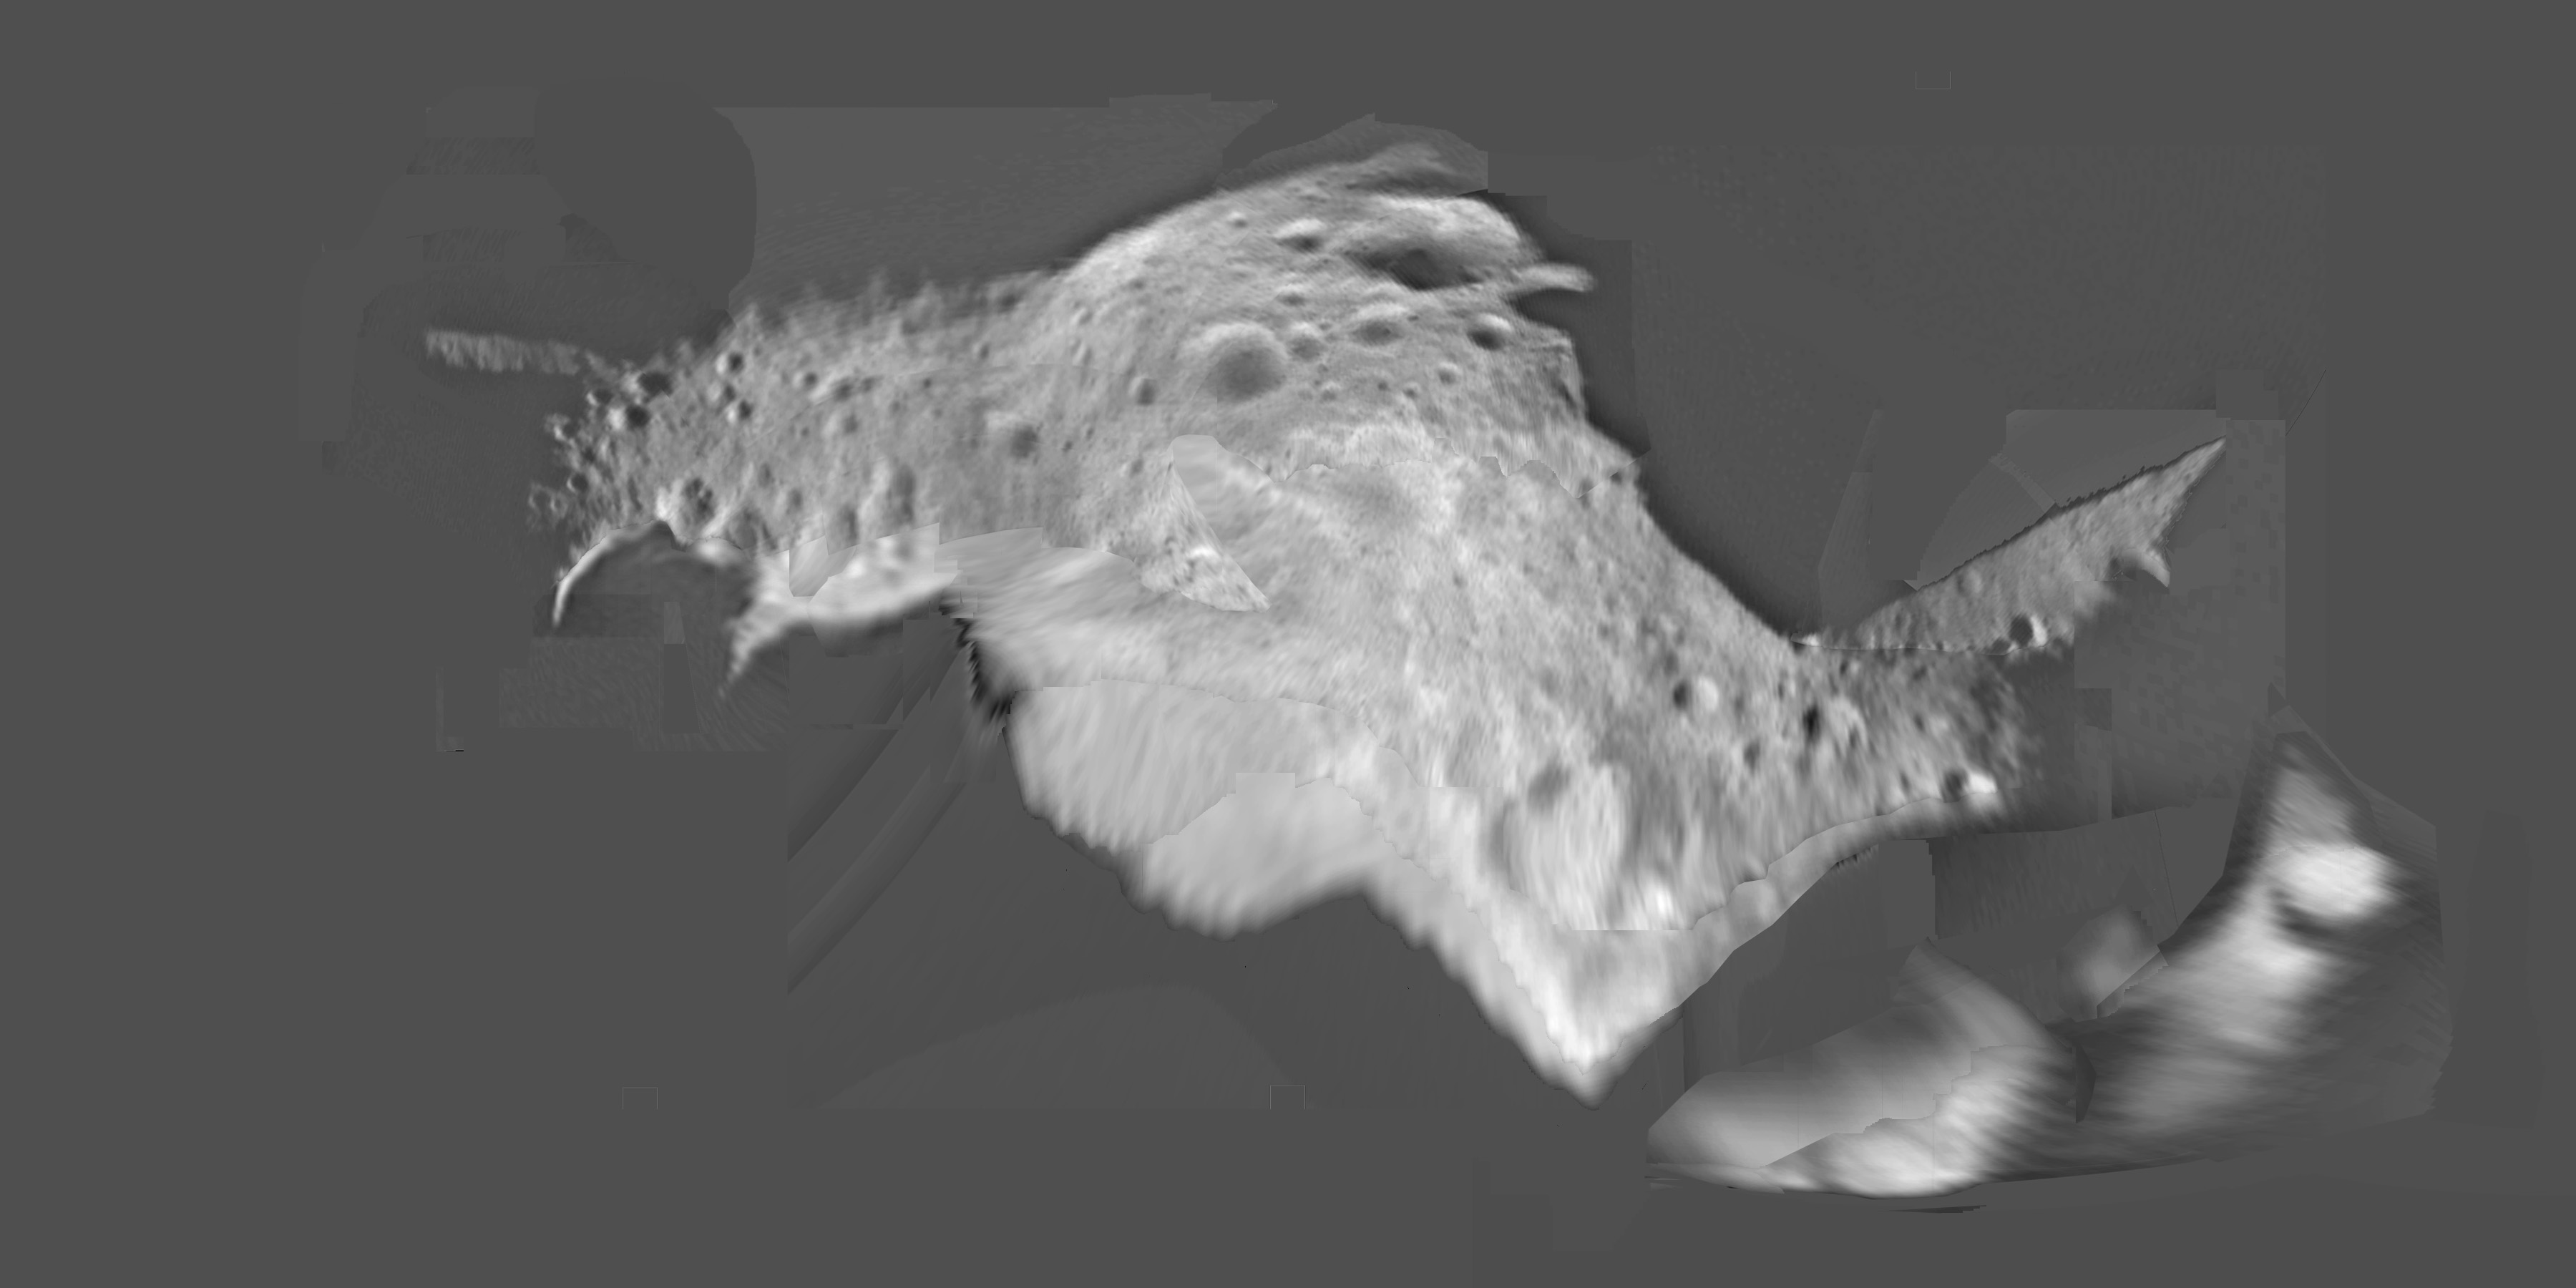
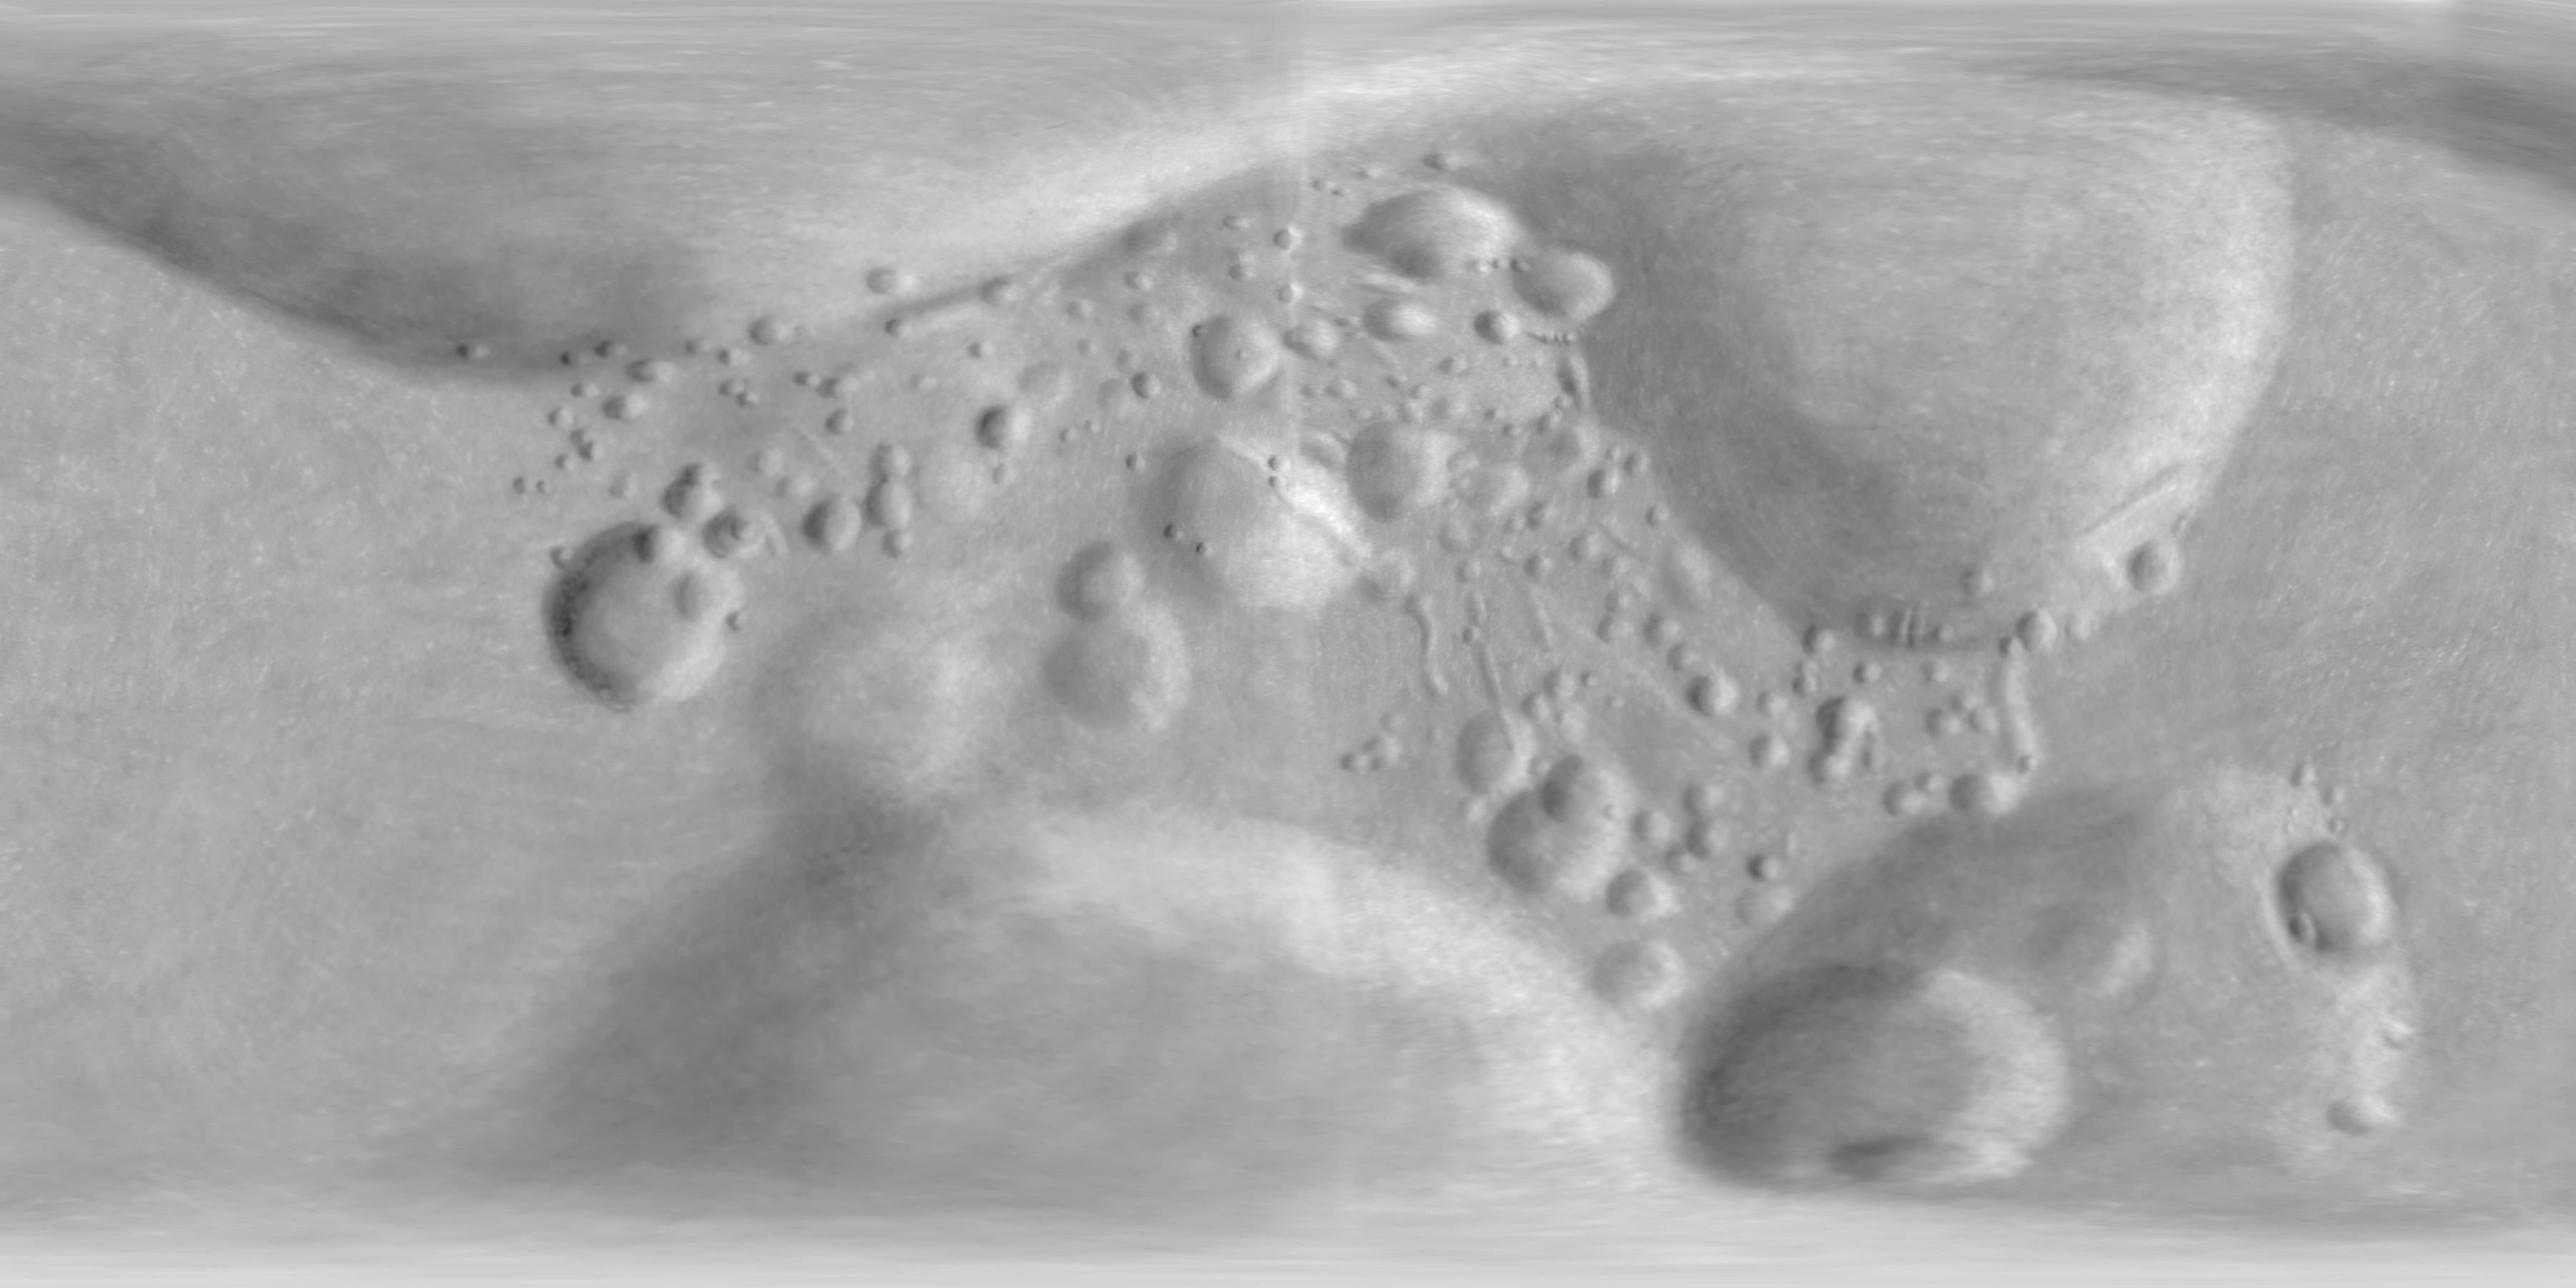
B. Global photomosaics, various projections. The photomosaic data used to
create the detailed maps above is also presented in full global form
in the following variations.
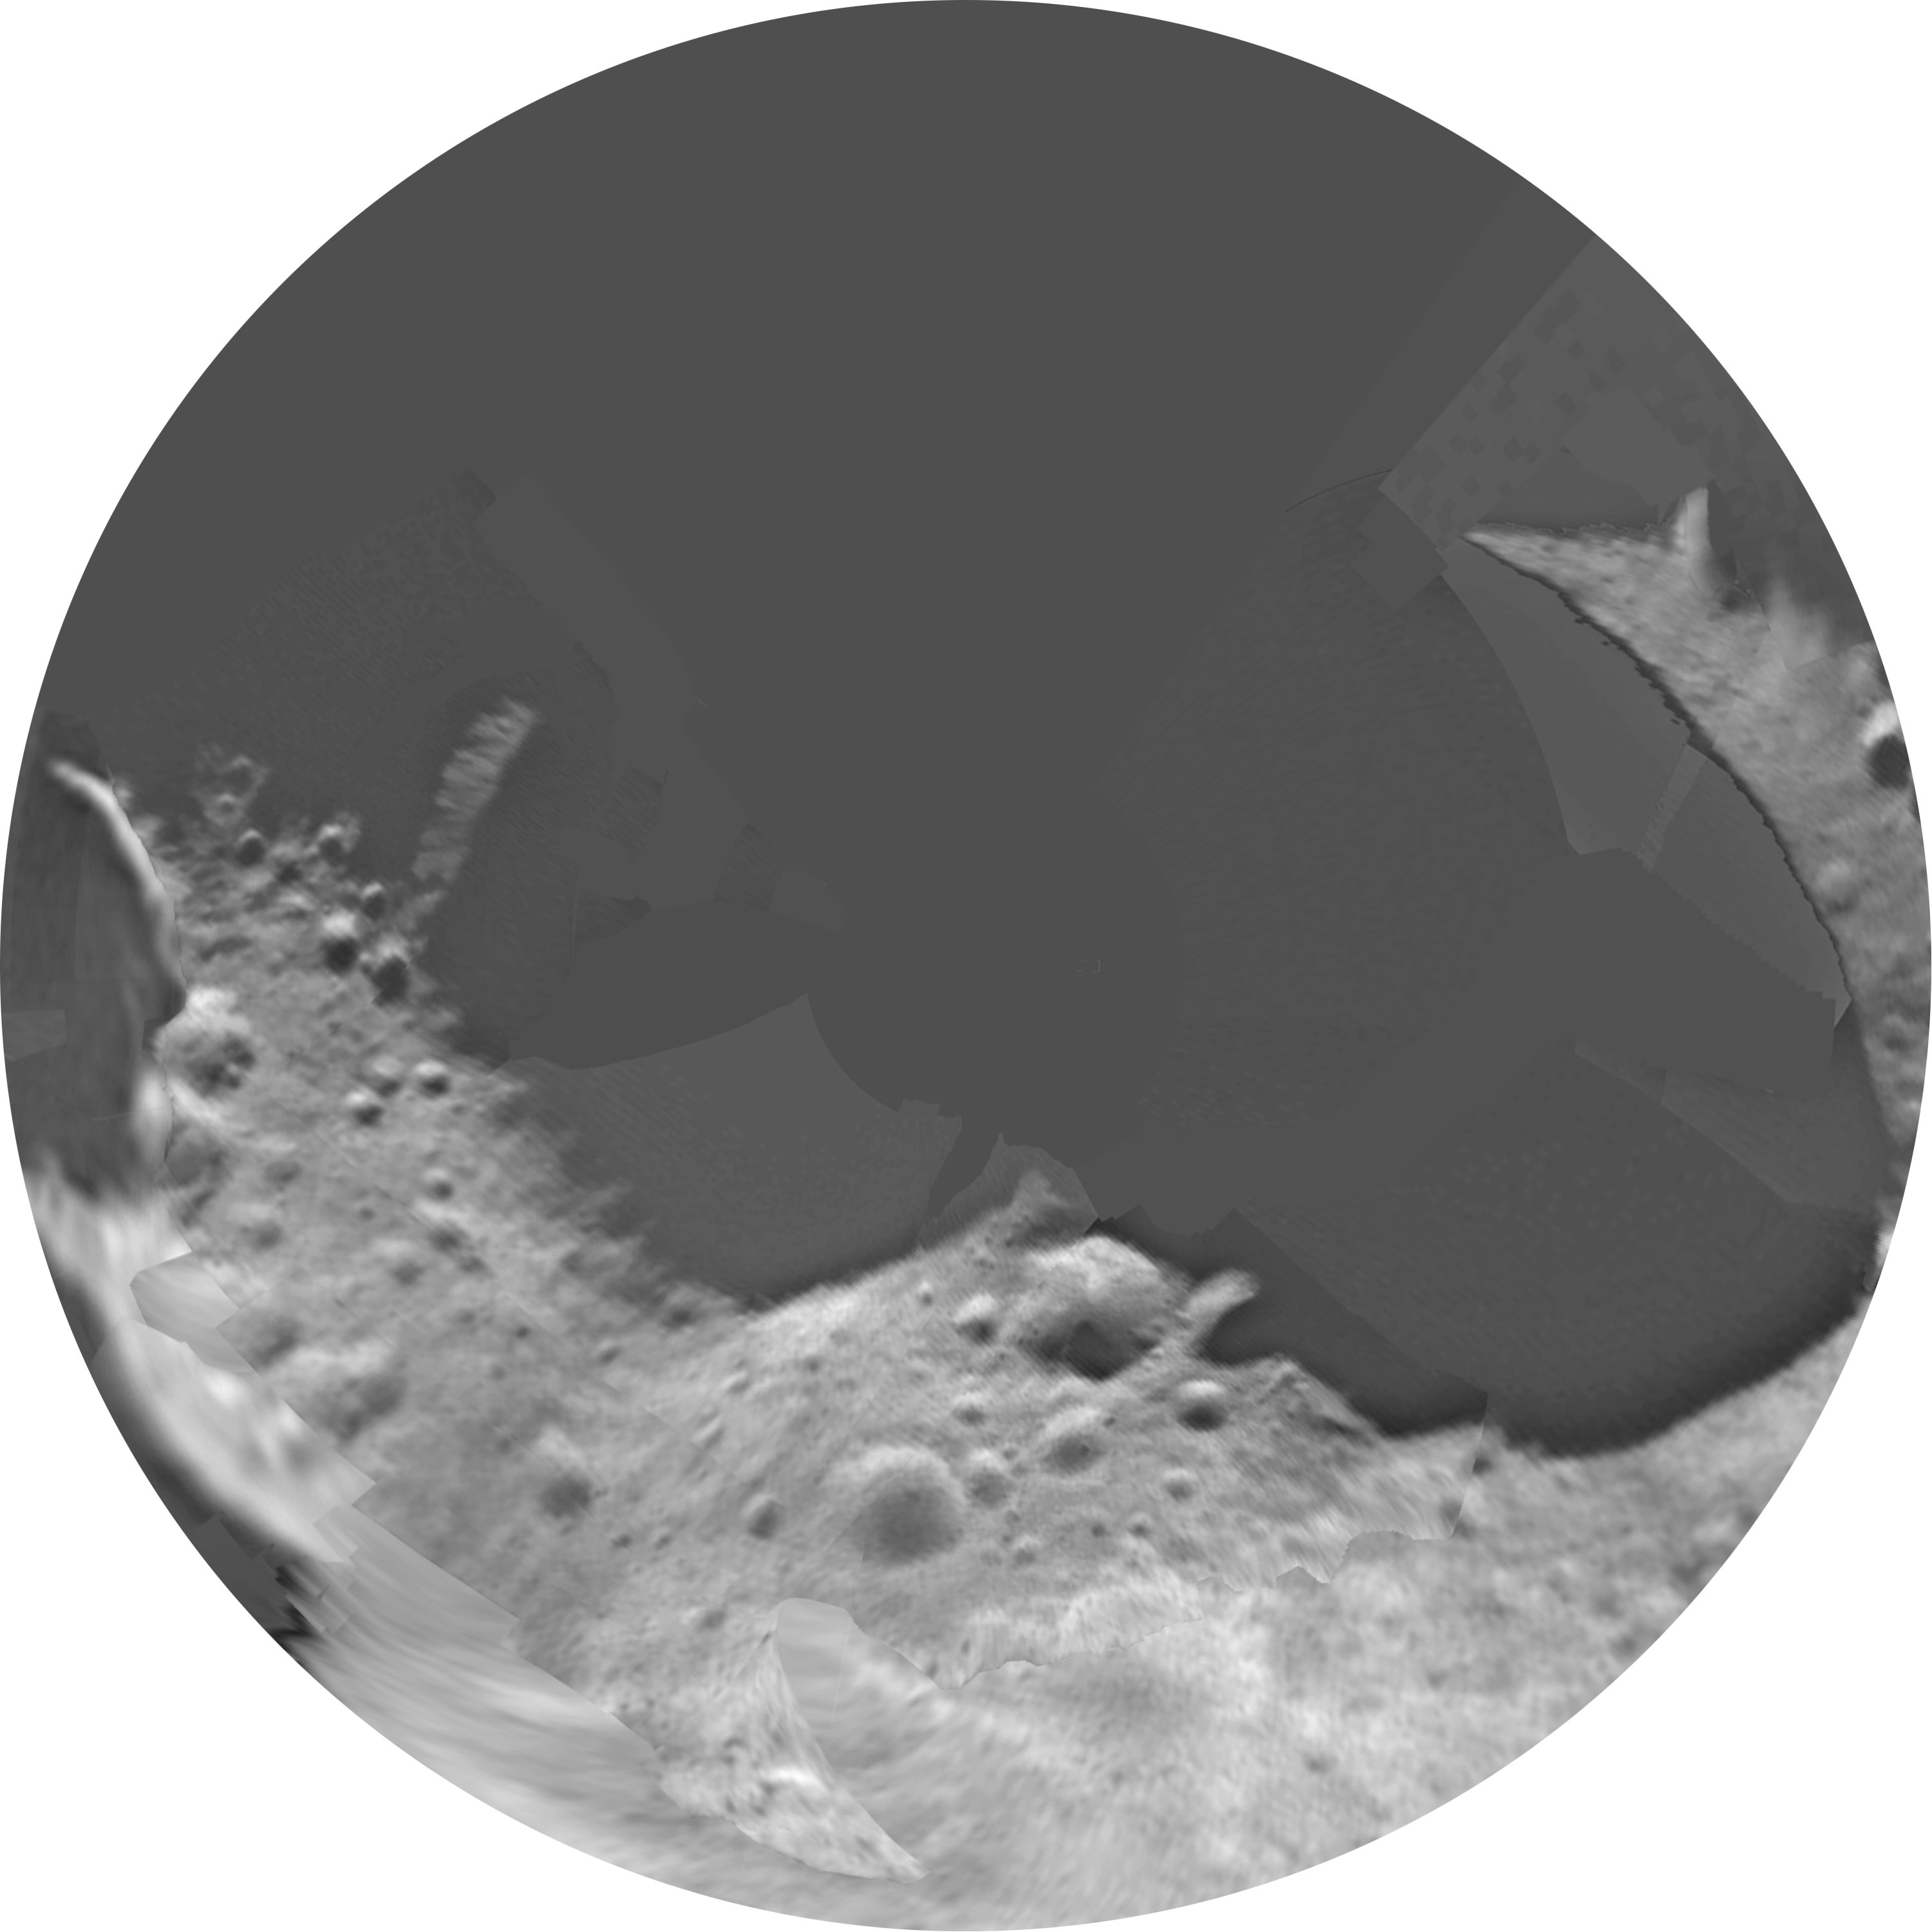
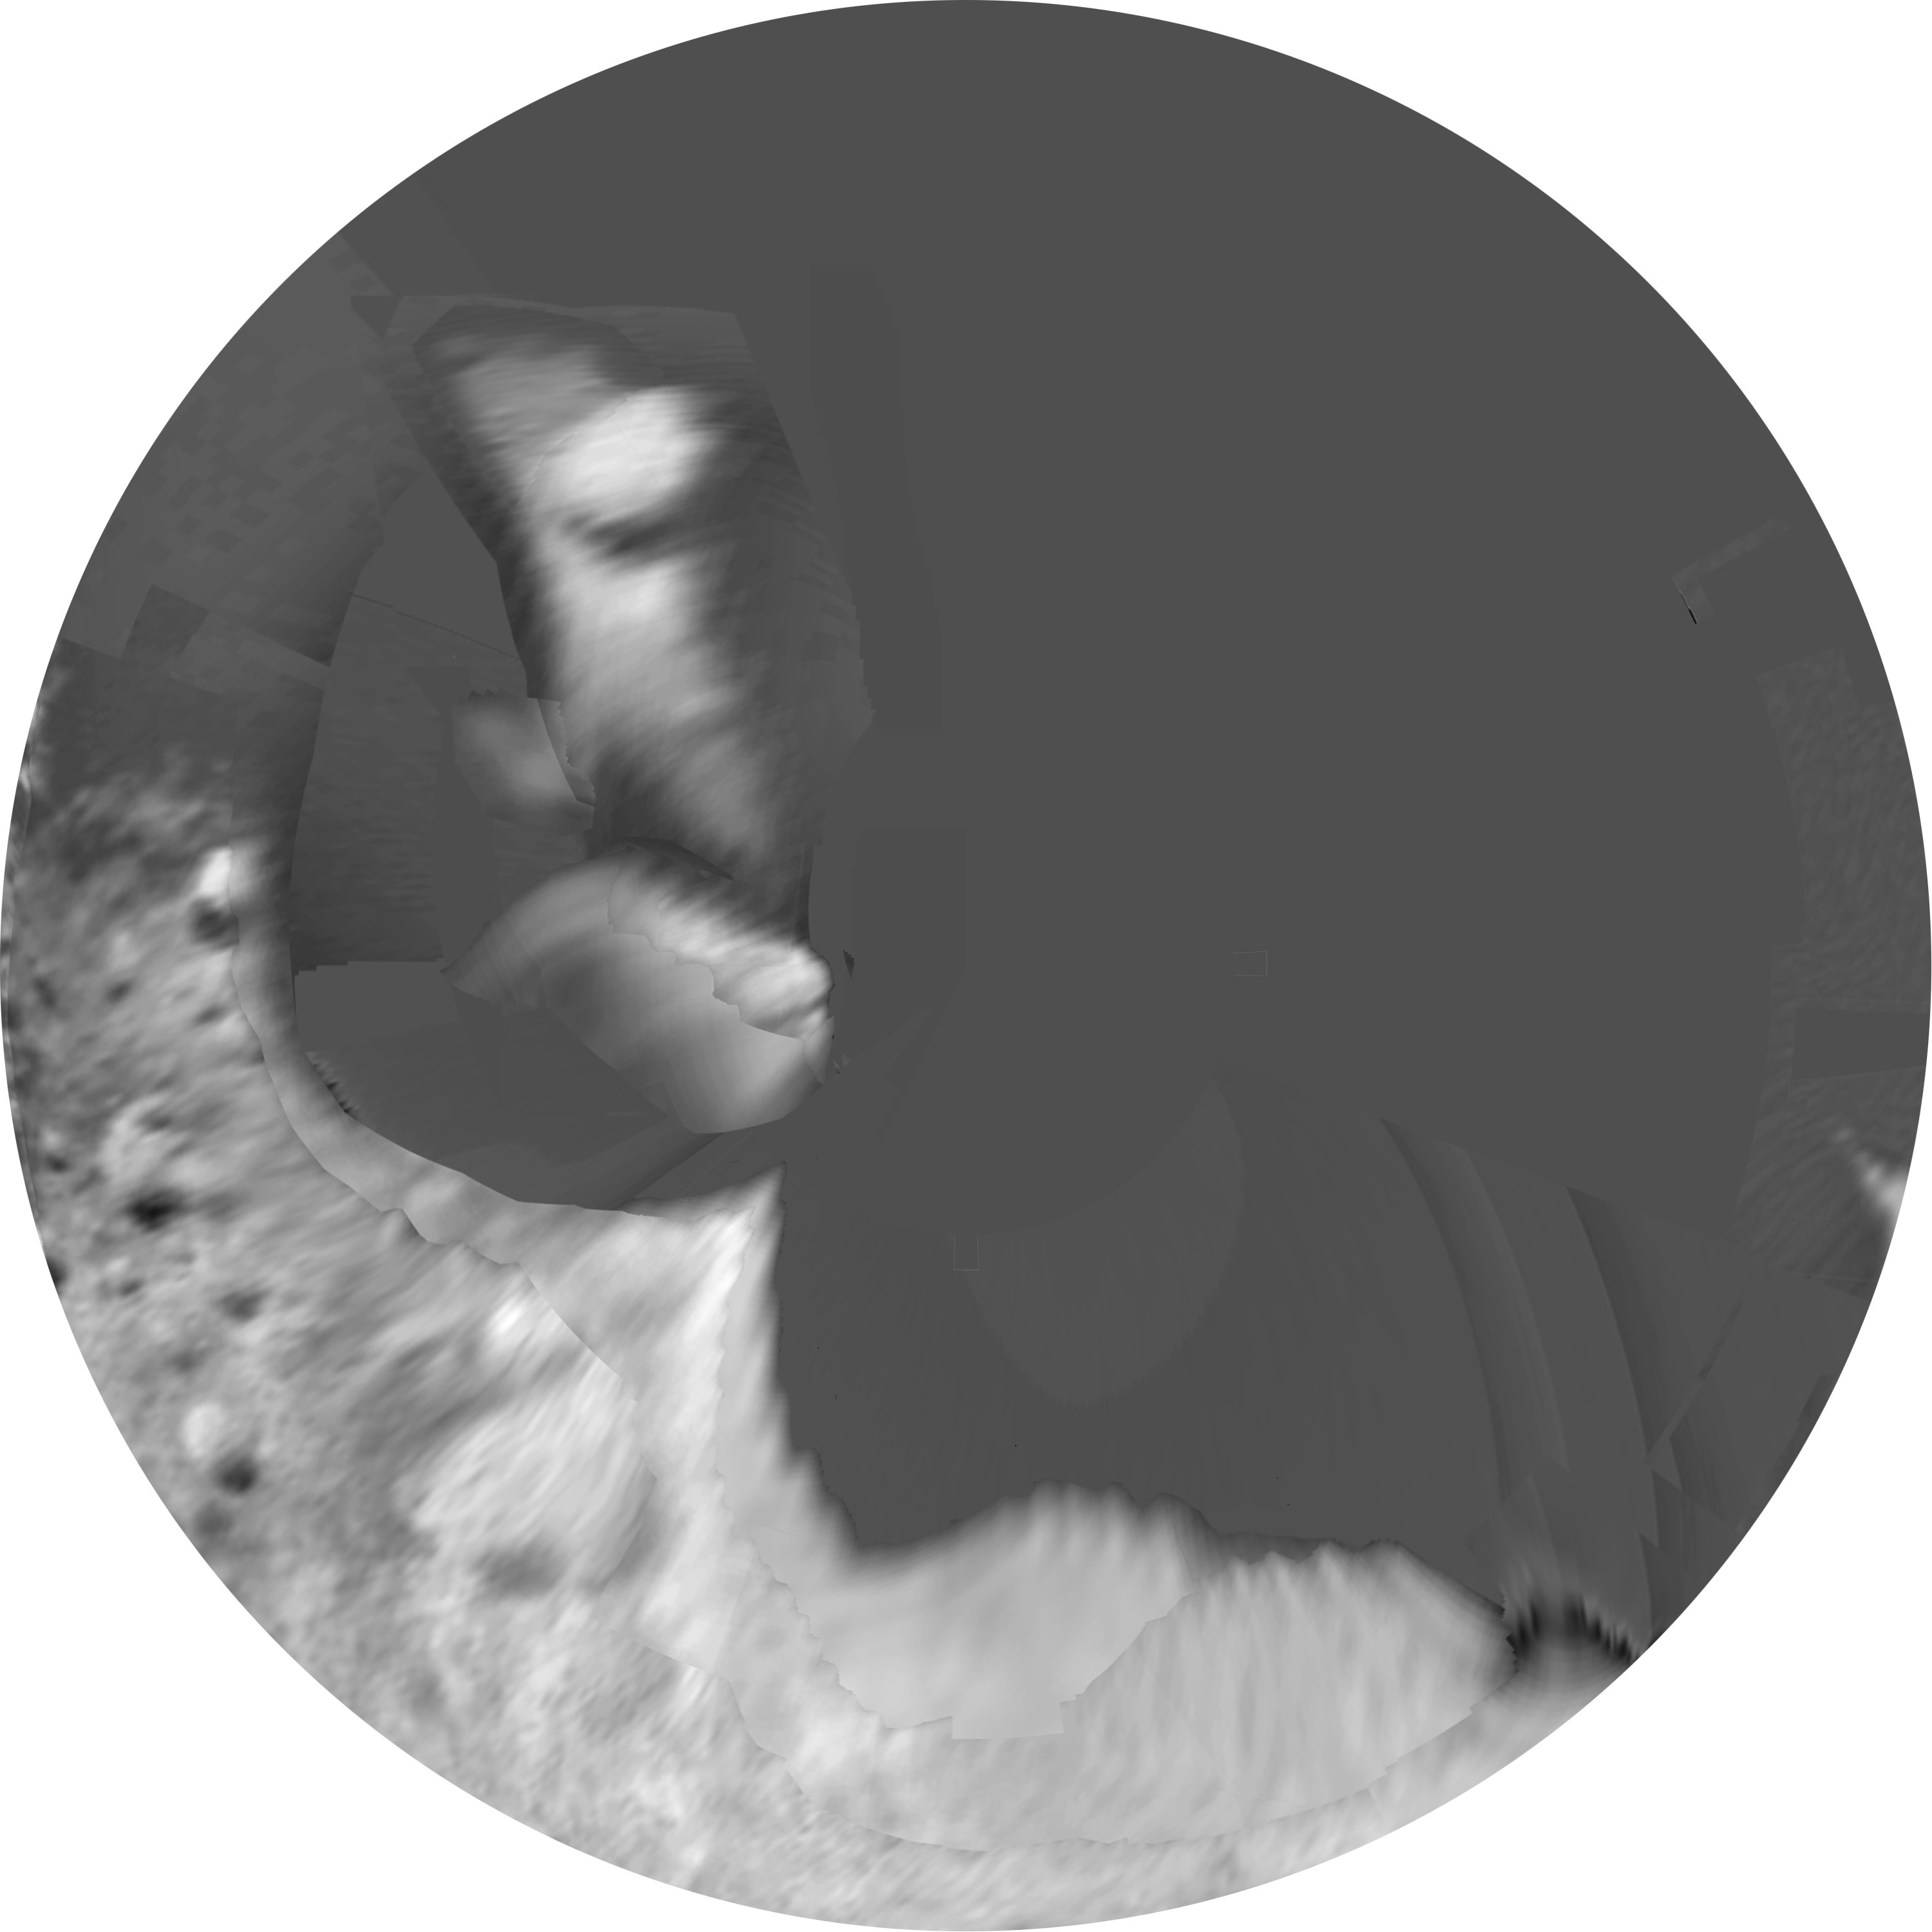
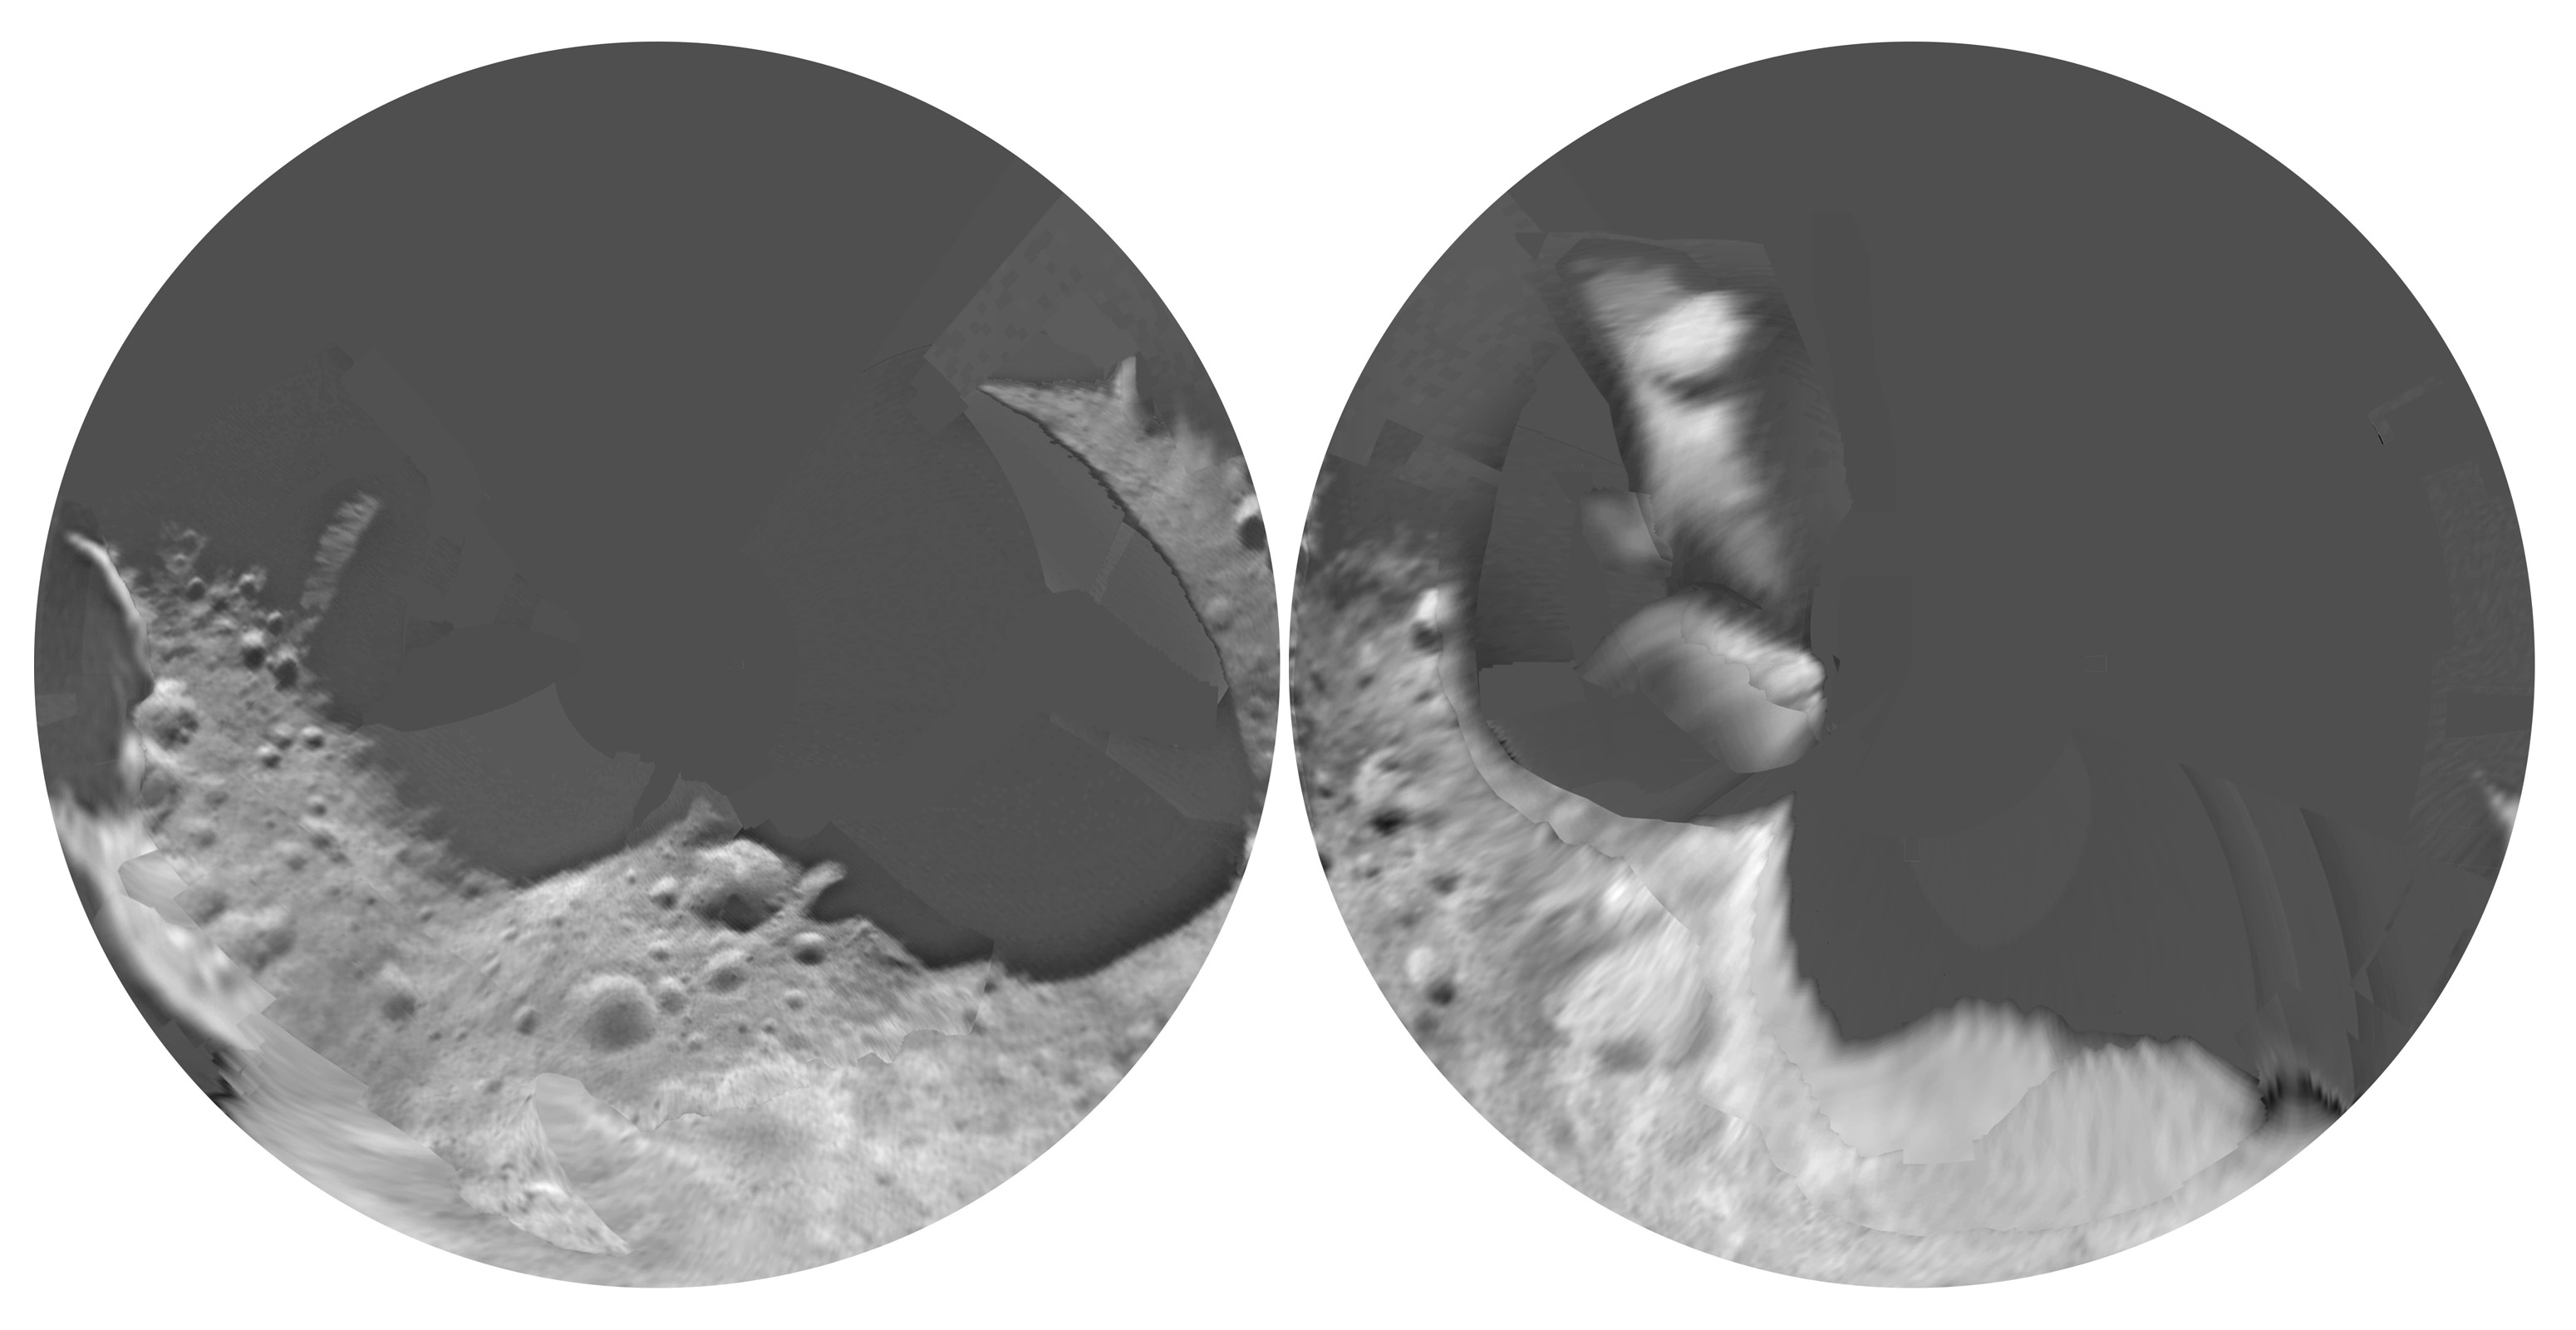
Morphographic Conformal Projections. As above, but the mosaic is projected
onto the 3D convex hull of the shape model to suggest the approximate shape.
Only the illuminated hemisphere was mapped in this way because of the
nature of the image coverage. Six versions are offered: all are conformal
(effectively = stereographic) projections of the convex hull, but centered
on the equator at longitudes 90, 180, and 270 degrees, with and without
grids. The grids are not labelled, but may be compared with the gridded
quadrangle sheets above.
C. Shaded relief maps. This shaded relief drawing by P. Stooke is available
in several projections:
(Morphographic conformal projection is the relief drawing projected onto
the 3D convex hull of the shape, then reprojected to morphgraphic
conformal (effectively stereographic) projection, in three hemispheres
centered on the equator and longitudes 90, 180, and 270 degrees.
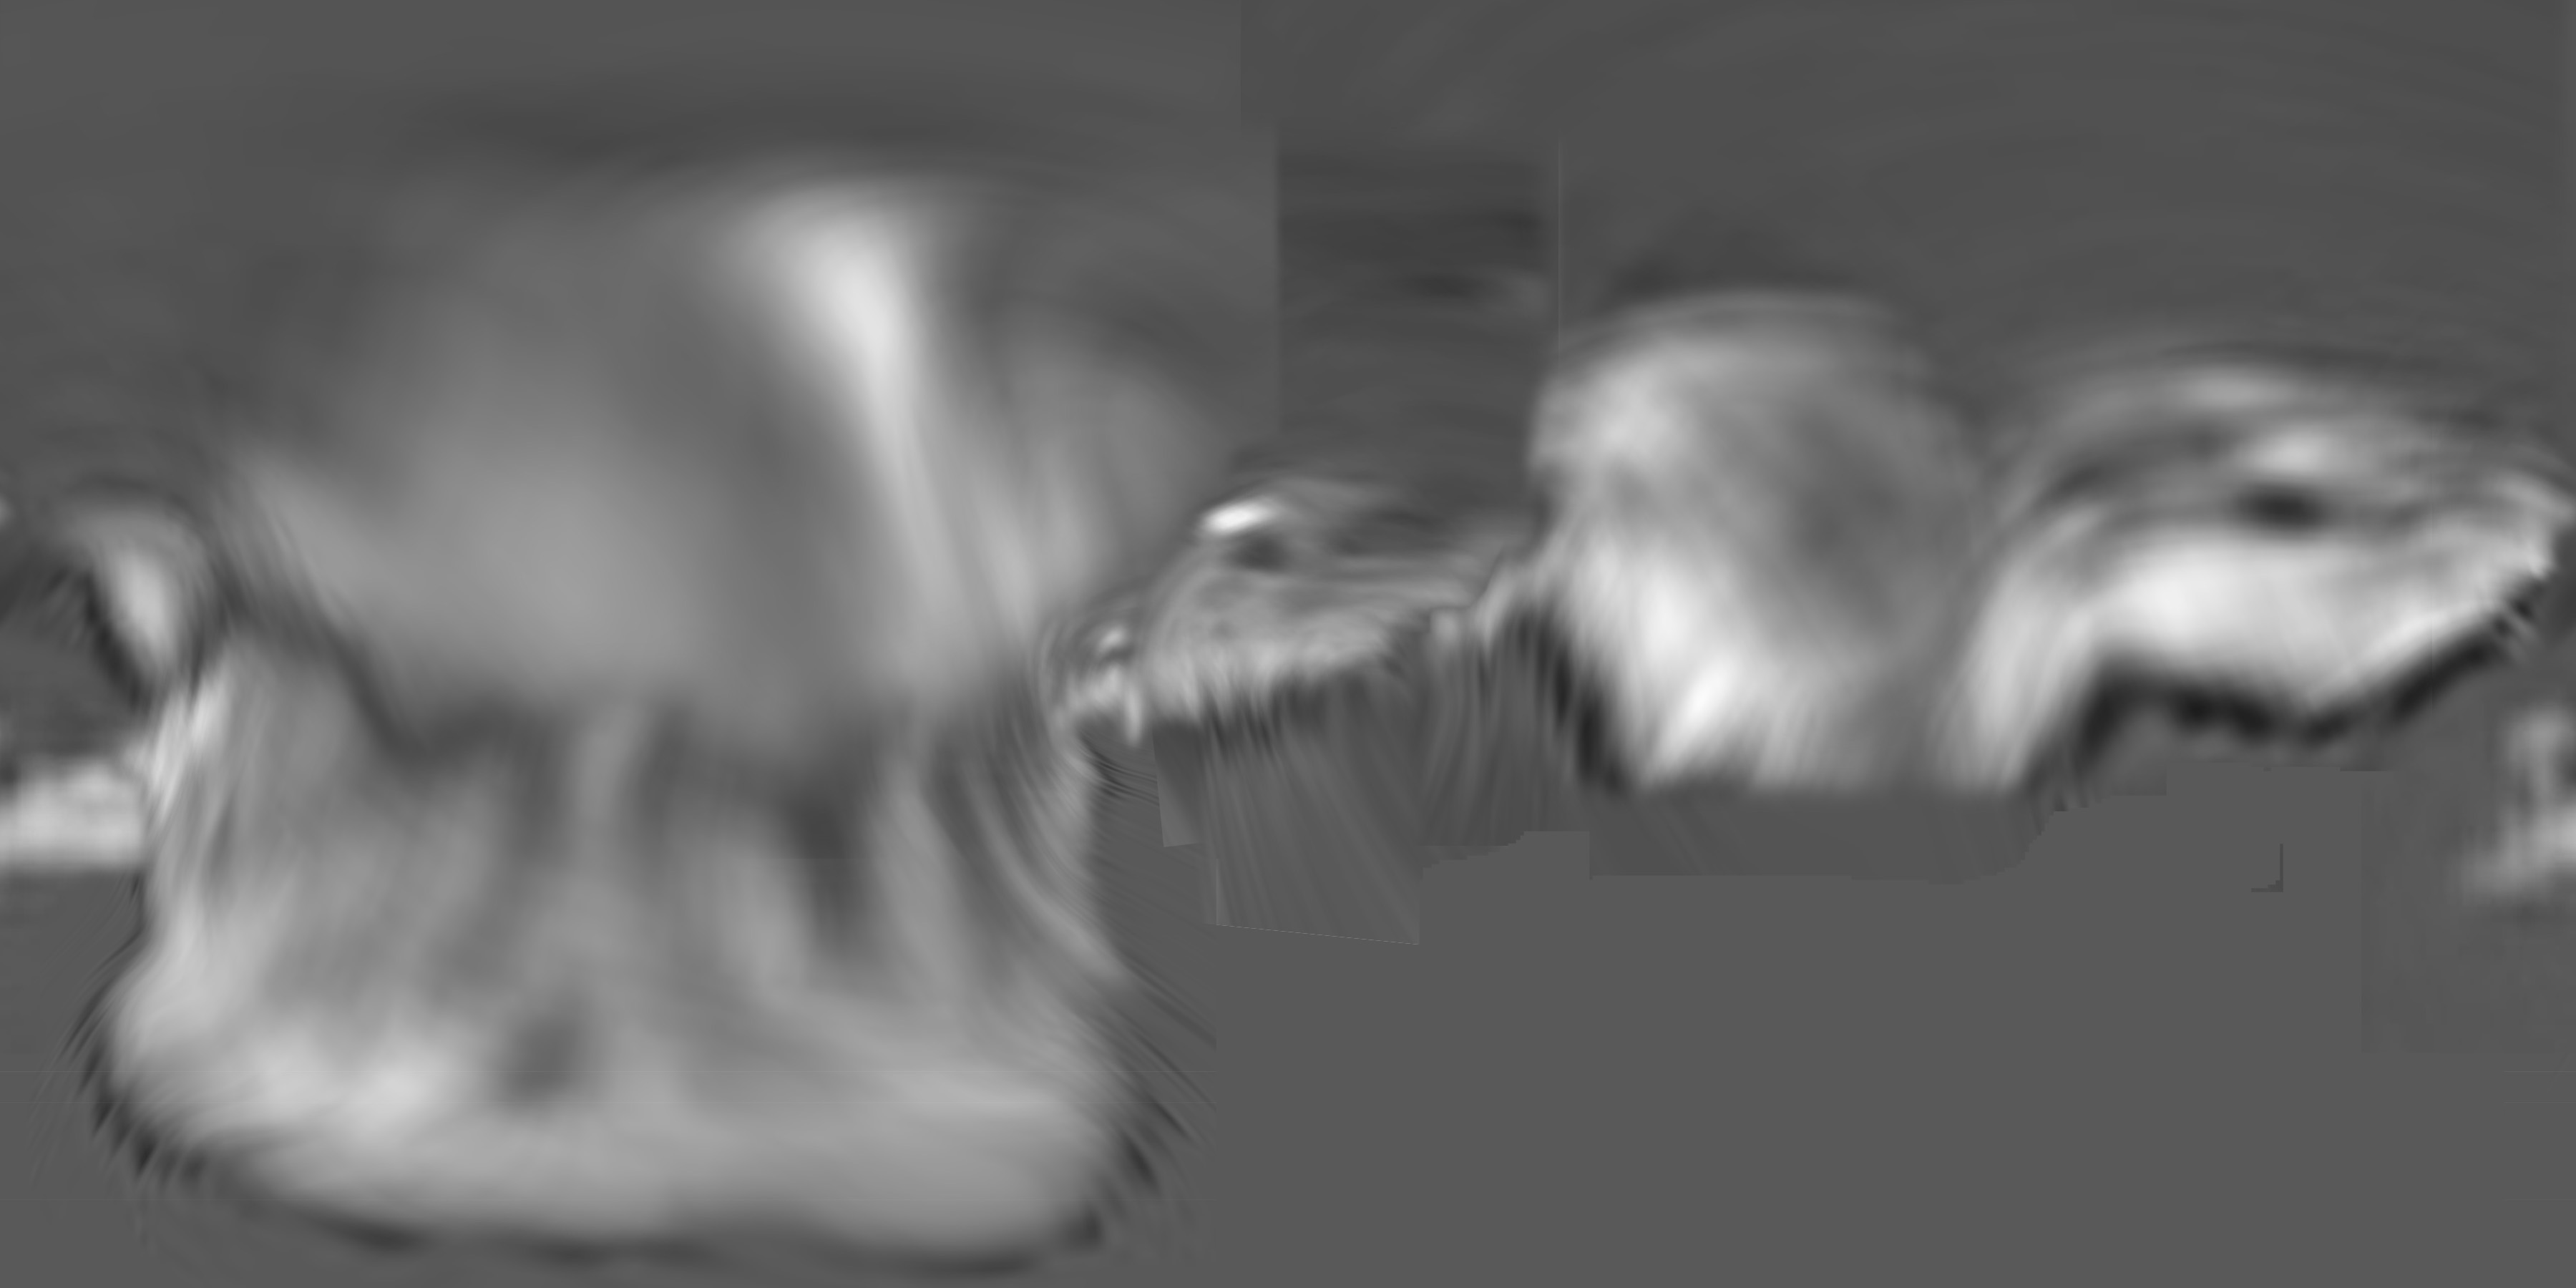
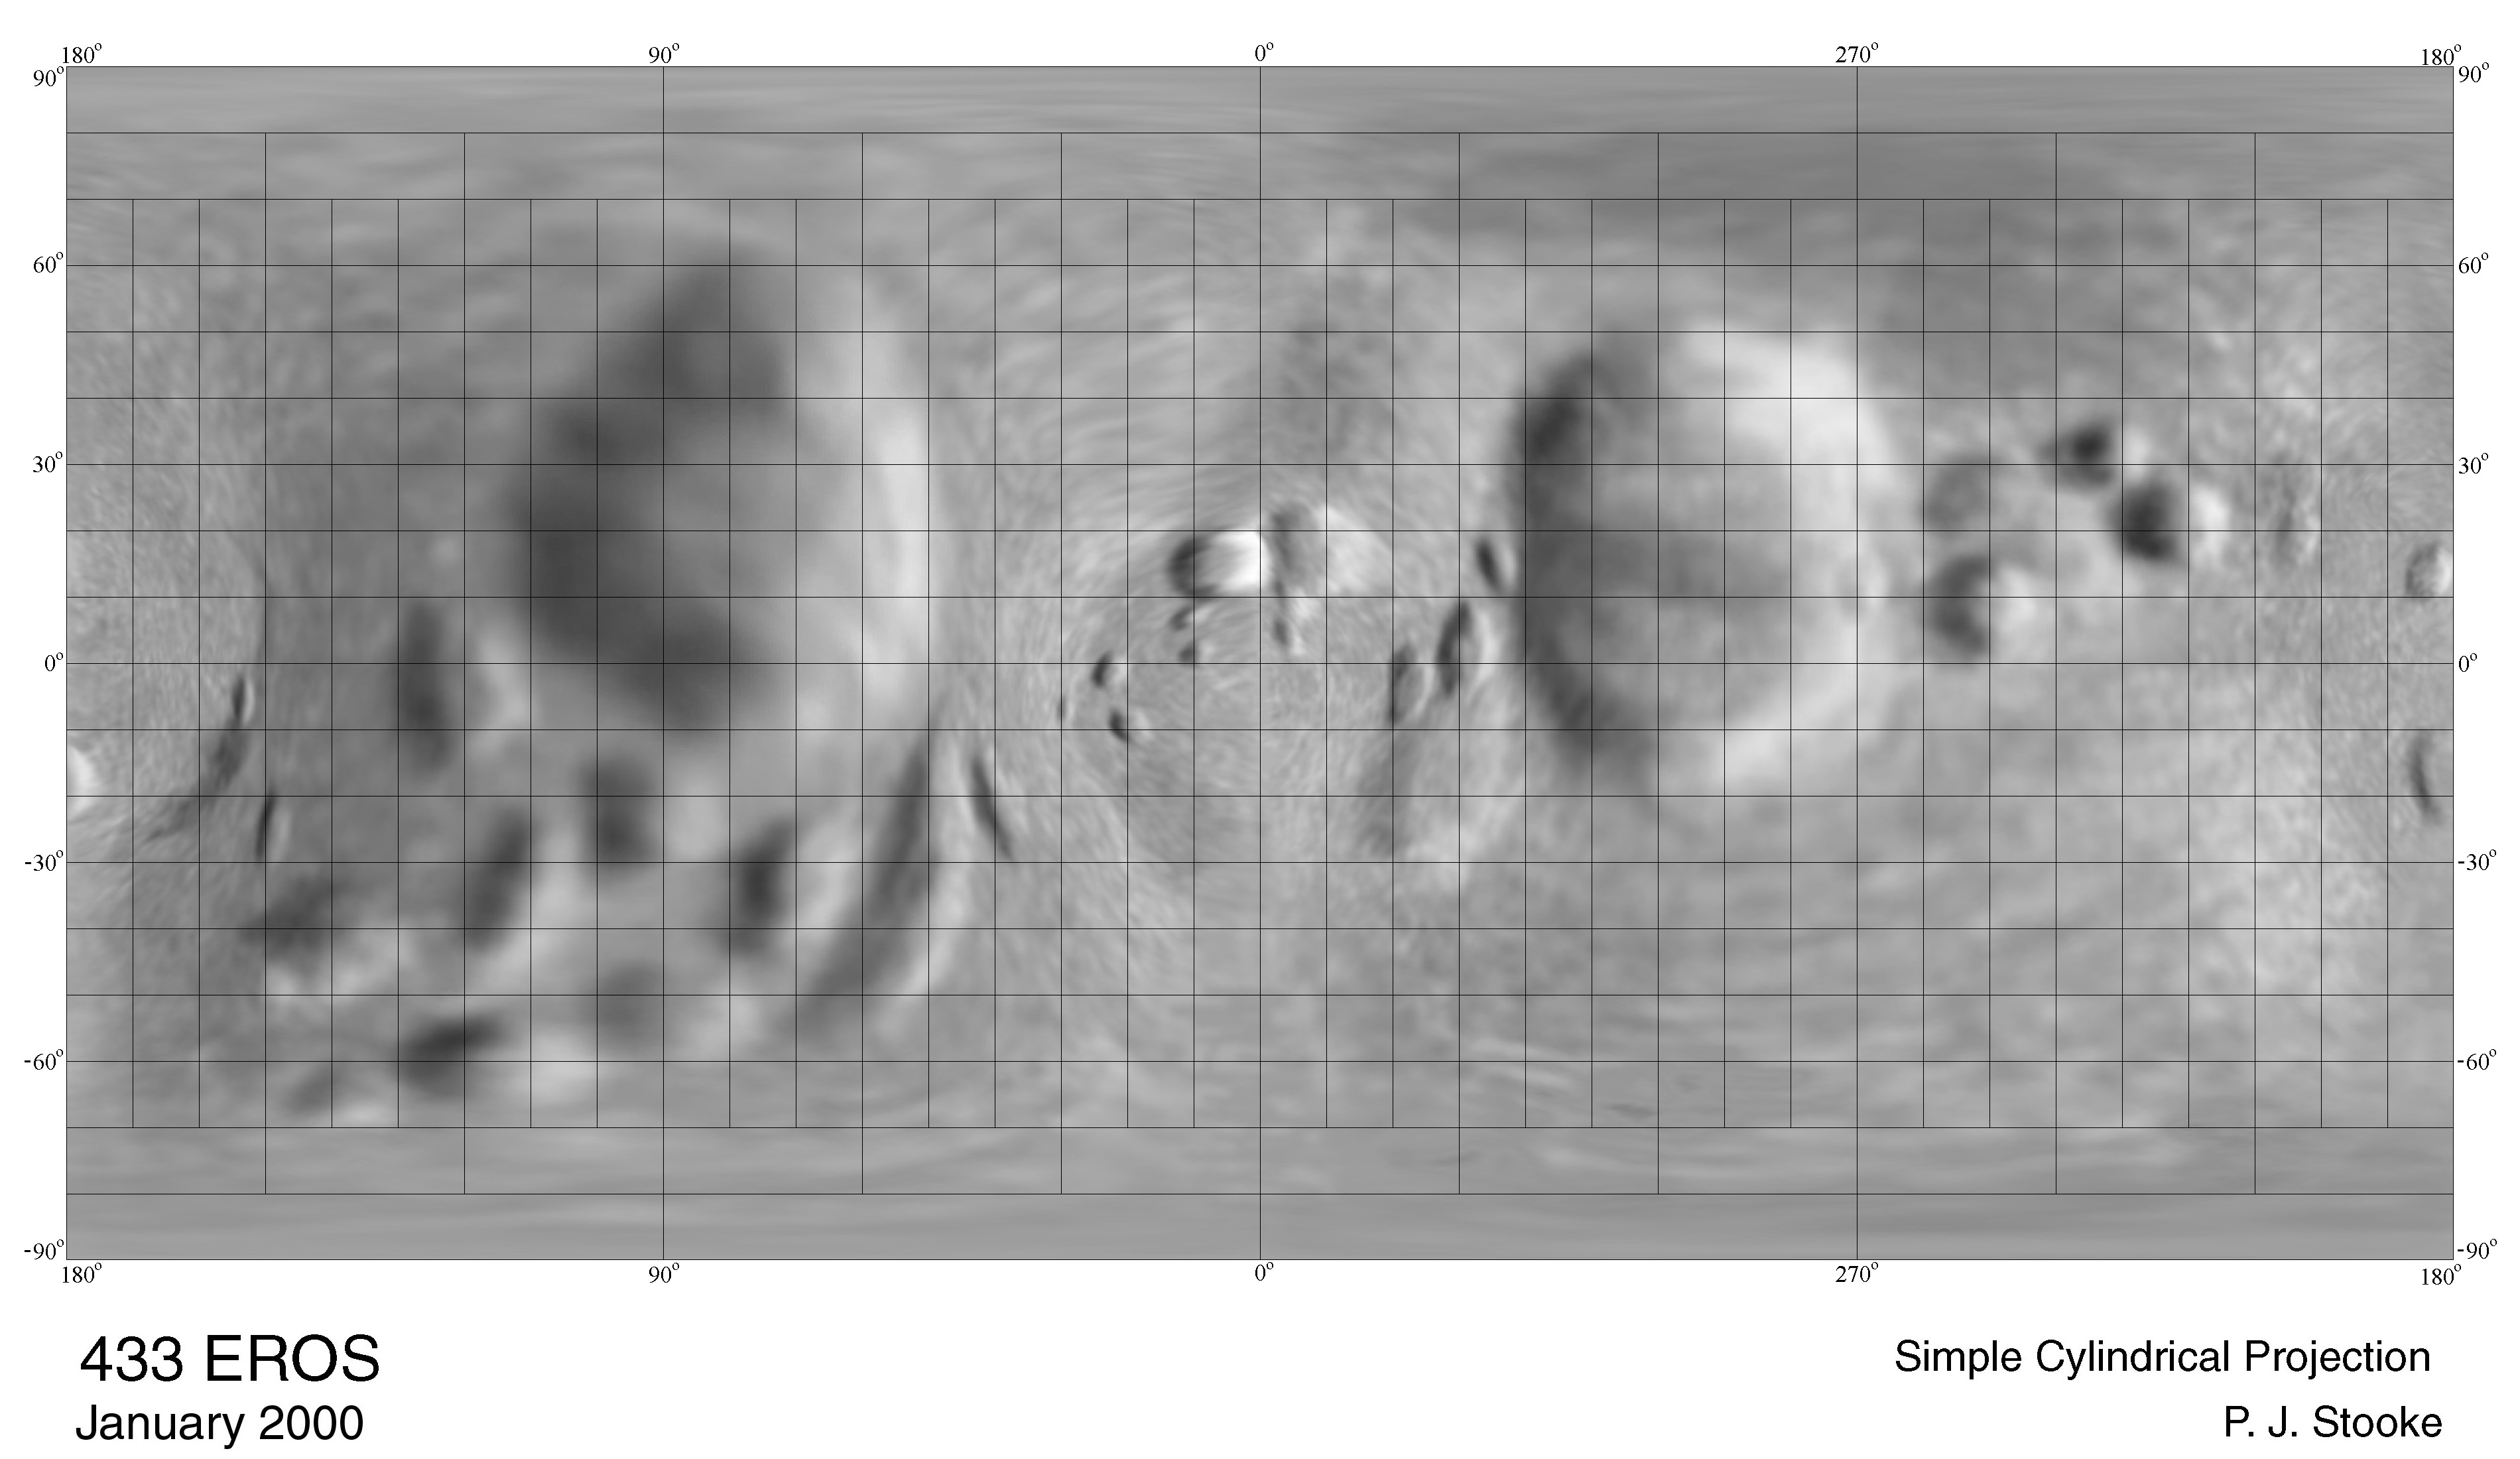
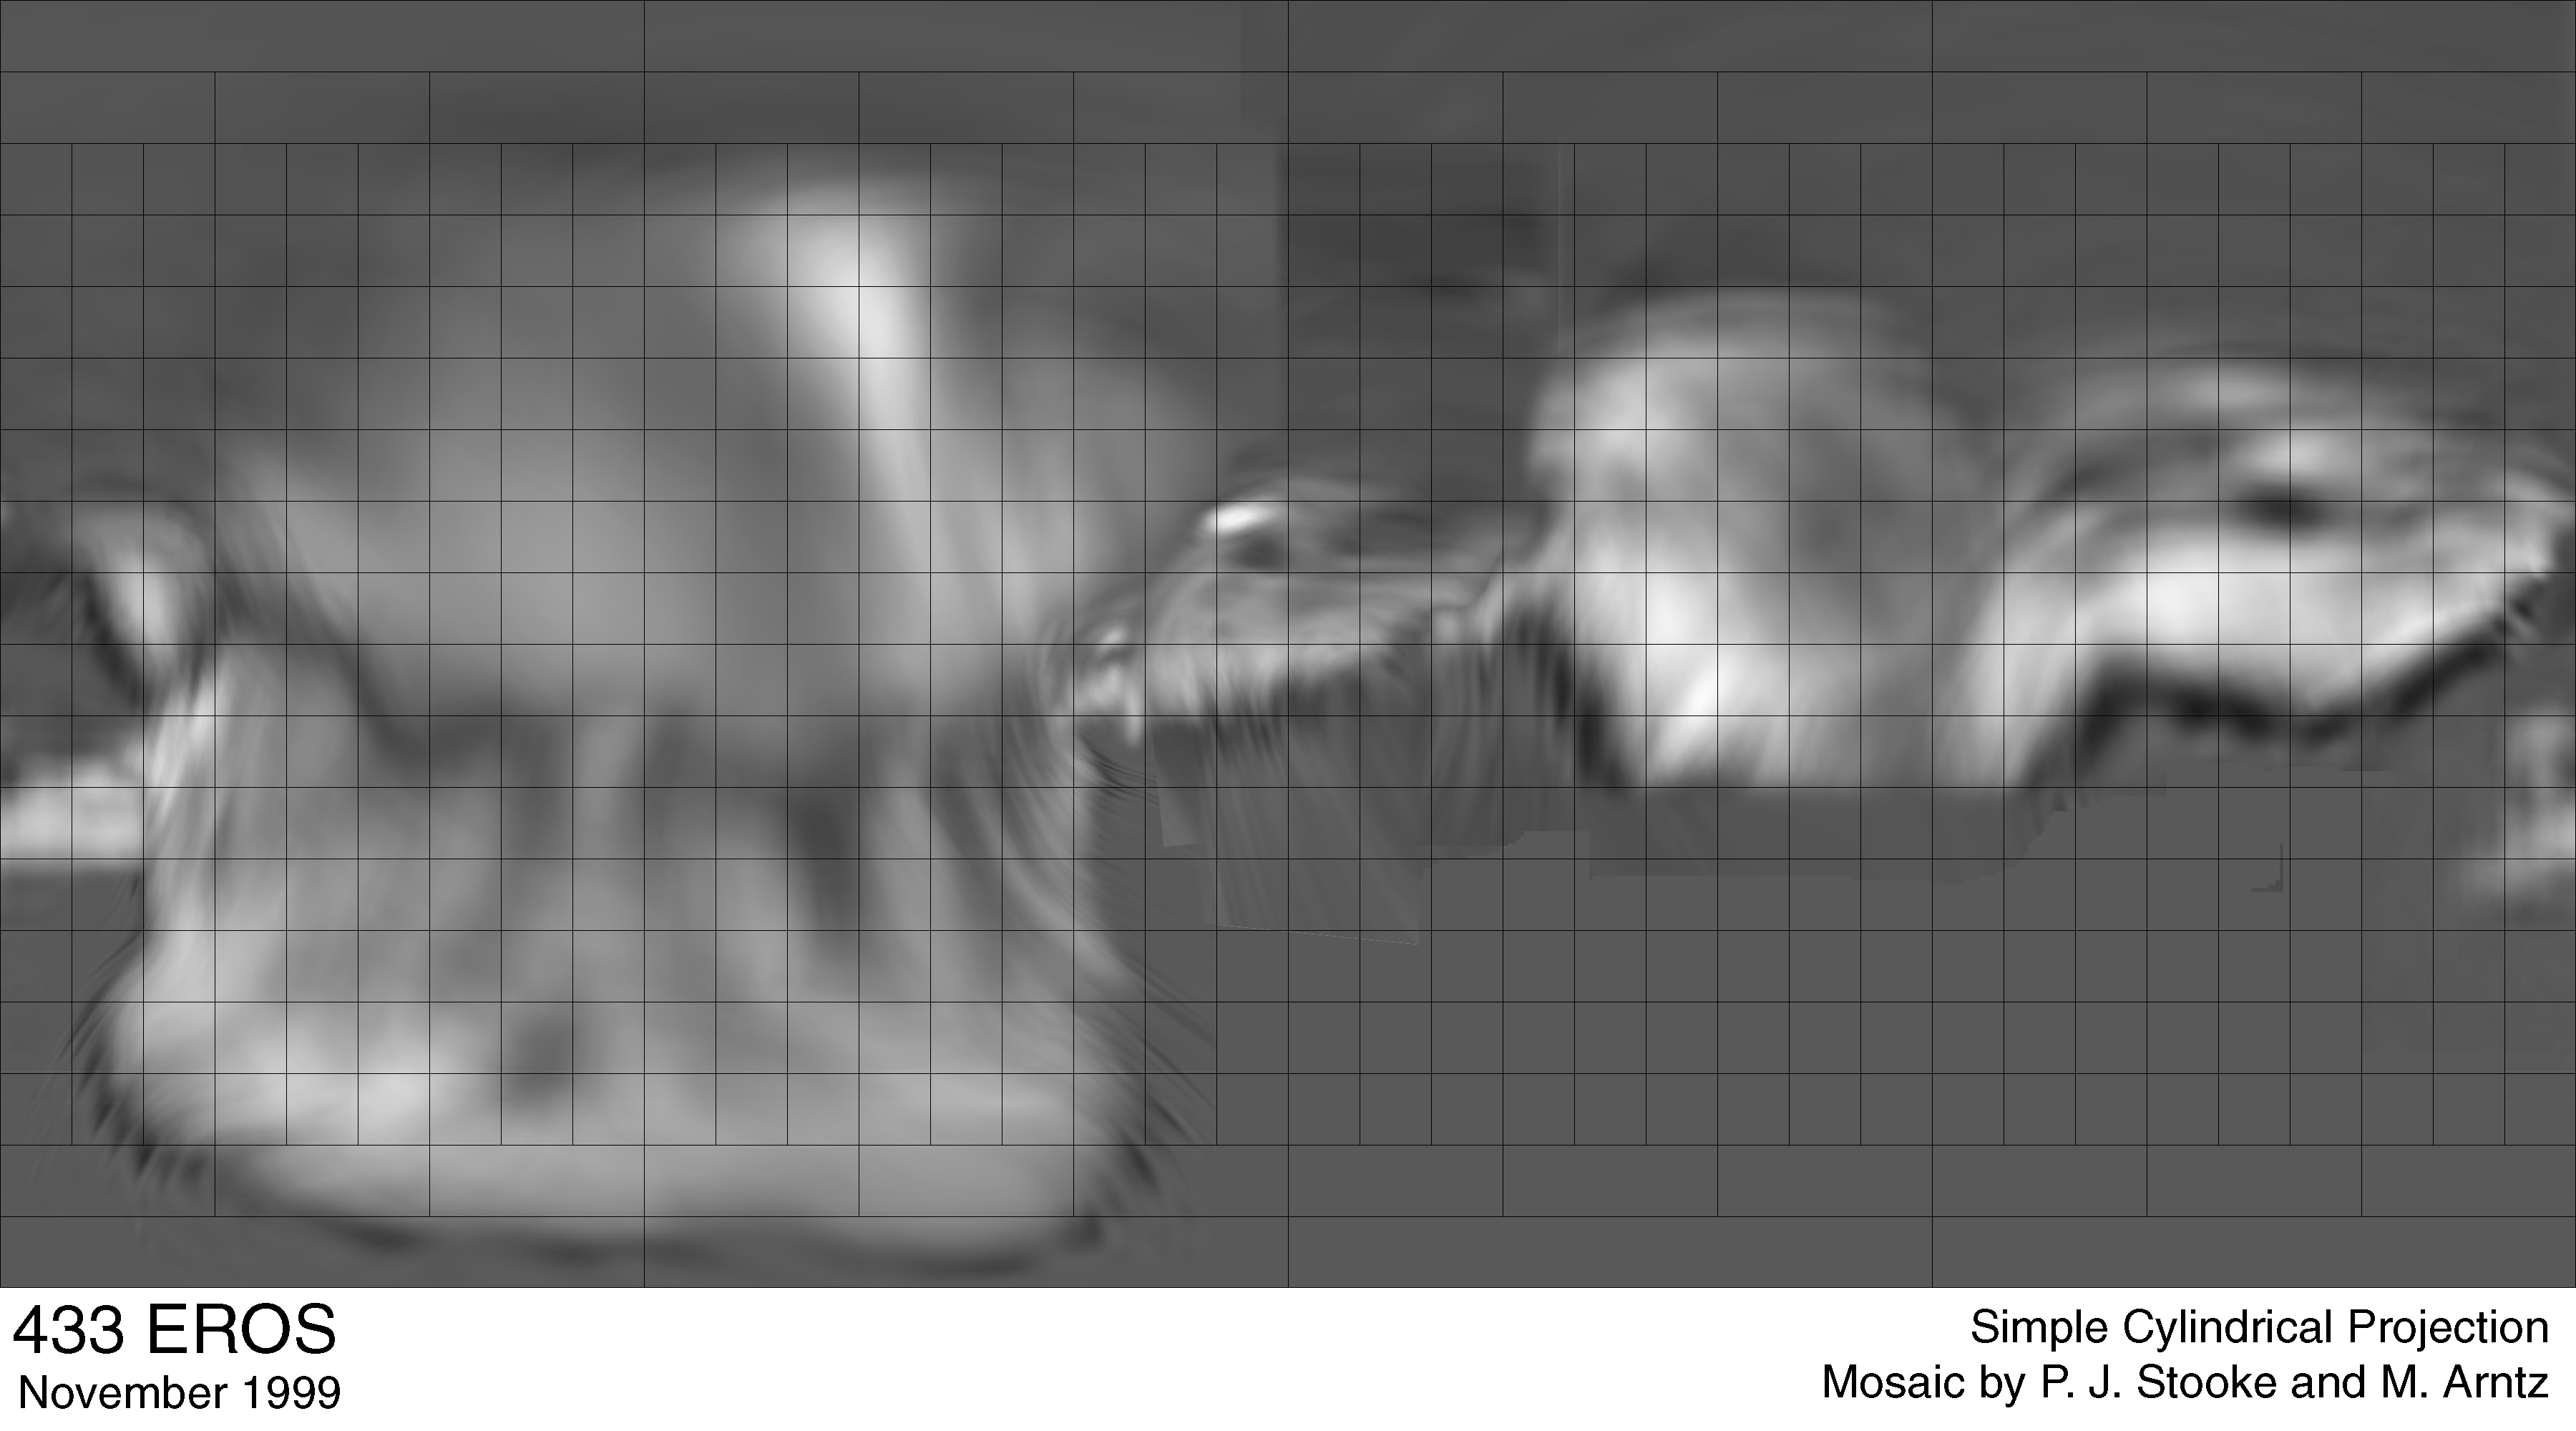
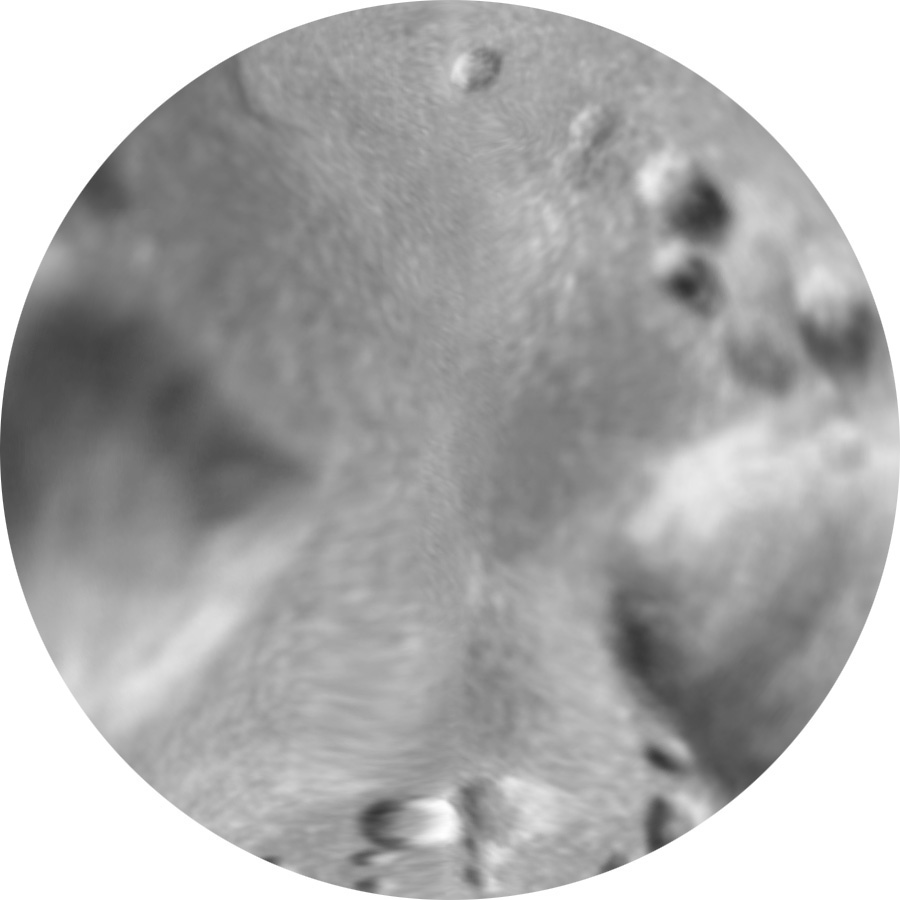
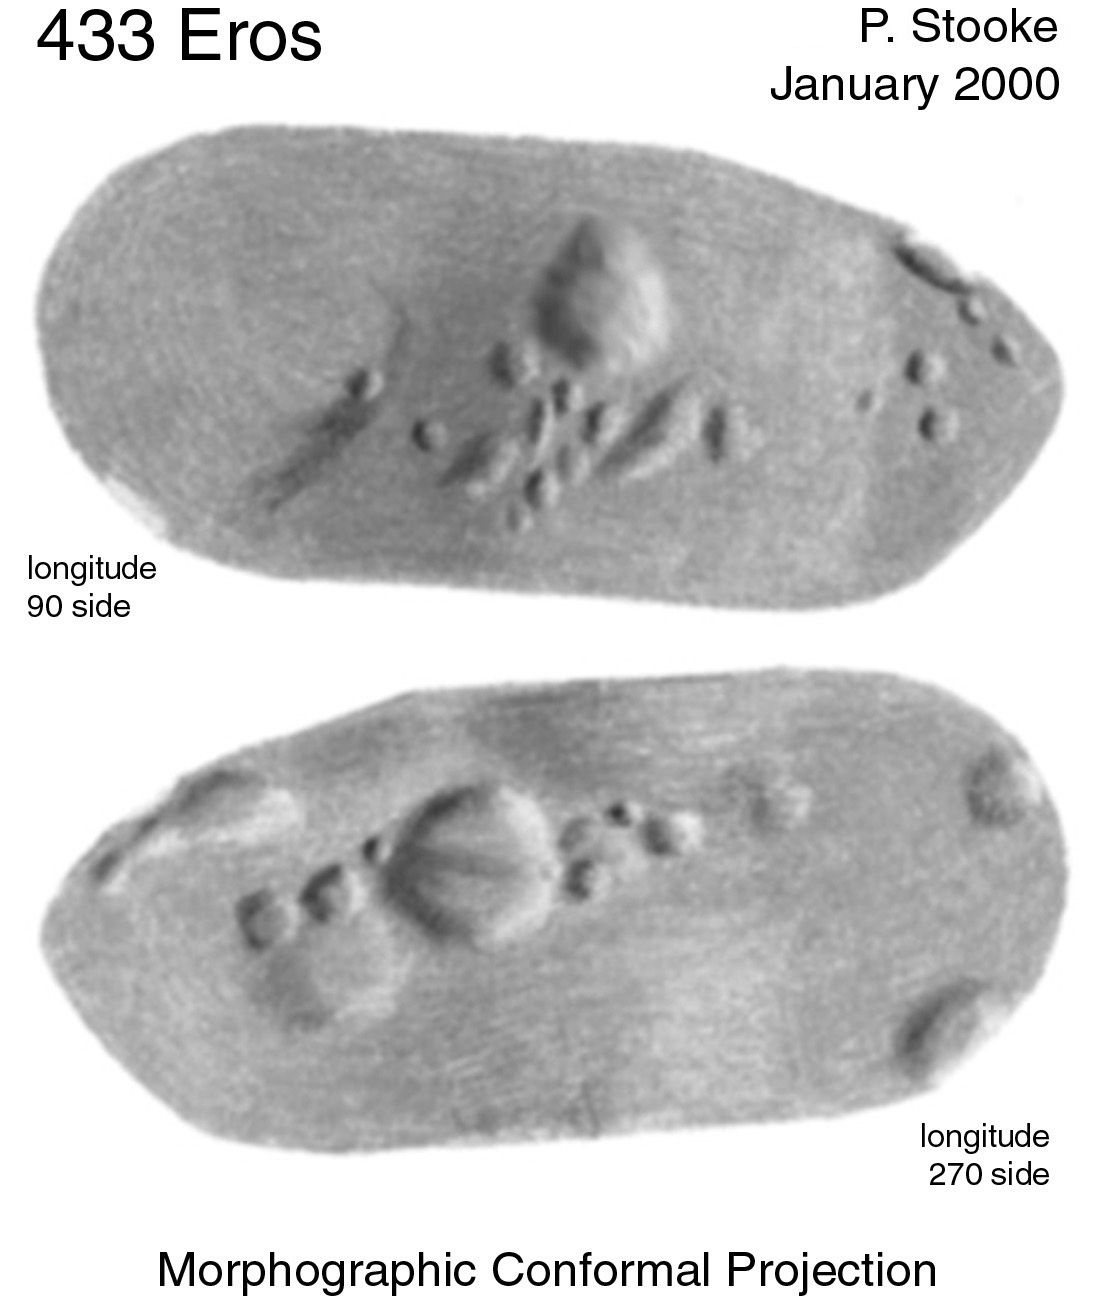
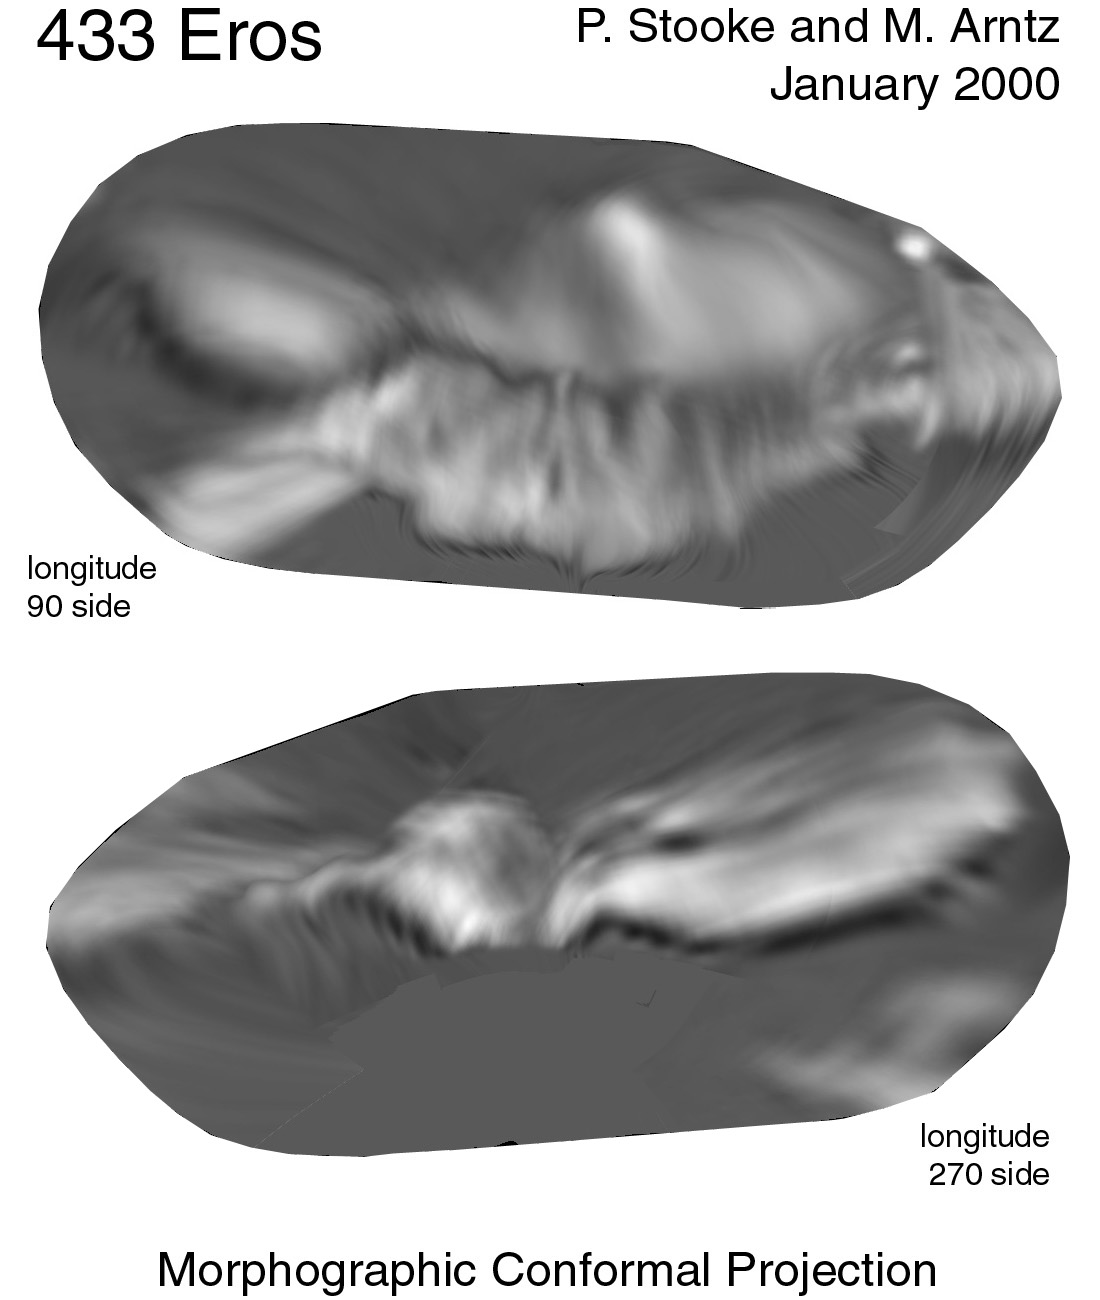
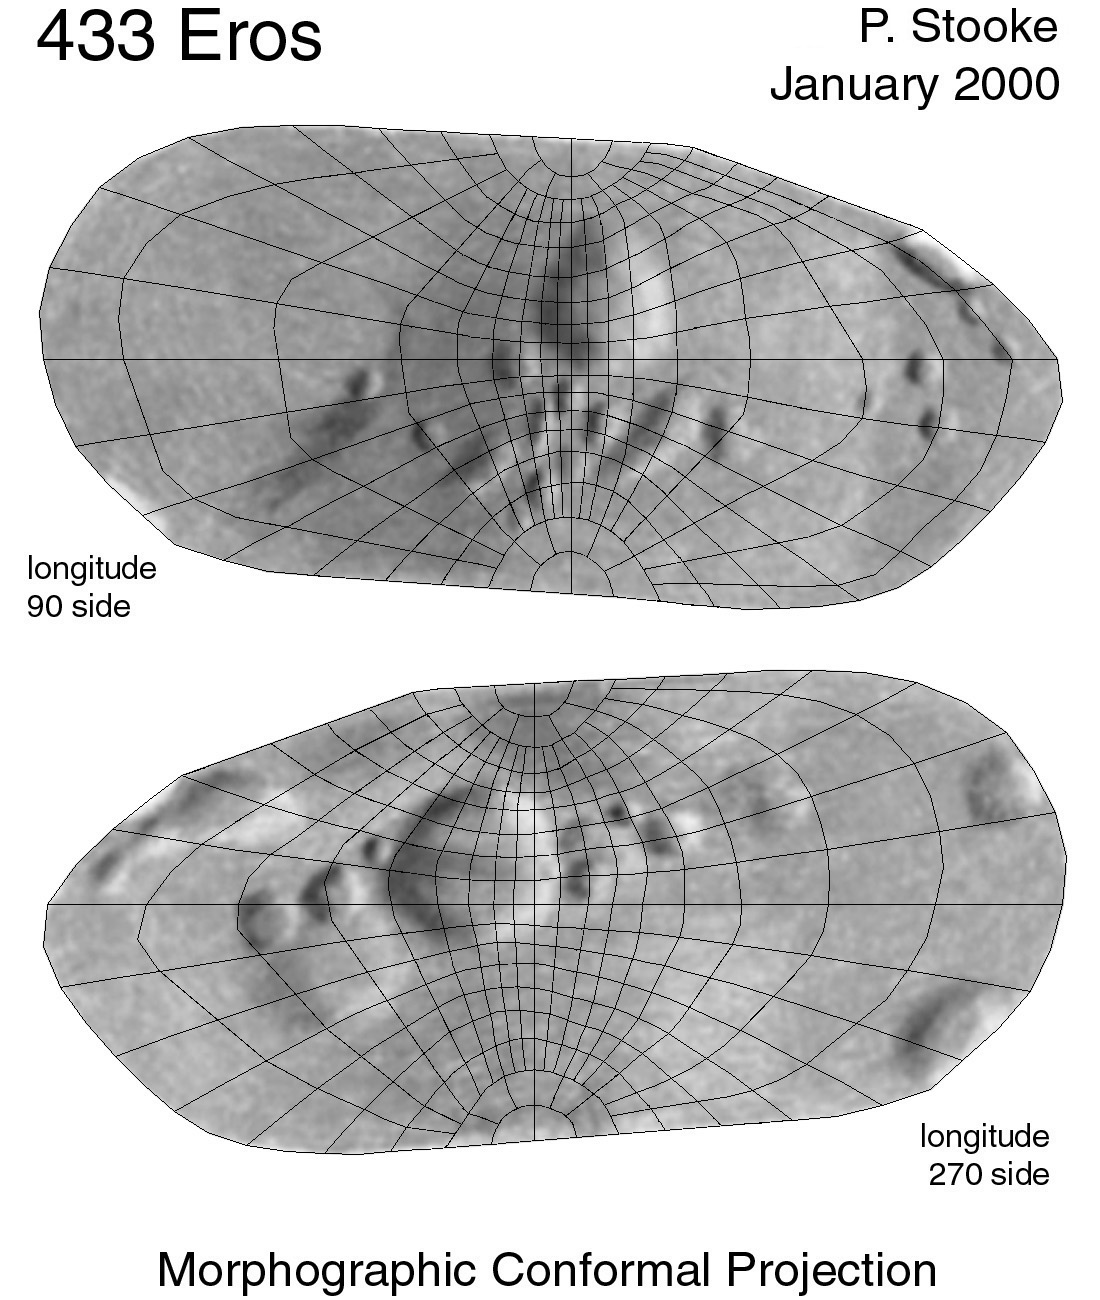
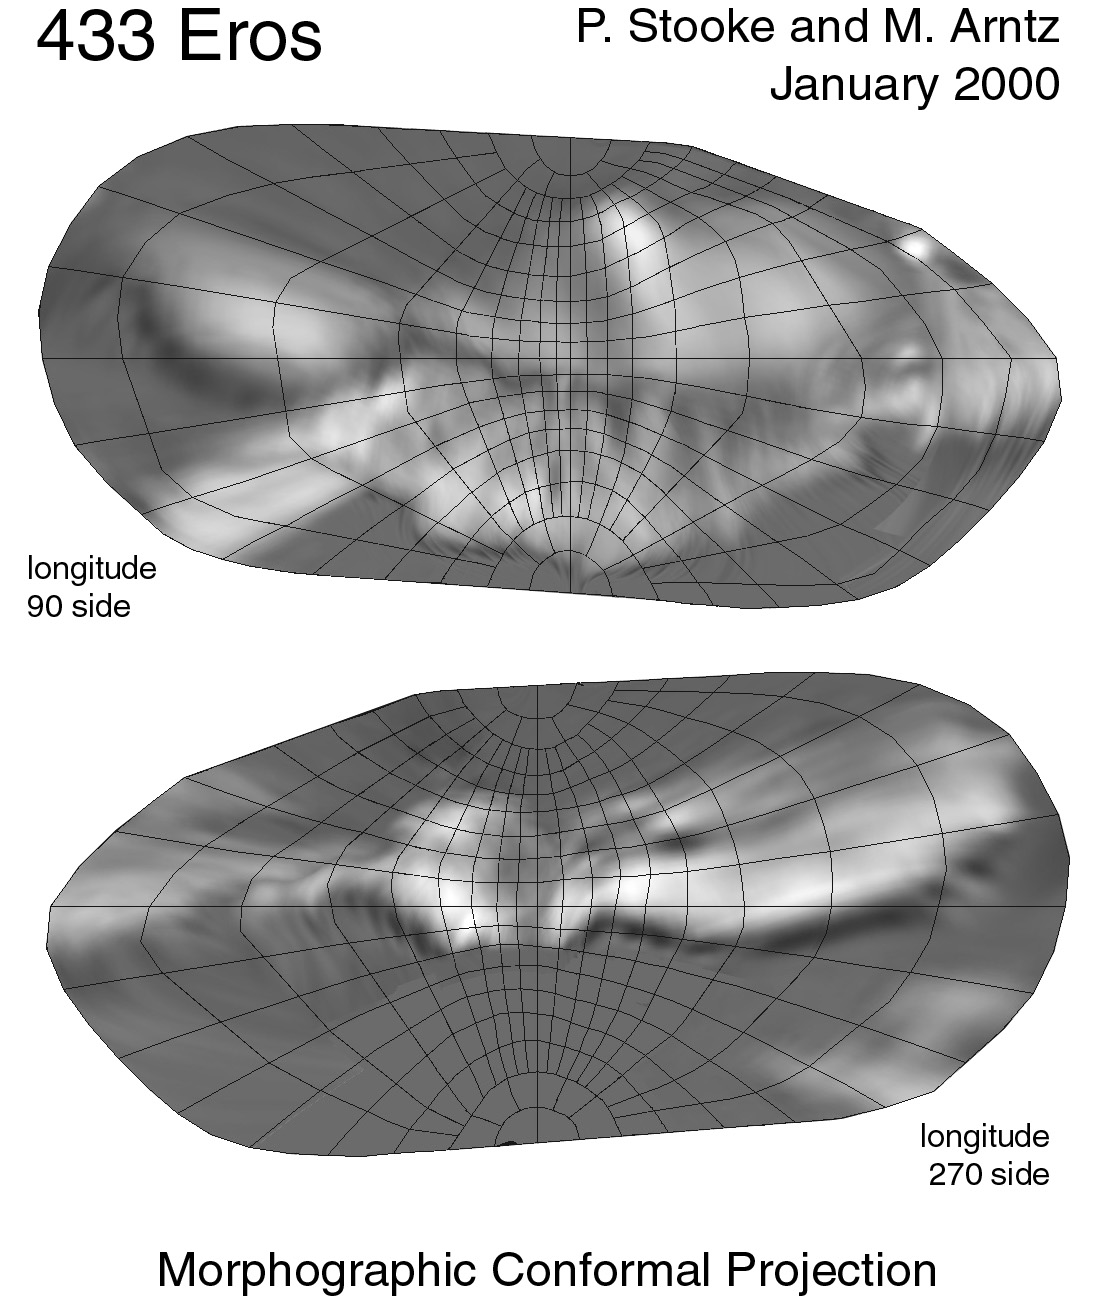
433 Eros
Maps prepared from the NEAR flyby images. They are probably of
historical value only. Maps based on the NEAR rendezvous images
of Eros are not yet available.
| Relief Maps | Photomosaics |
| Cylindrical
Projection.
| Cylindrical
Projection.
|
| Cylindrical
Projection, with labelled grid.
| Cylindrical
Projection, with labelled grid.
|
| Polar Azimuthal,
north pole.
| Polar Azimuthal,
north pole.
|
| Polar Azimuthal,
south pole.
| Polar Azimuthal,
south pole.
|
| Polar Azimuthal,
both poles.
| Polar Azimuthal,
both poles.
|
| Morphographic
Conformal.
| Morphographic
Conformal.
|
| Morphographic
Conformal, with labelled grid.
| Morphographic
Conformal, with labelled grid.
|
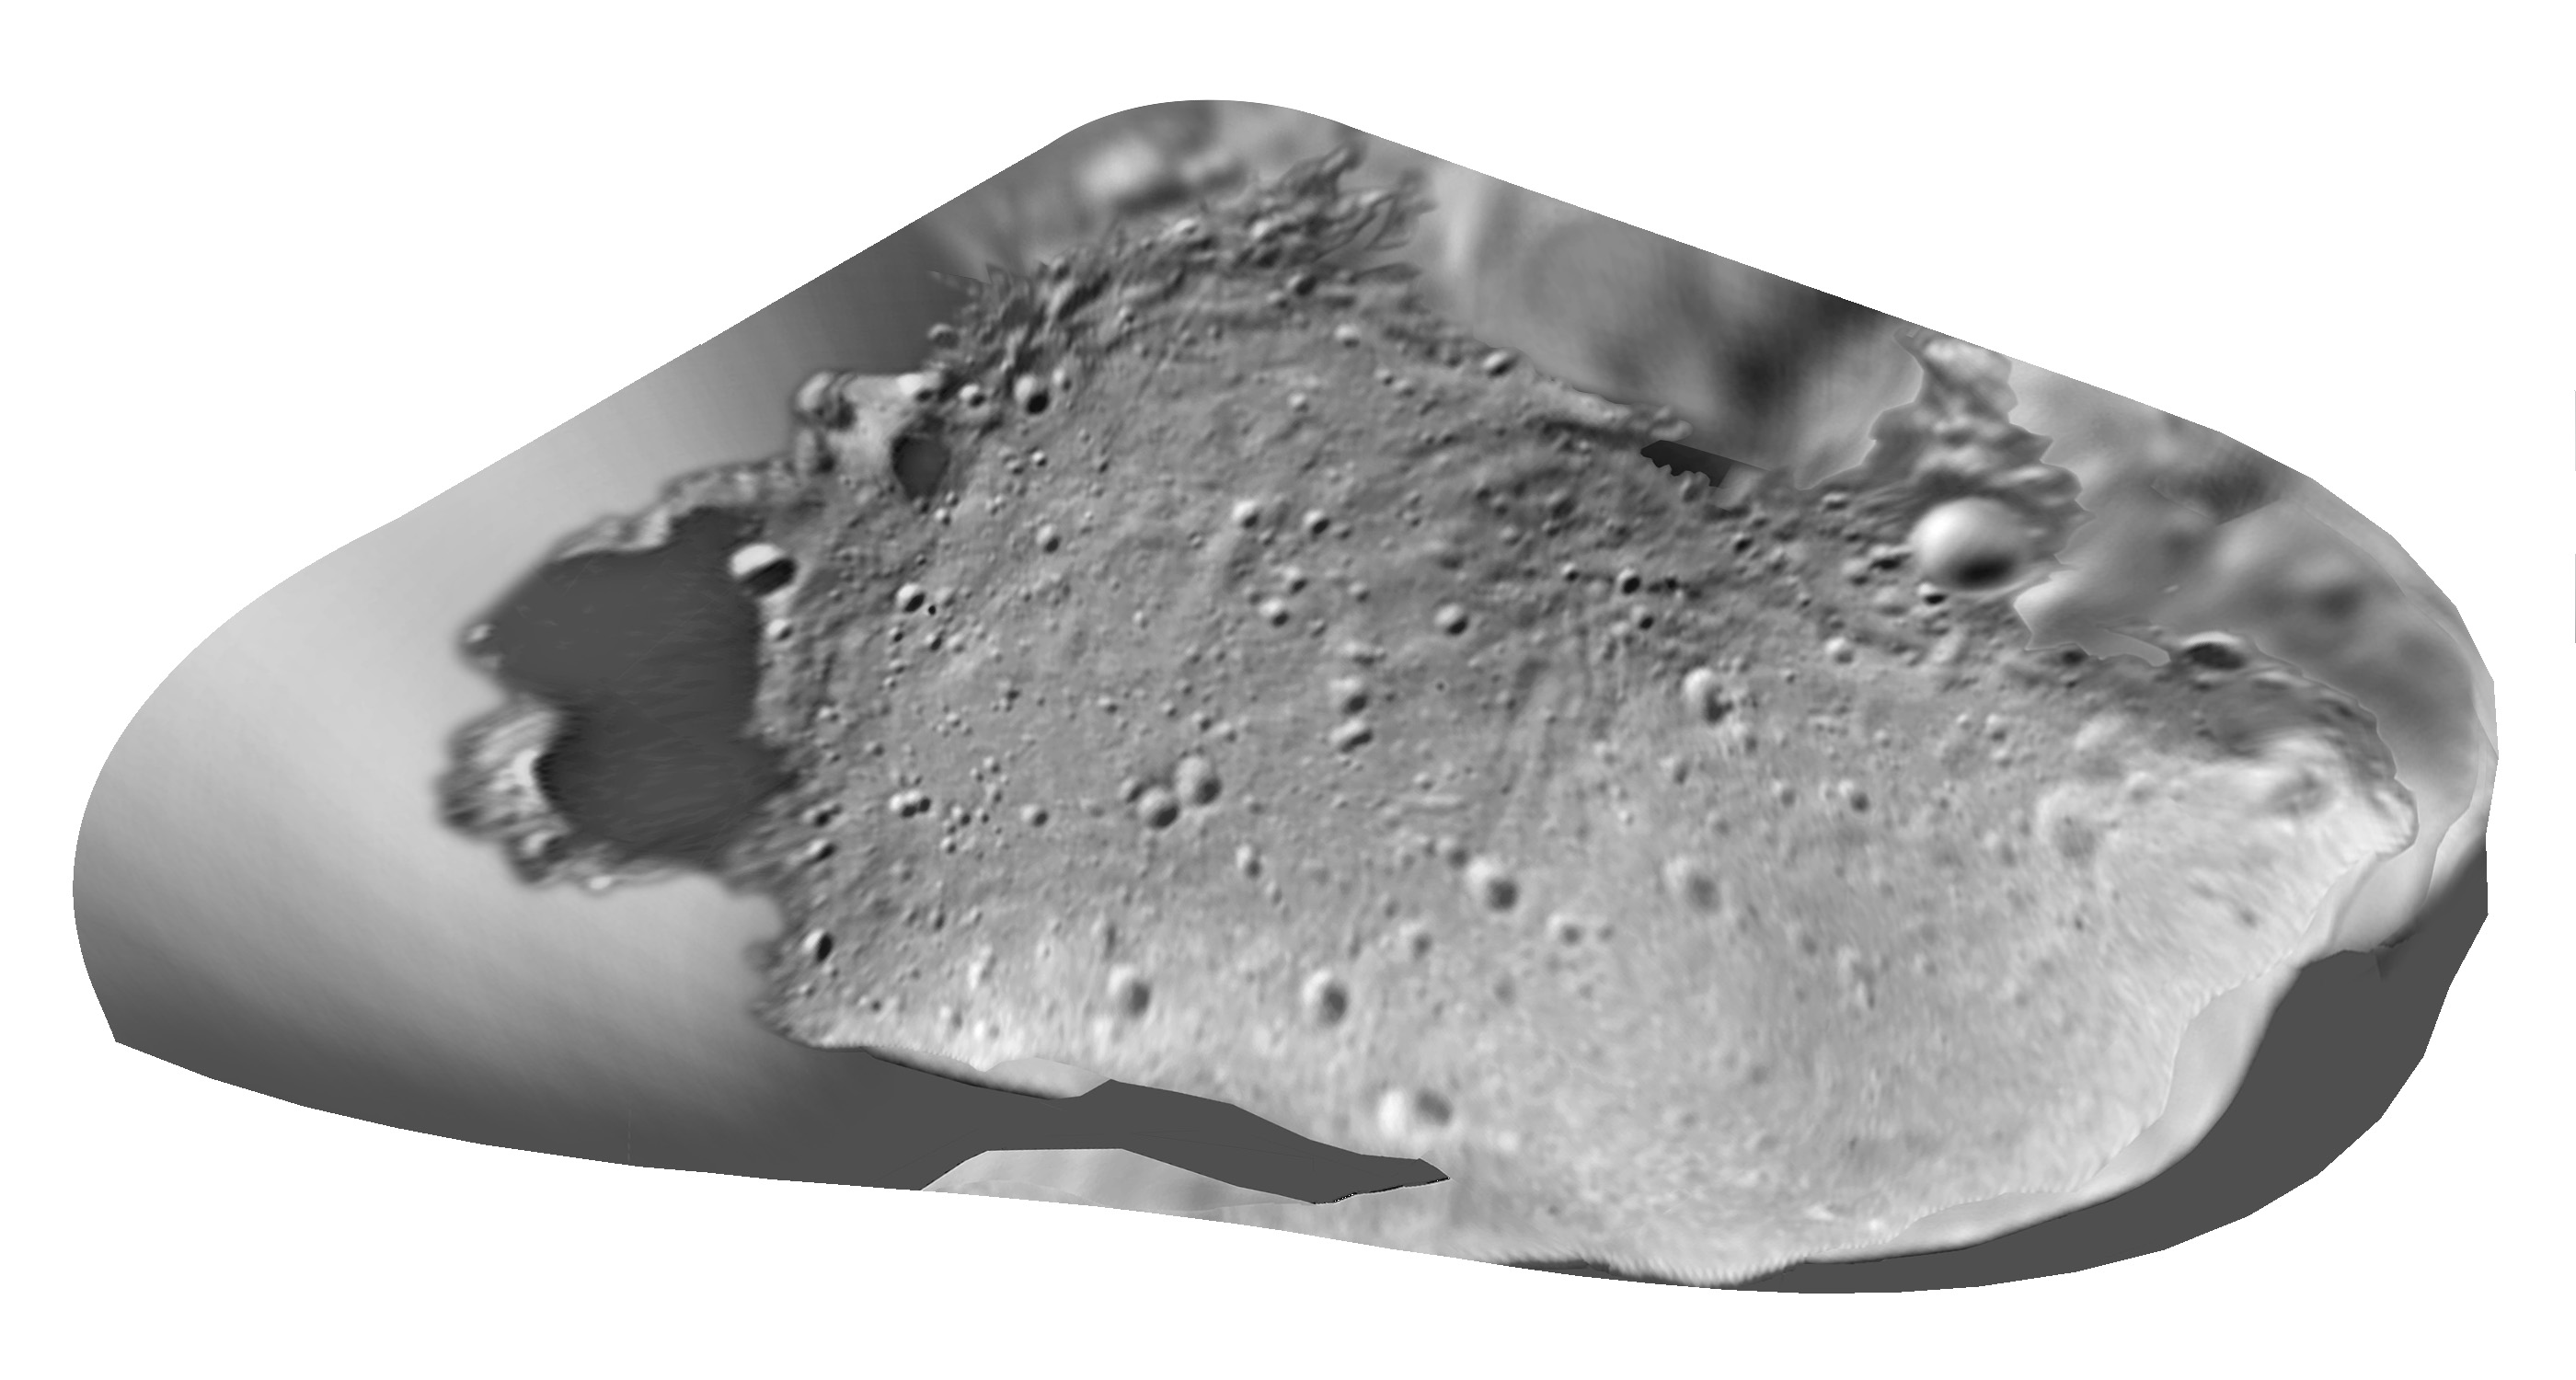
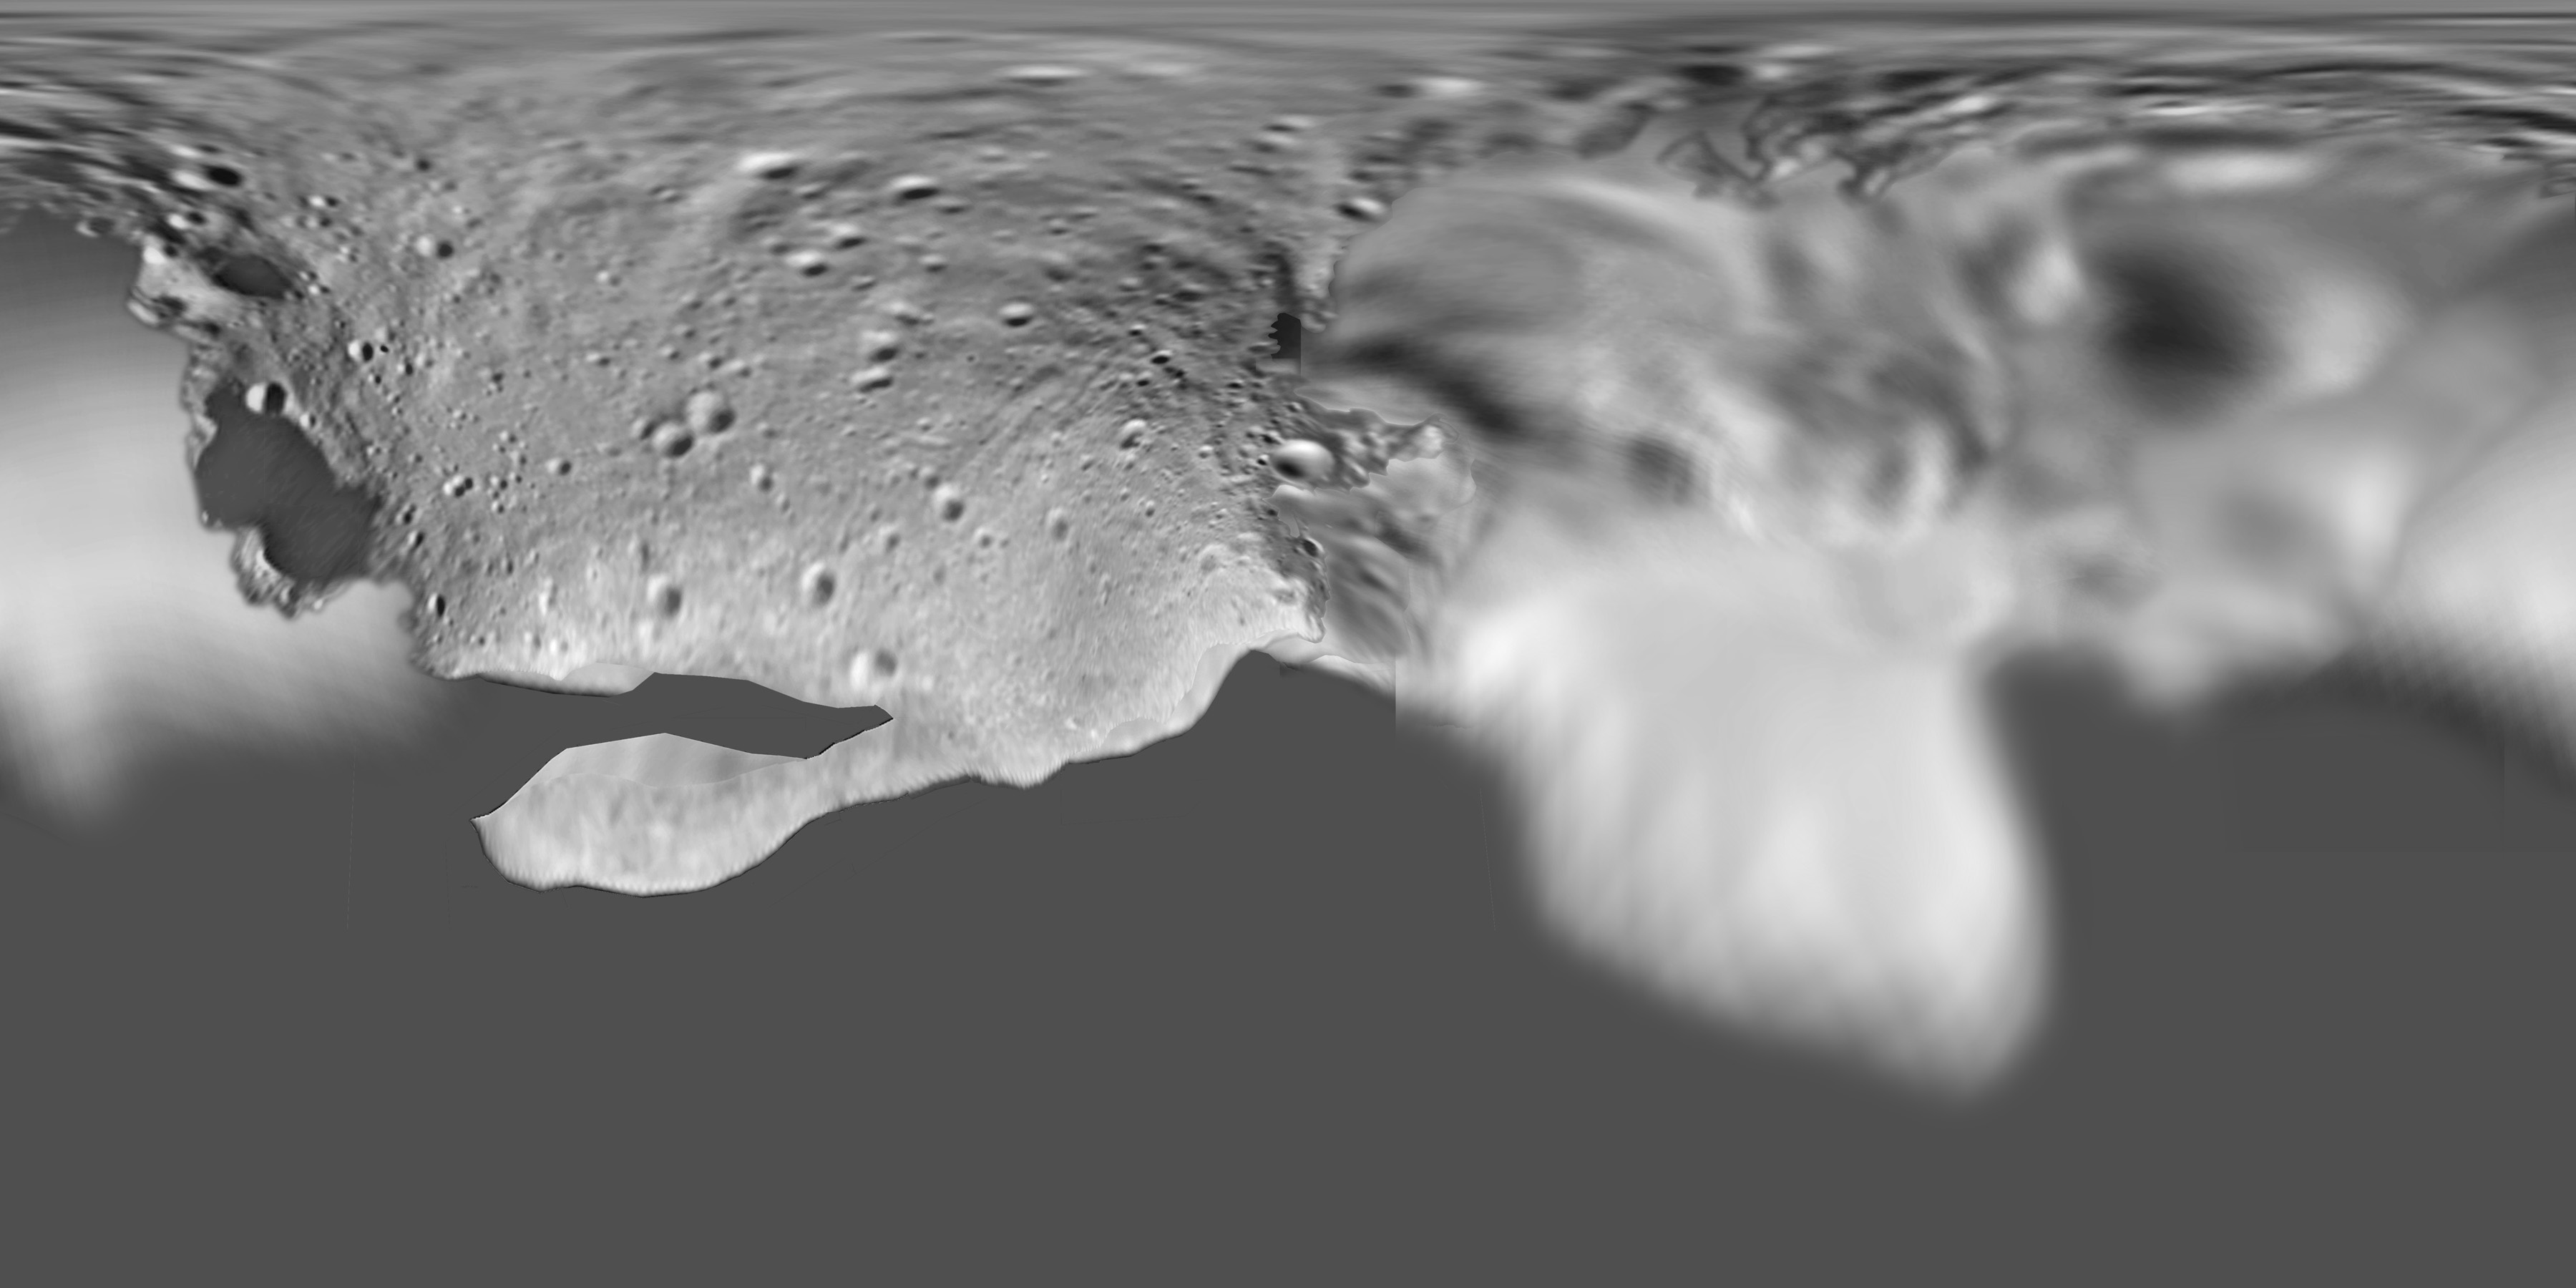
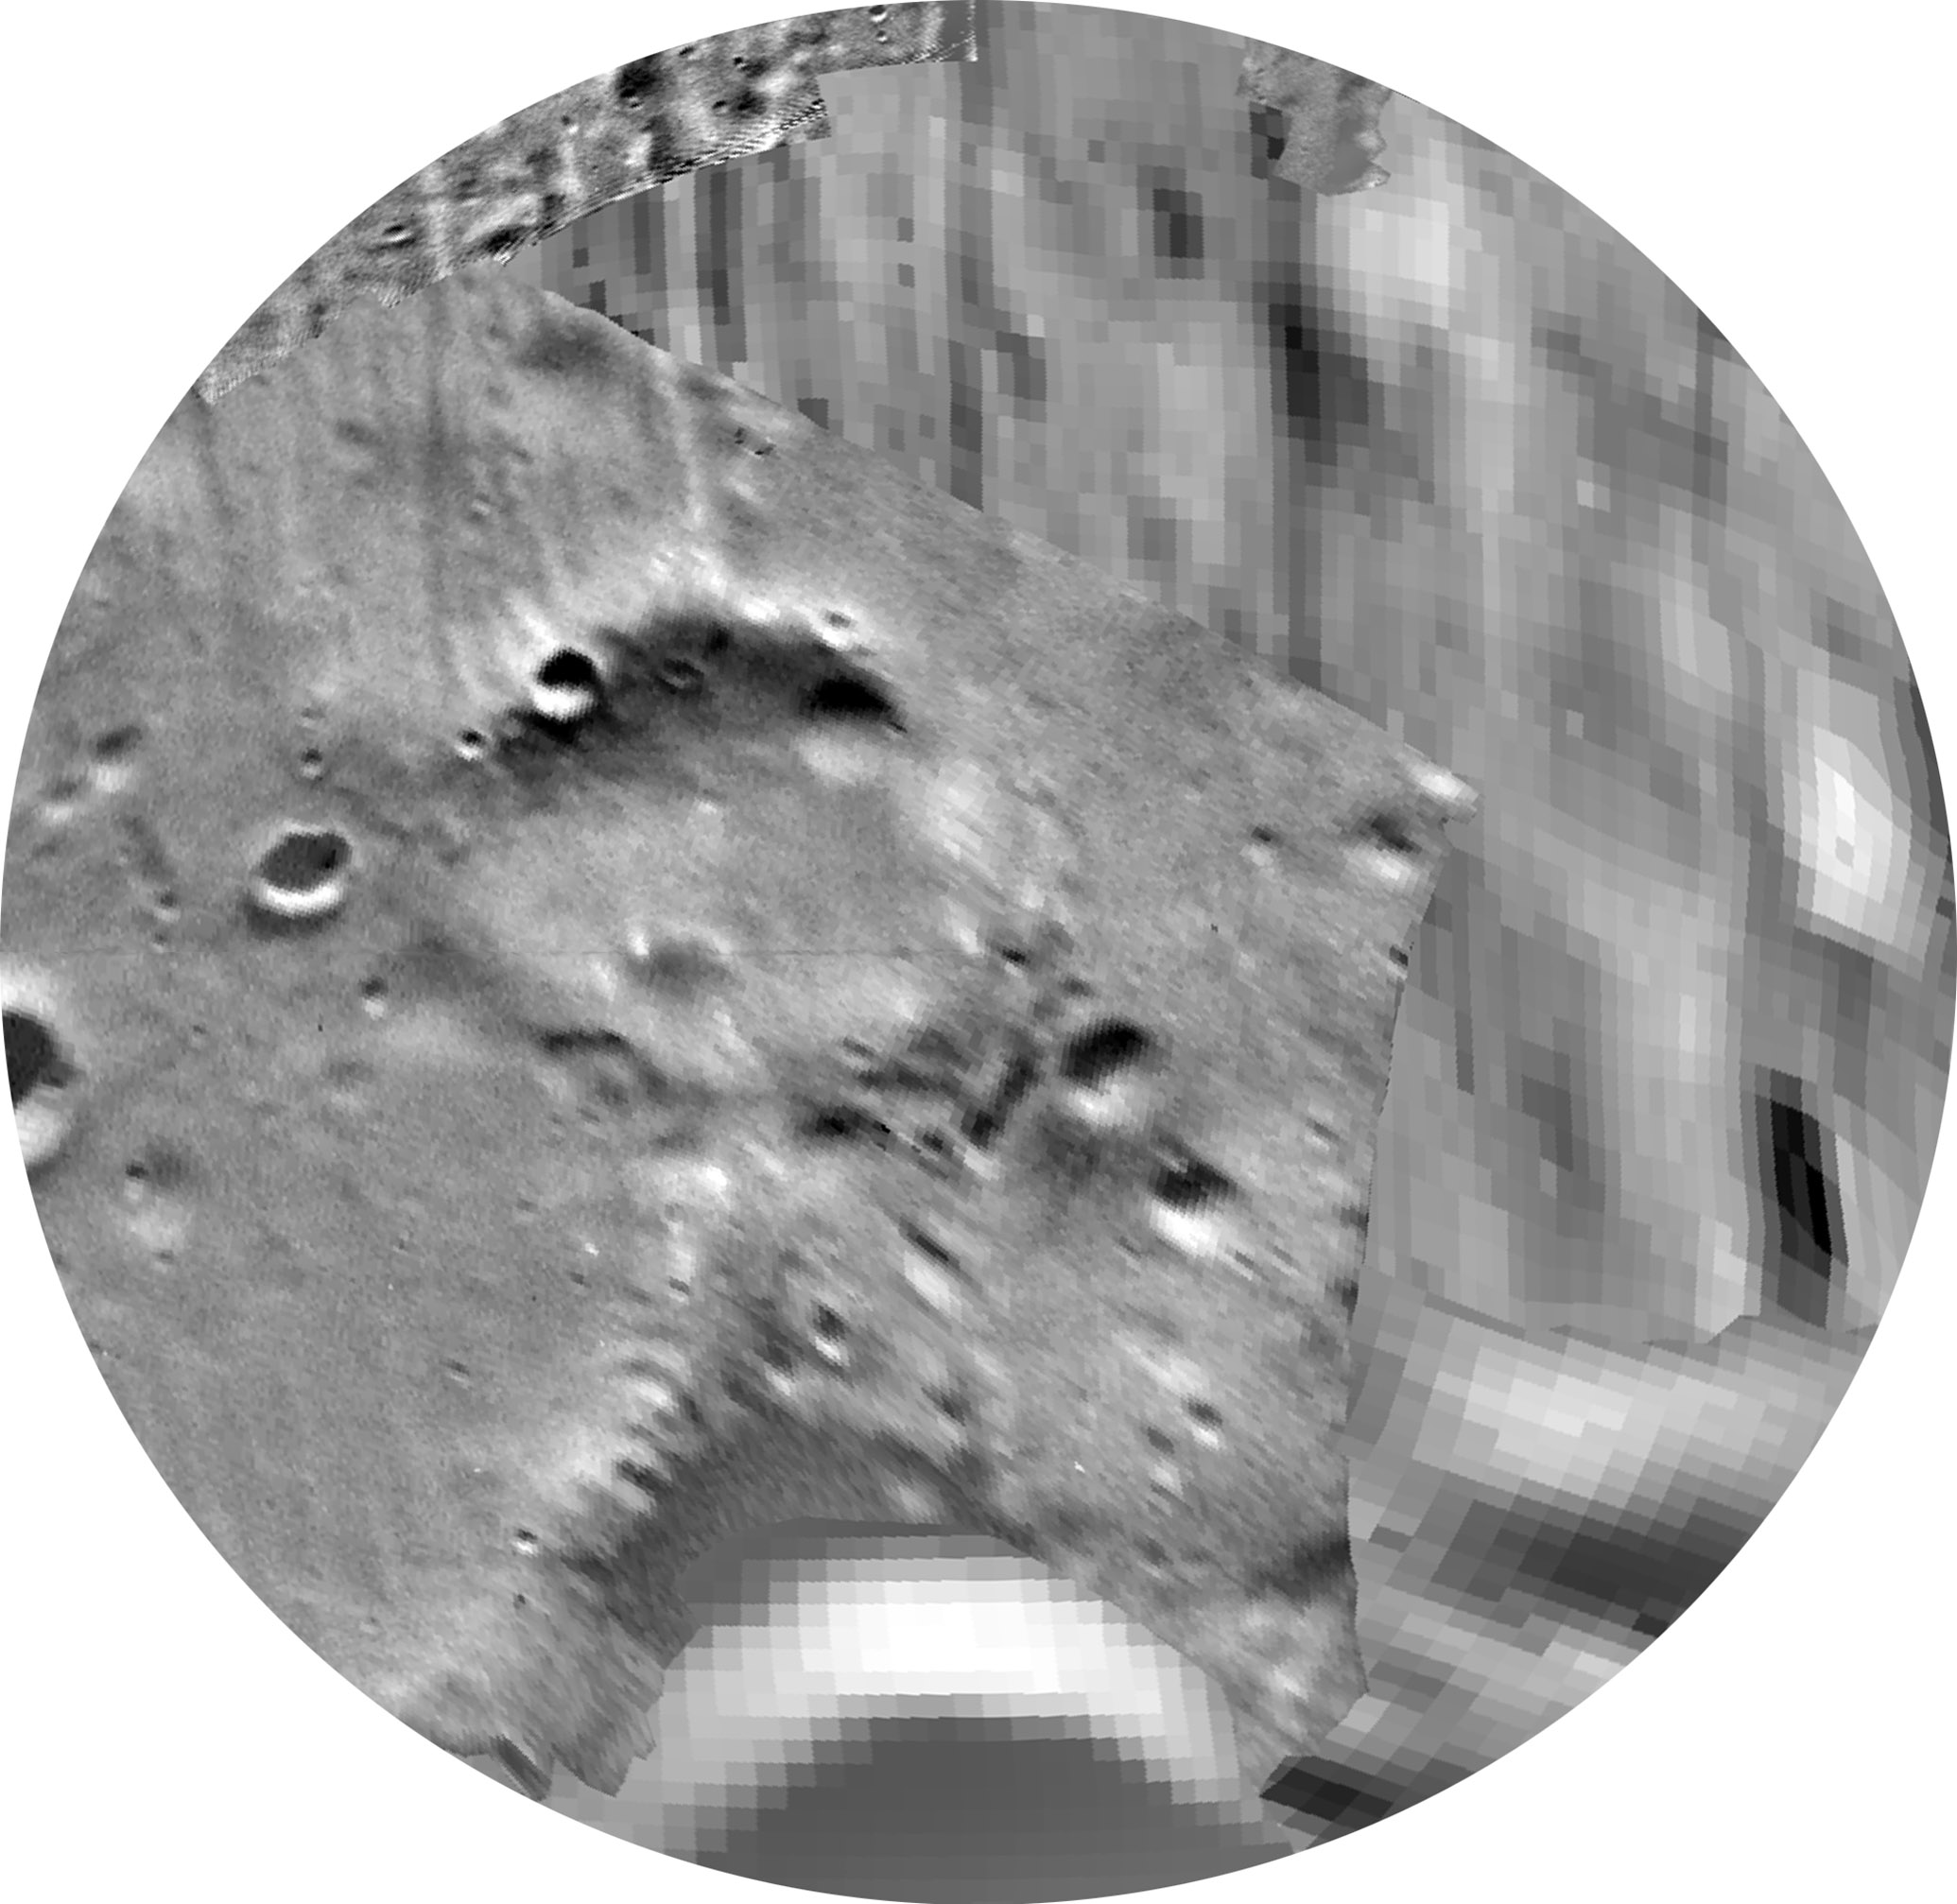
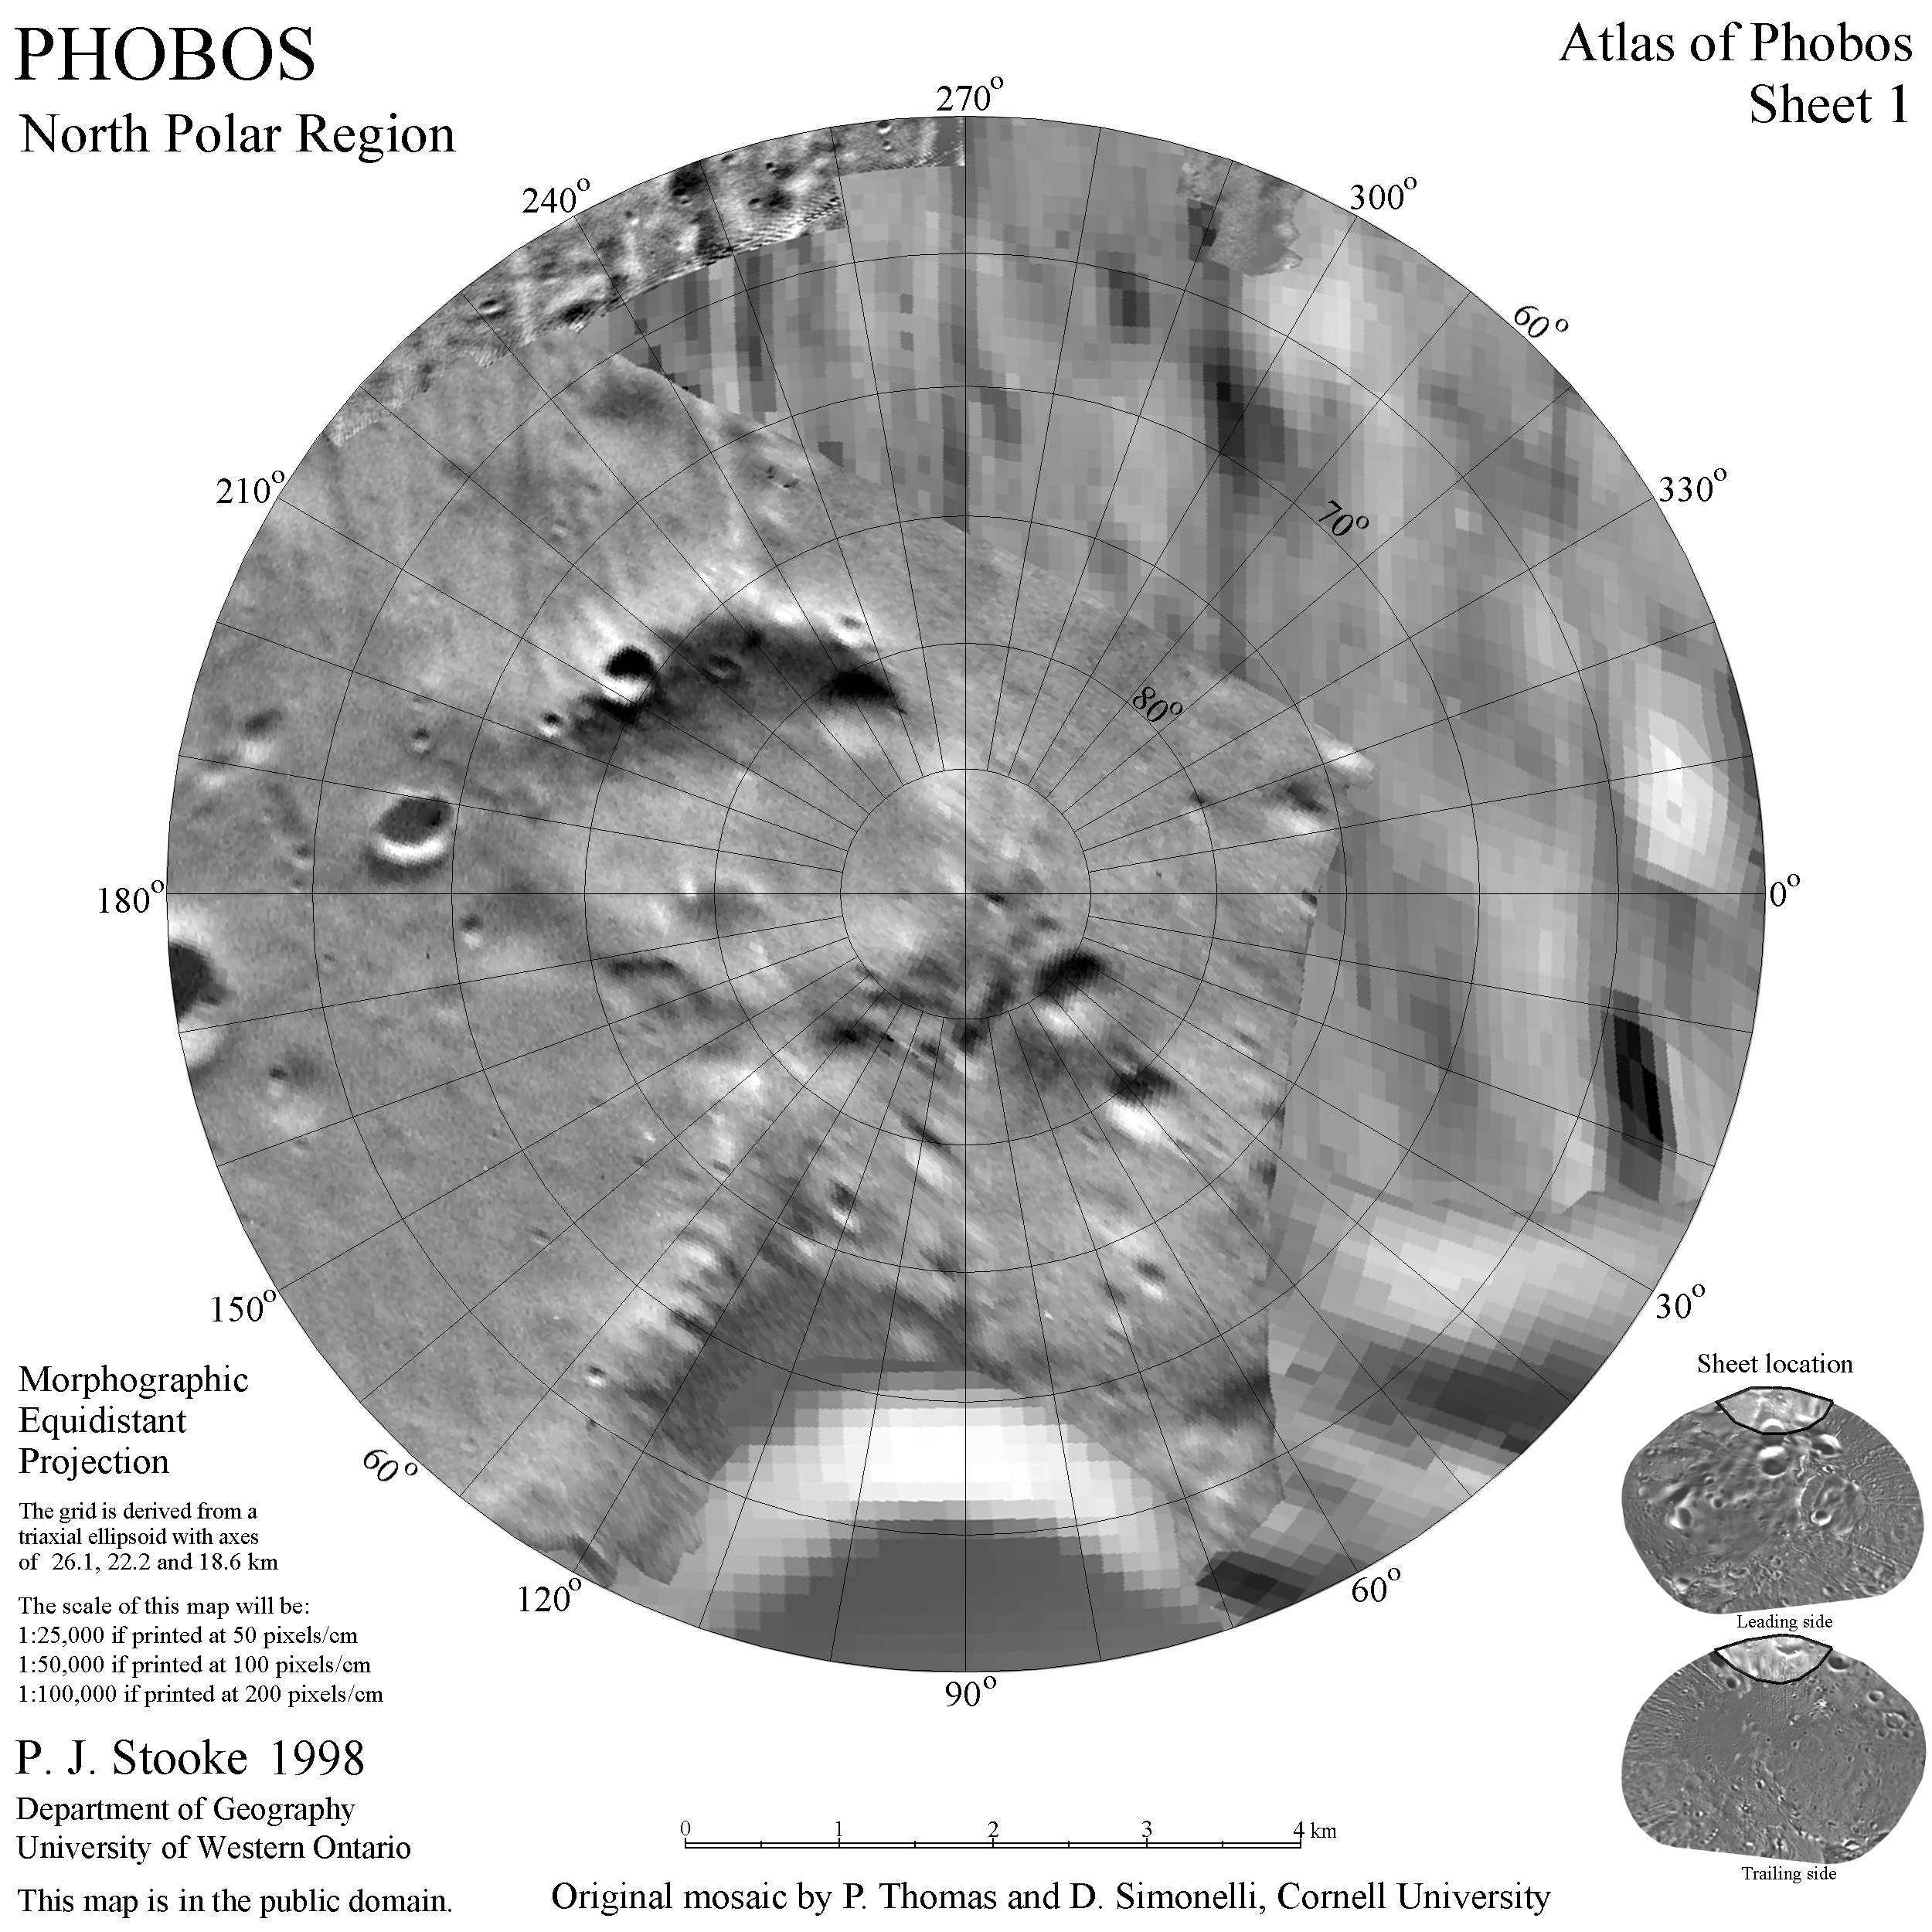
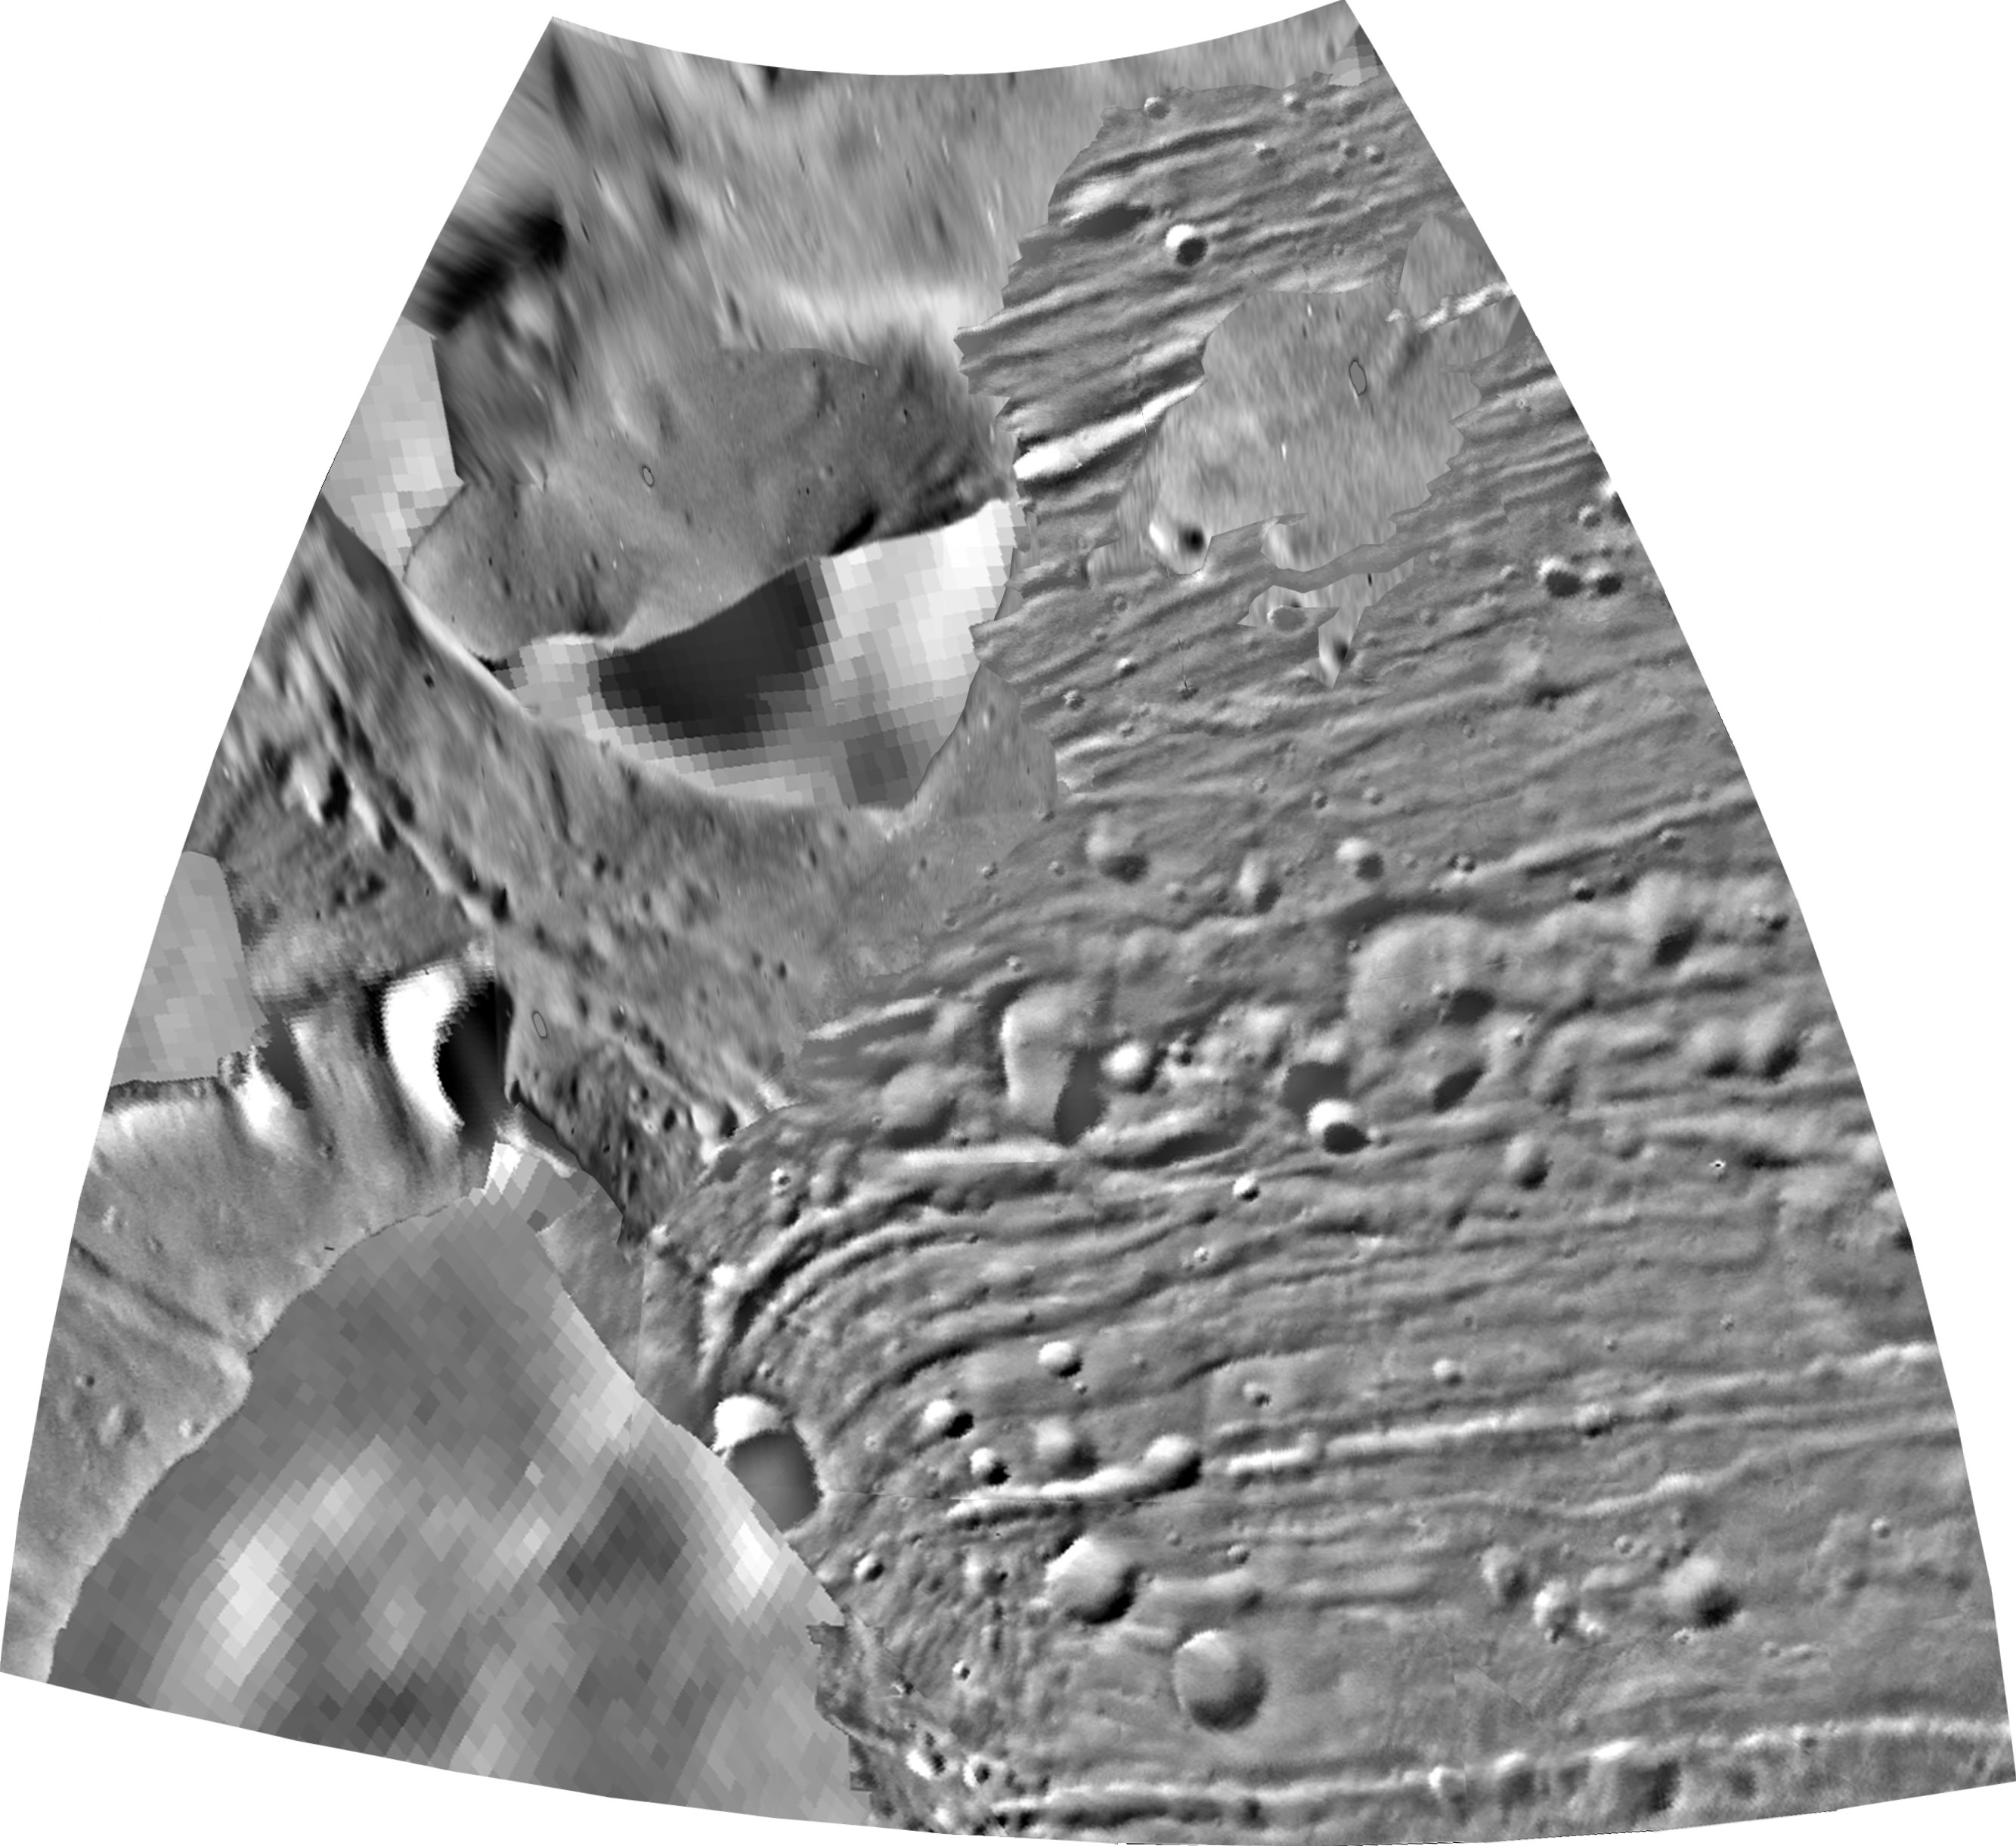
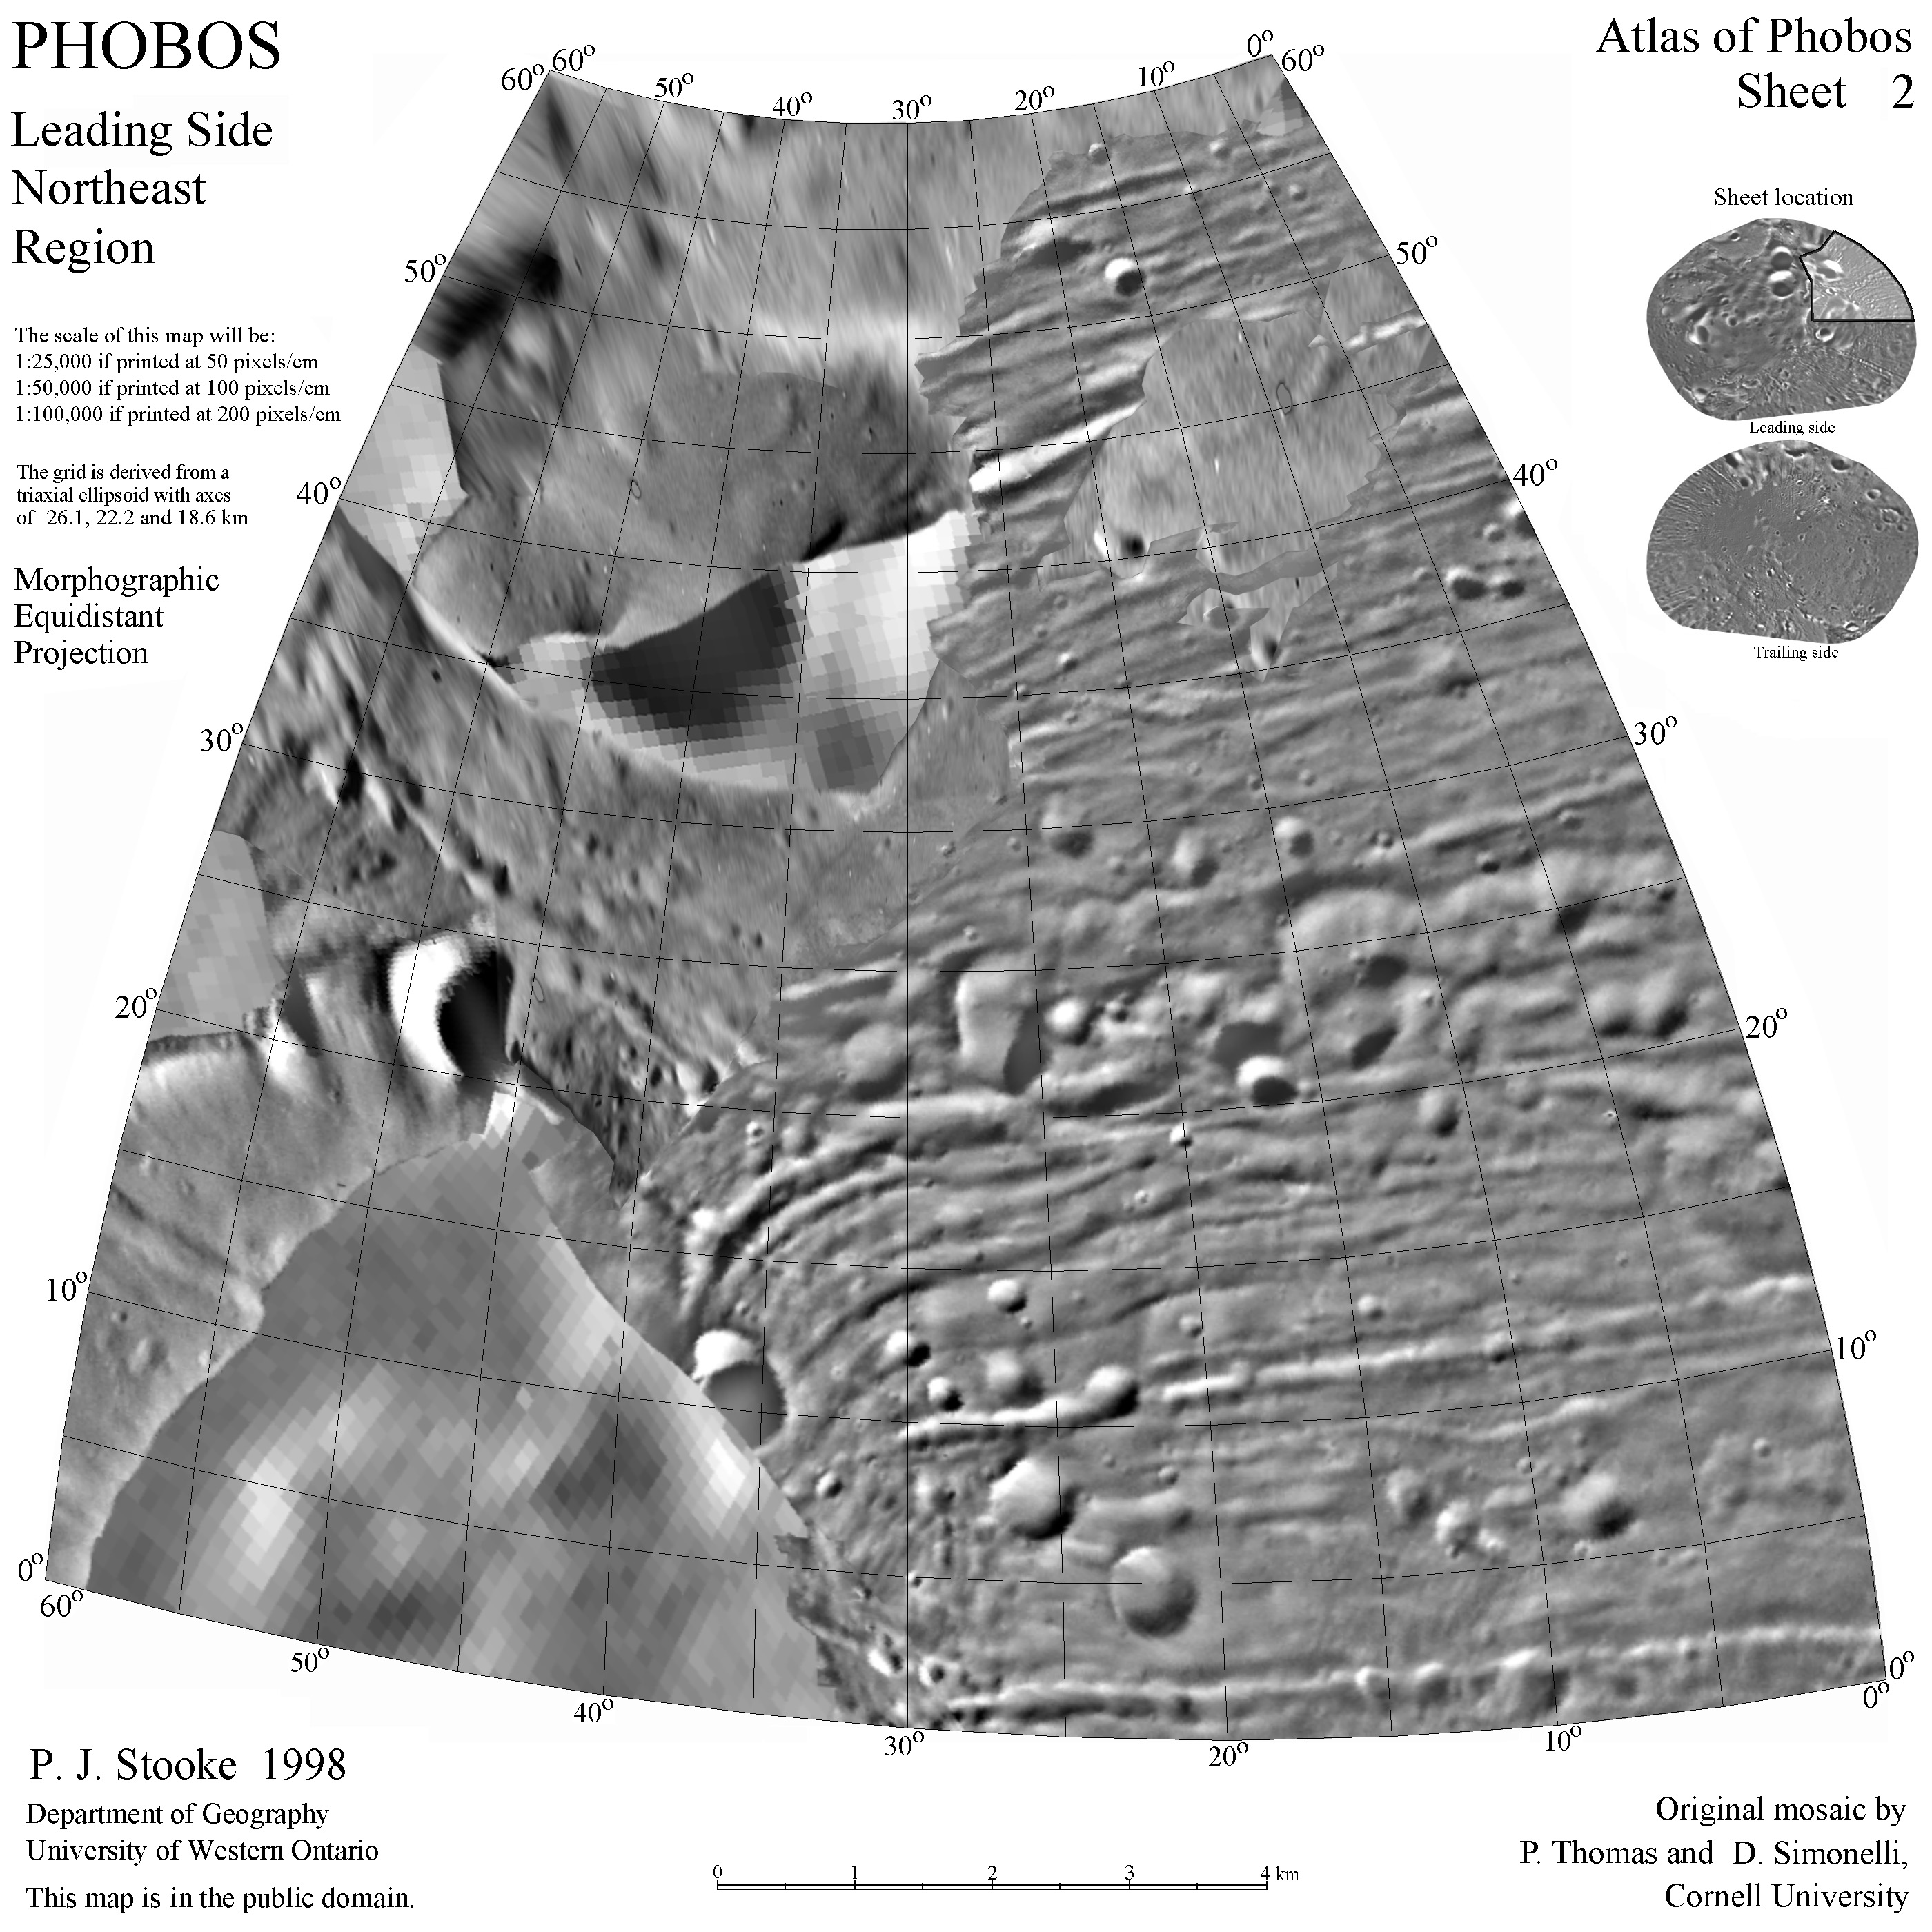
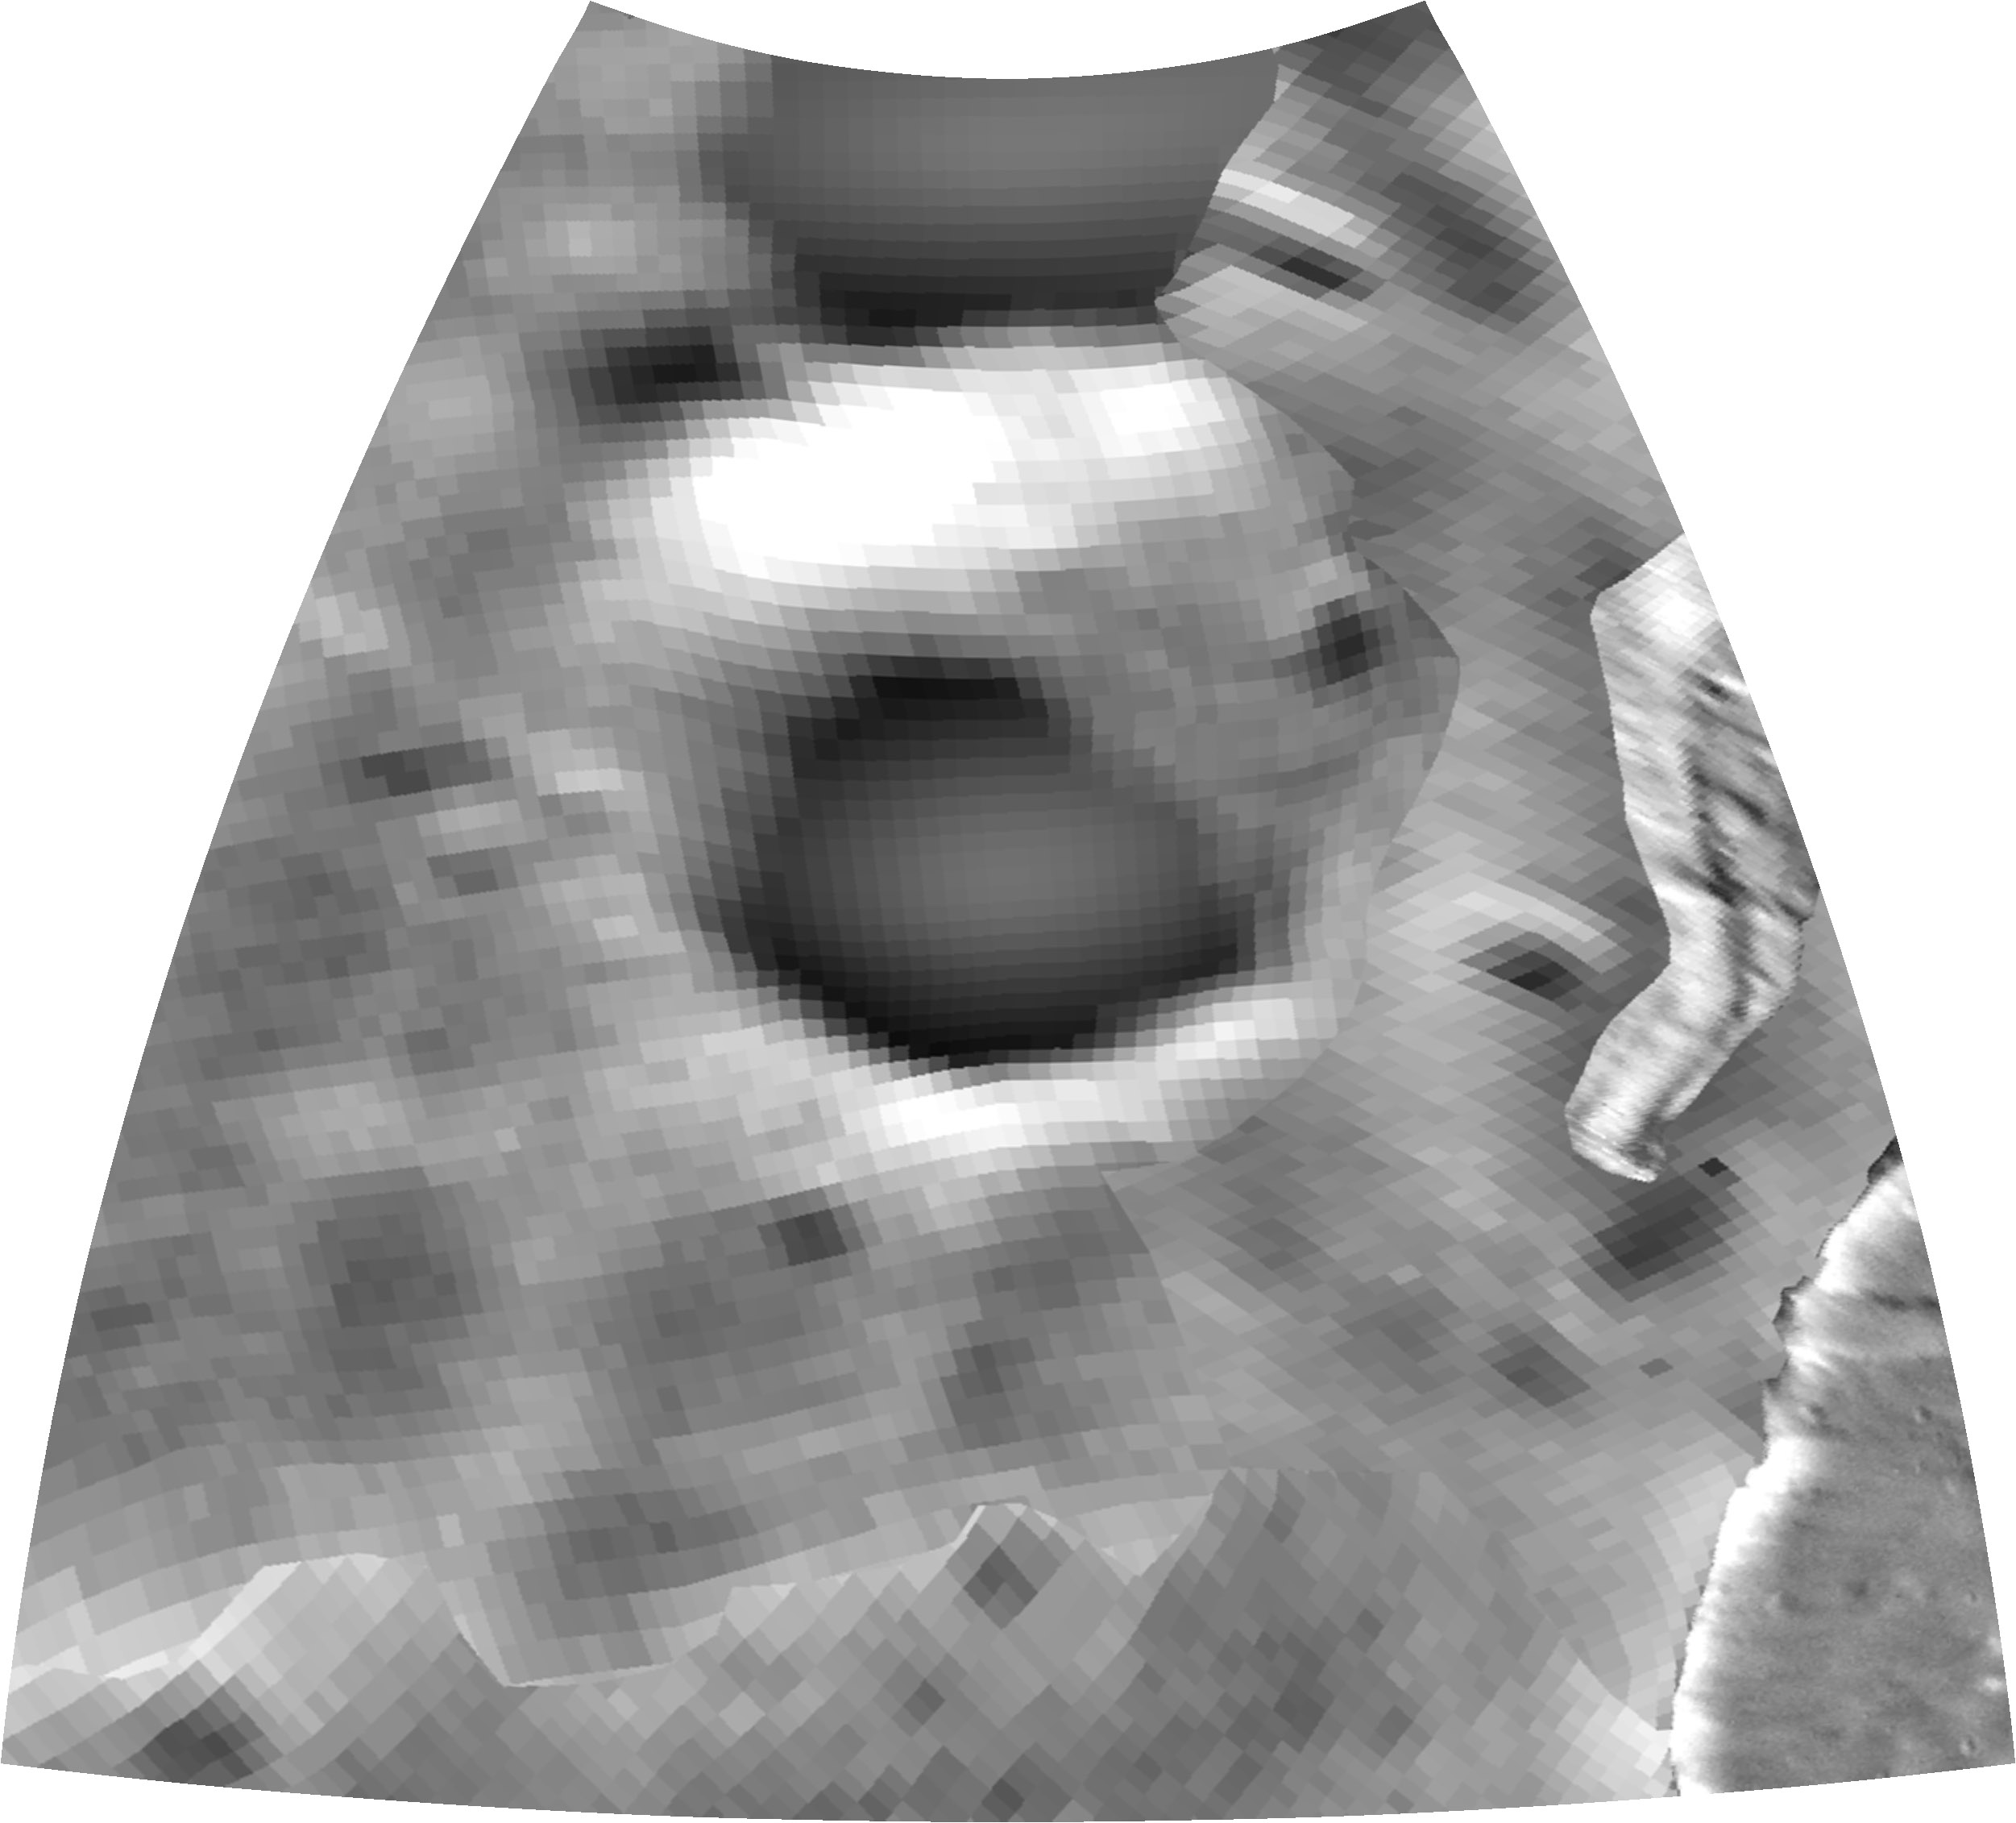
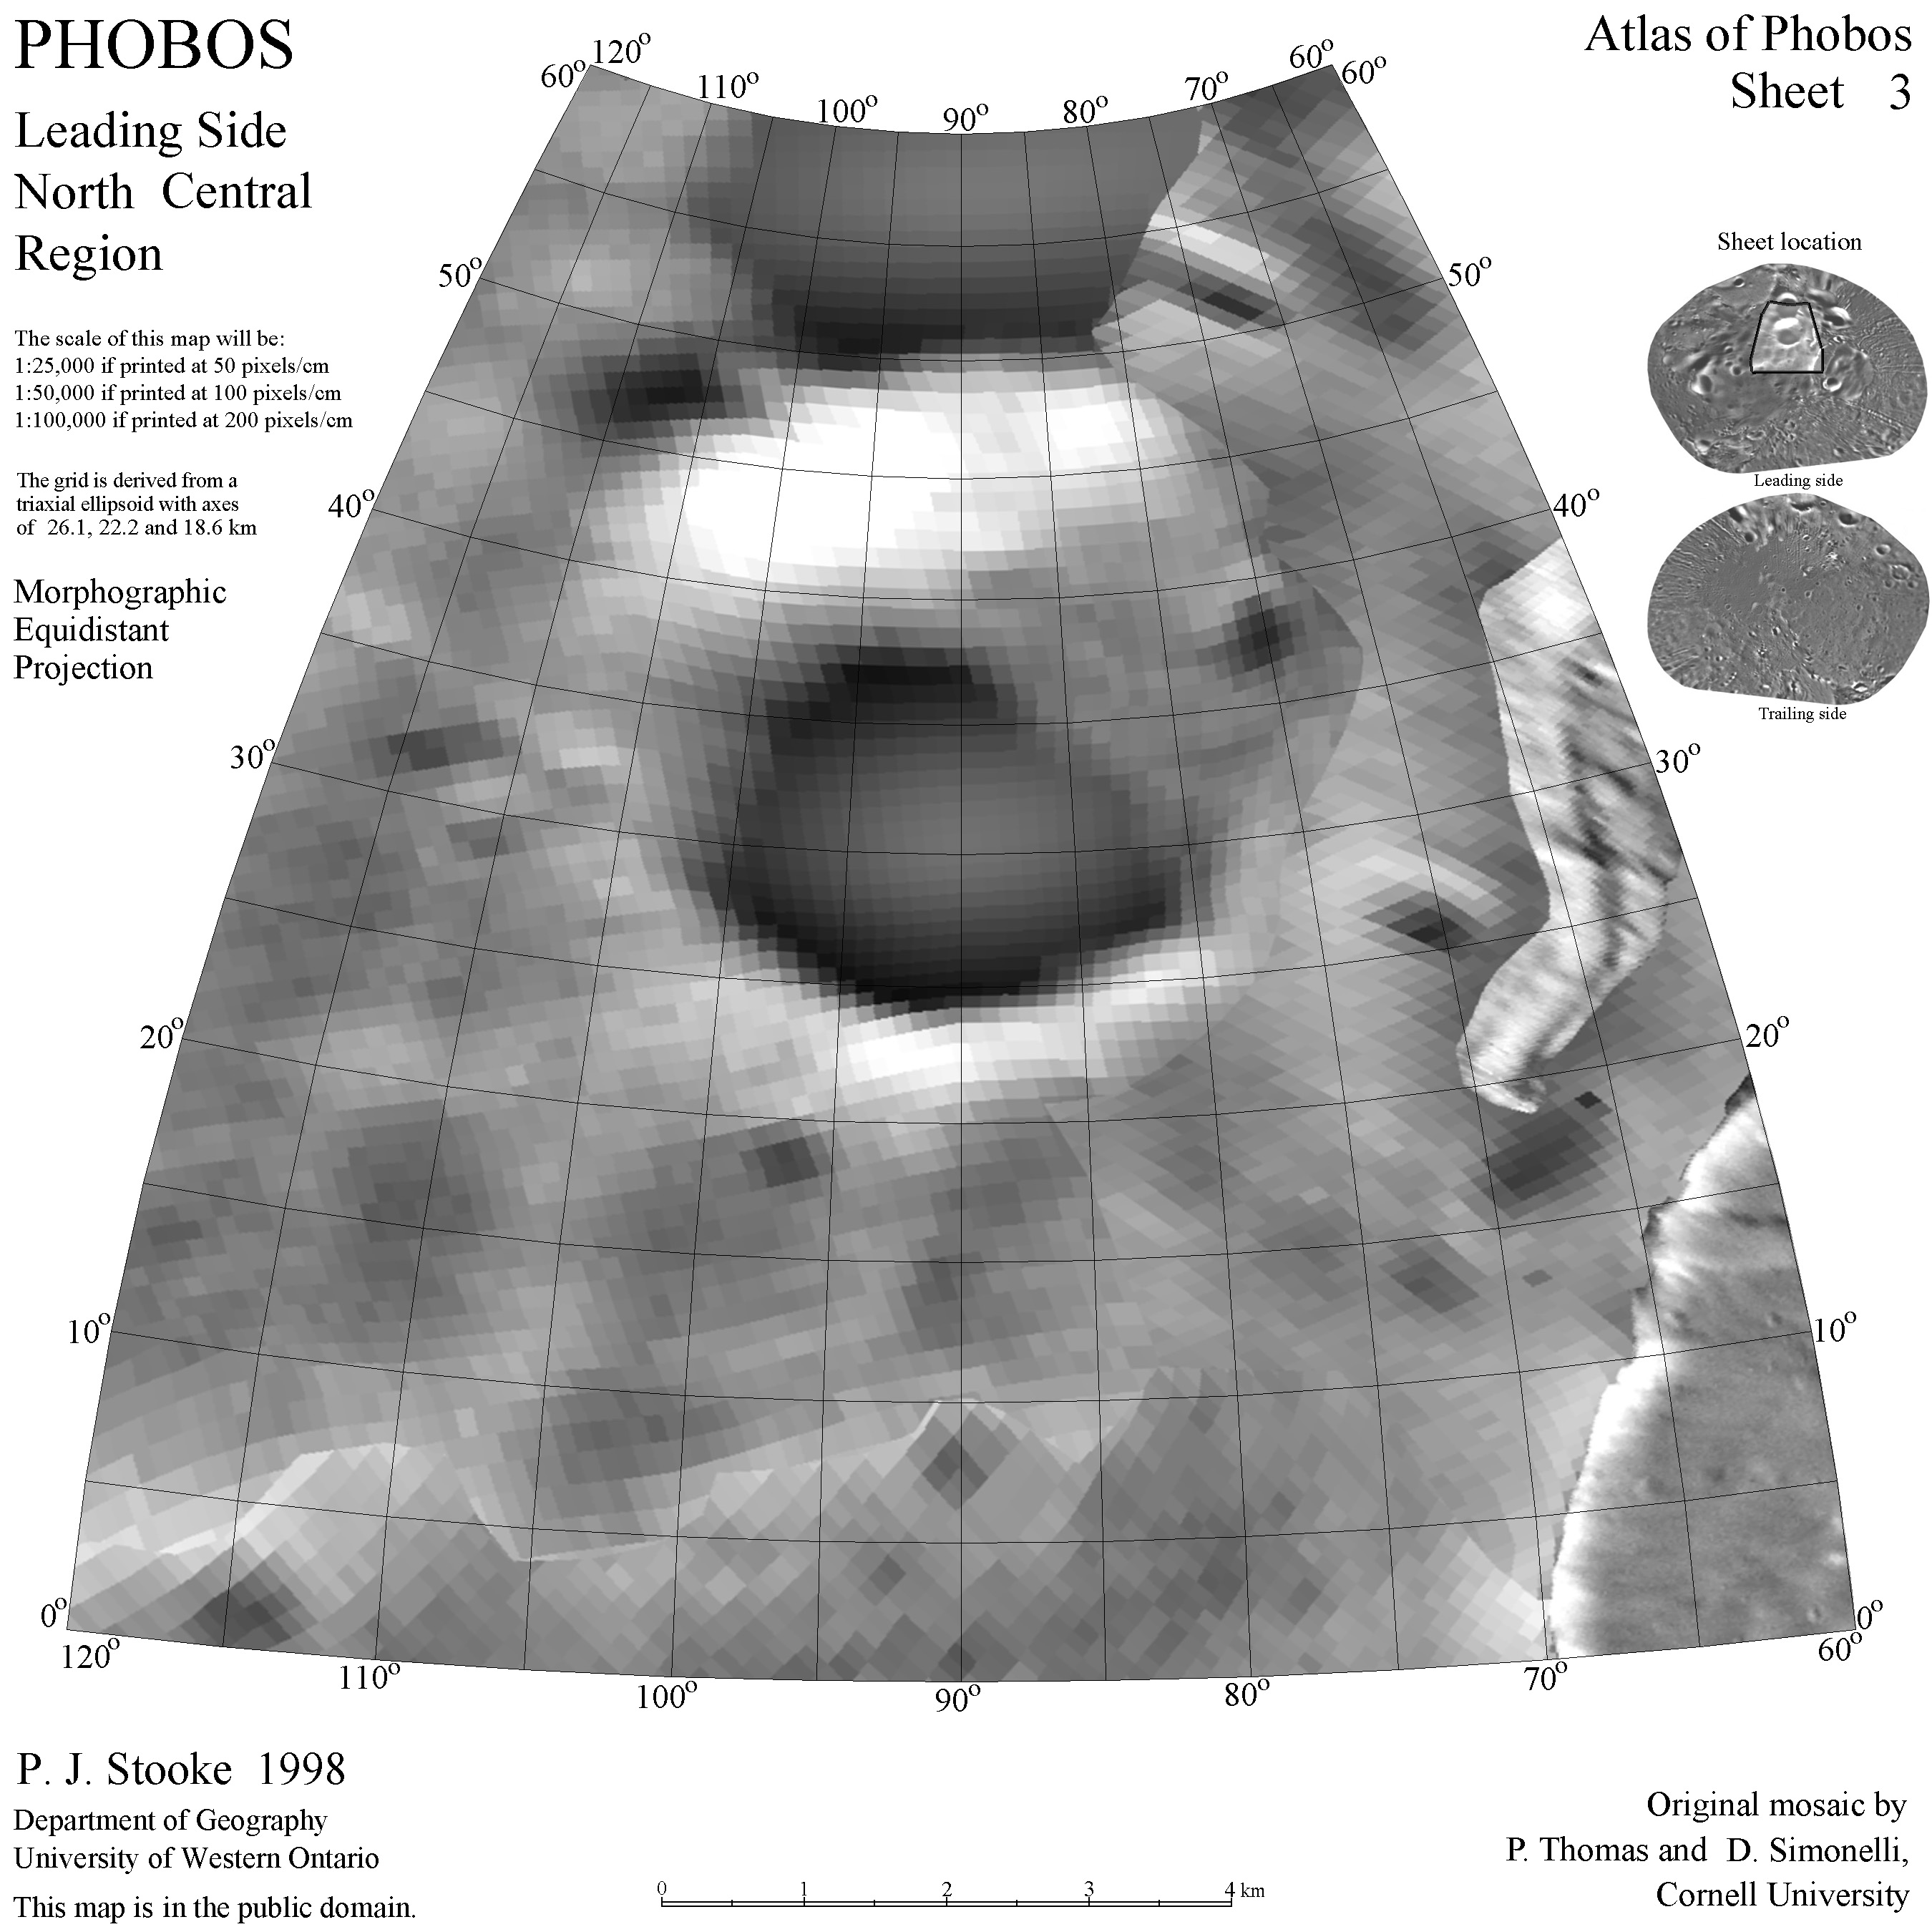
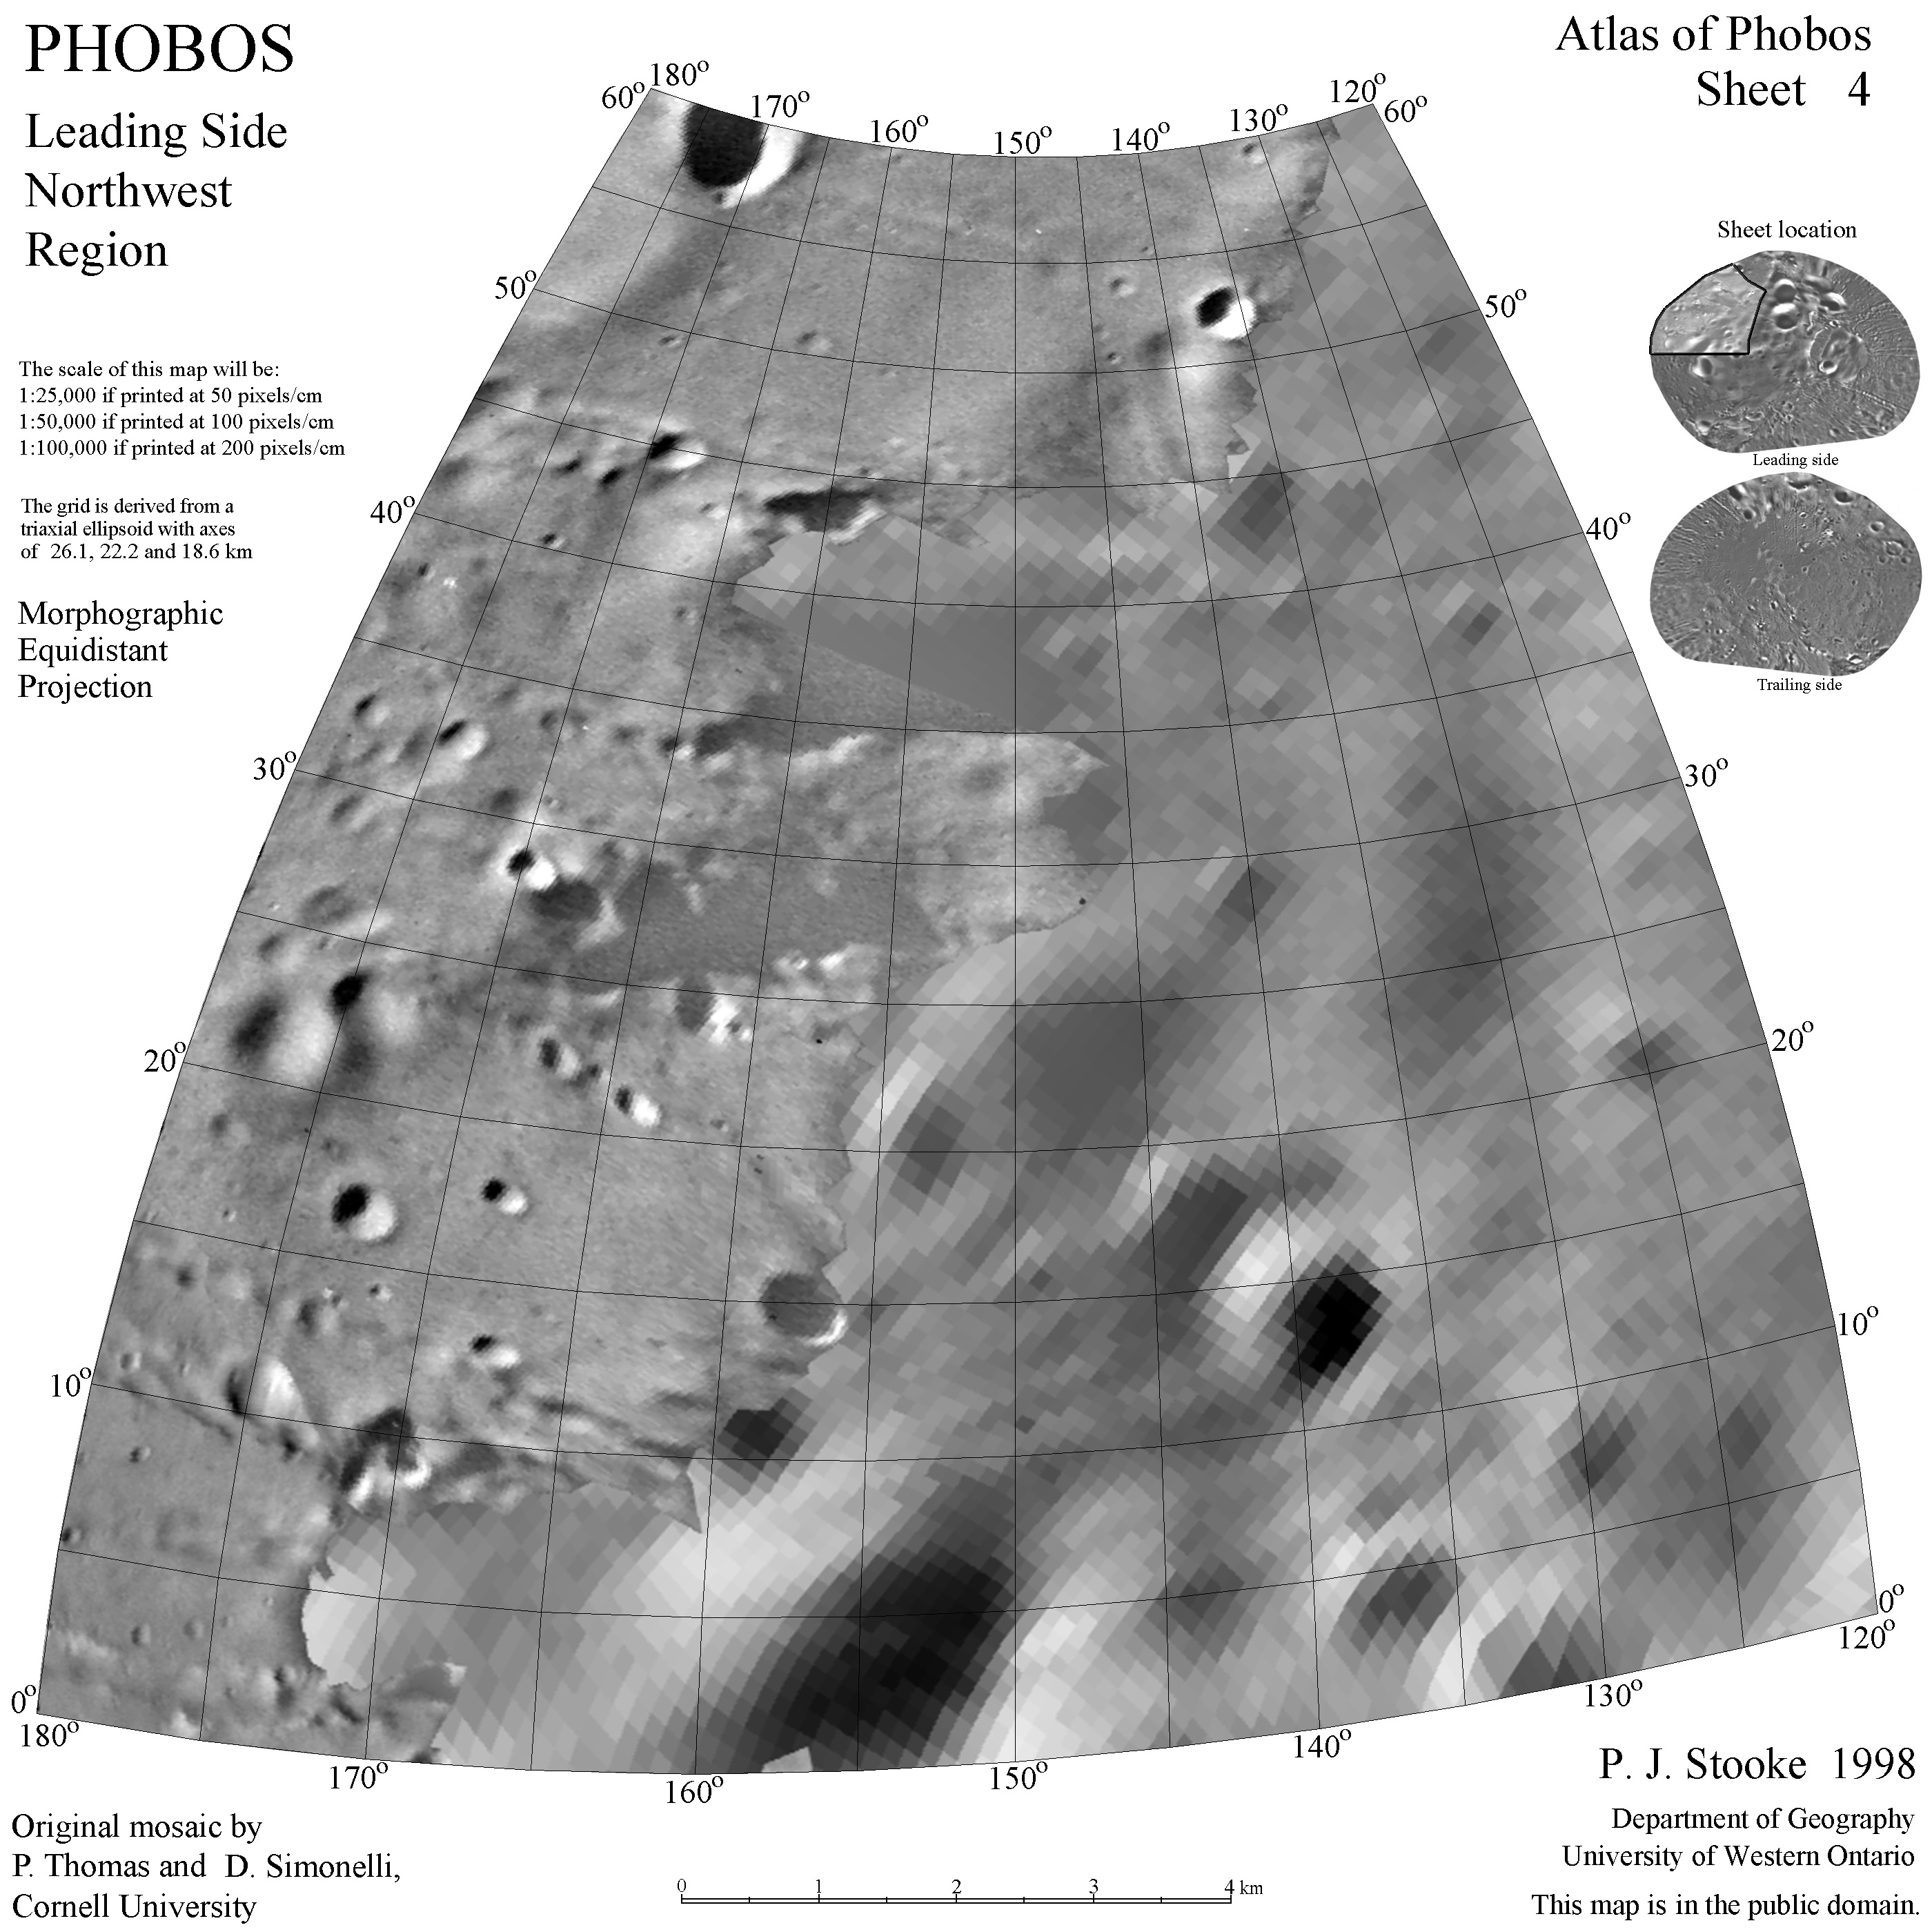
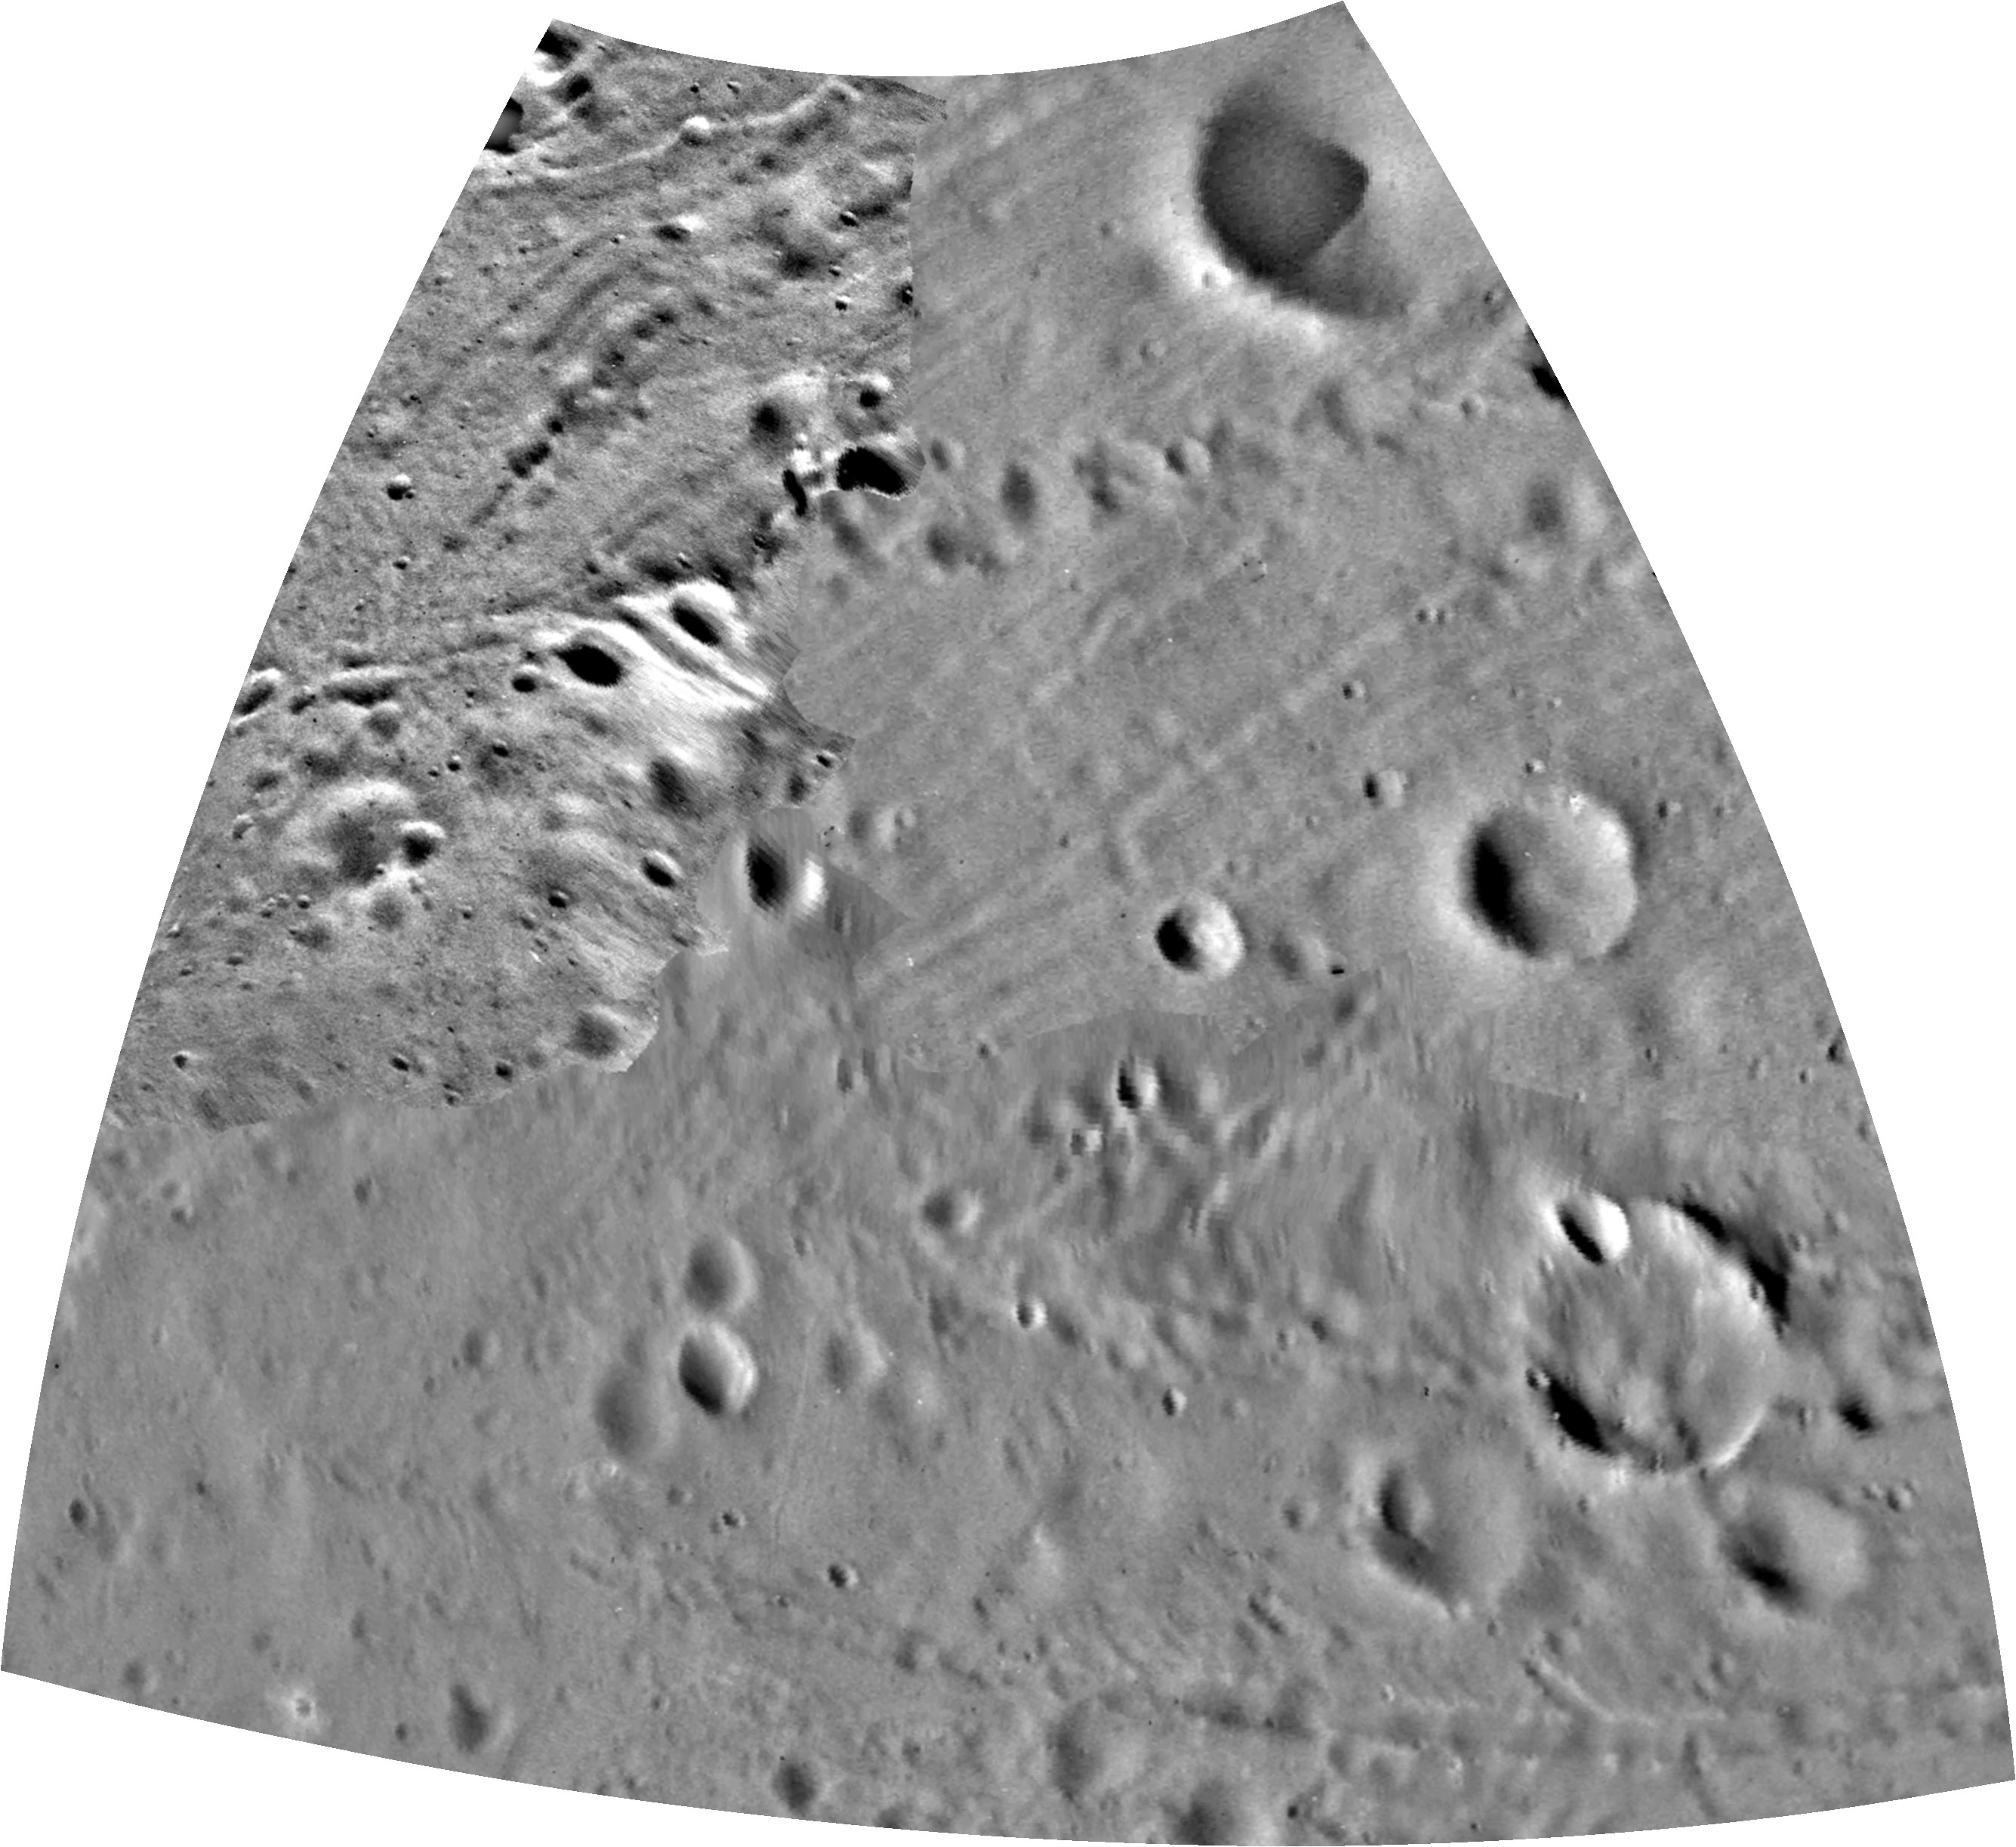
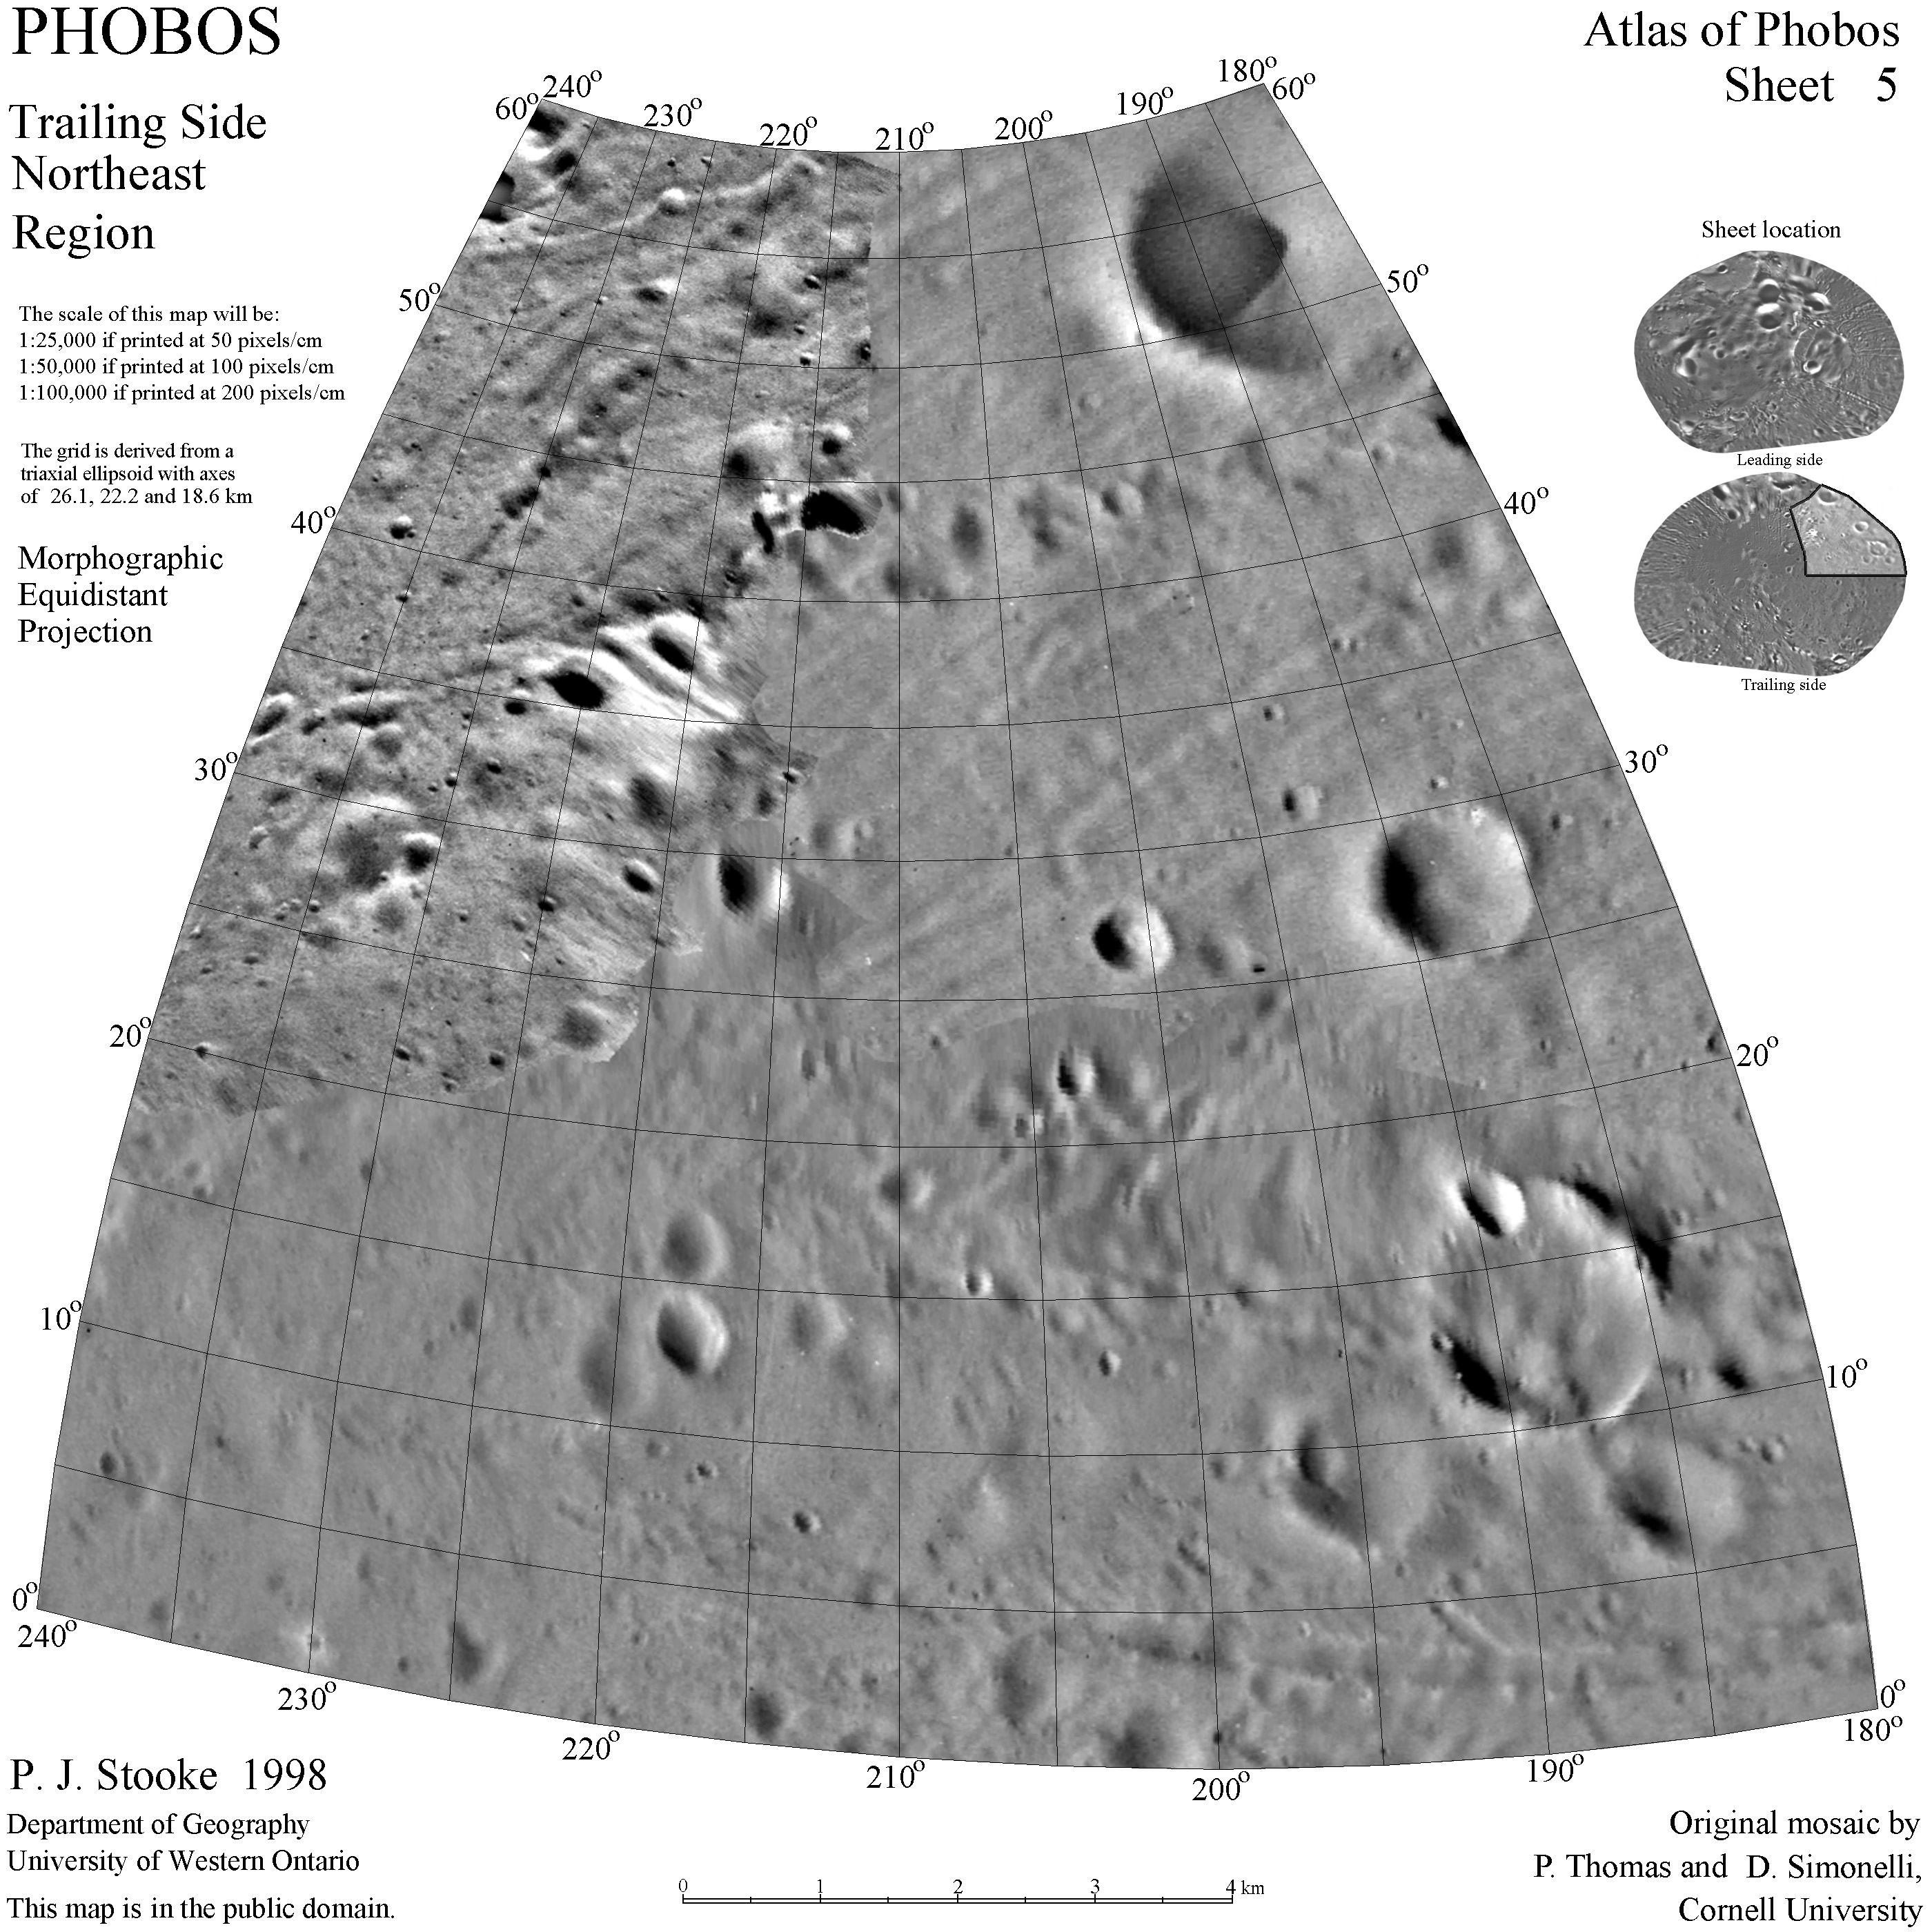
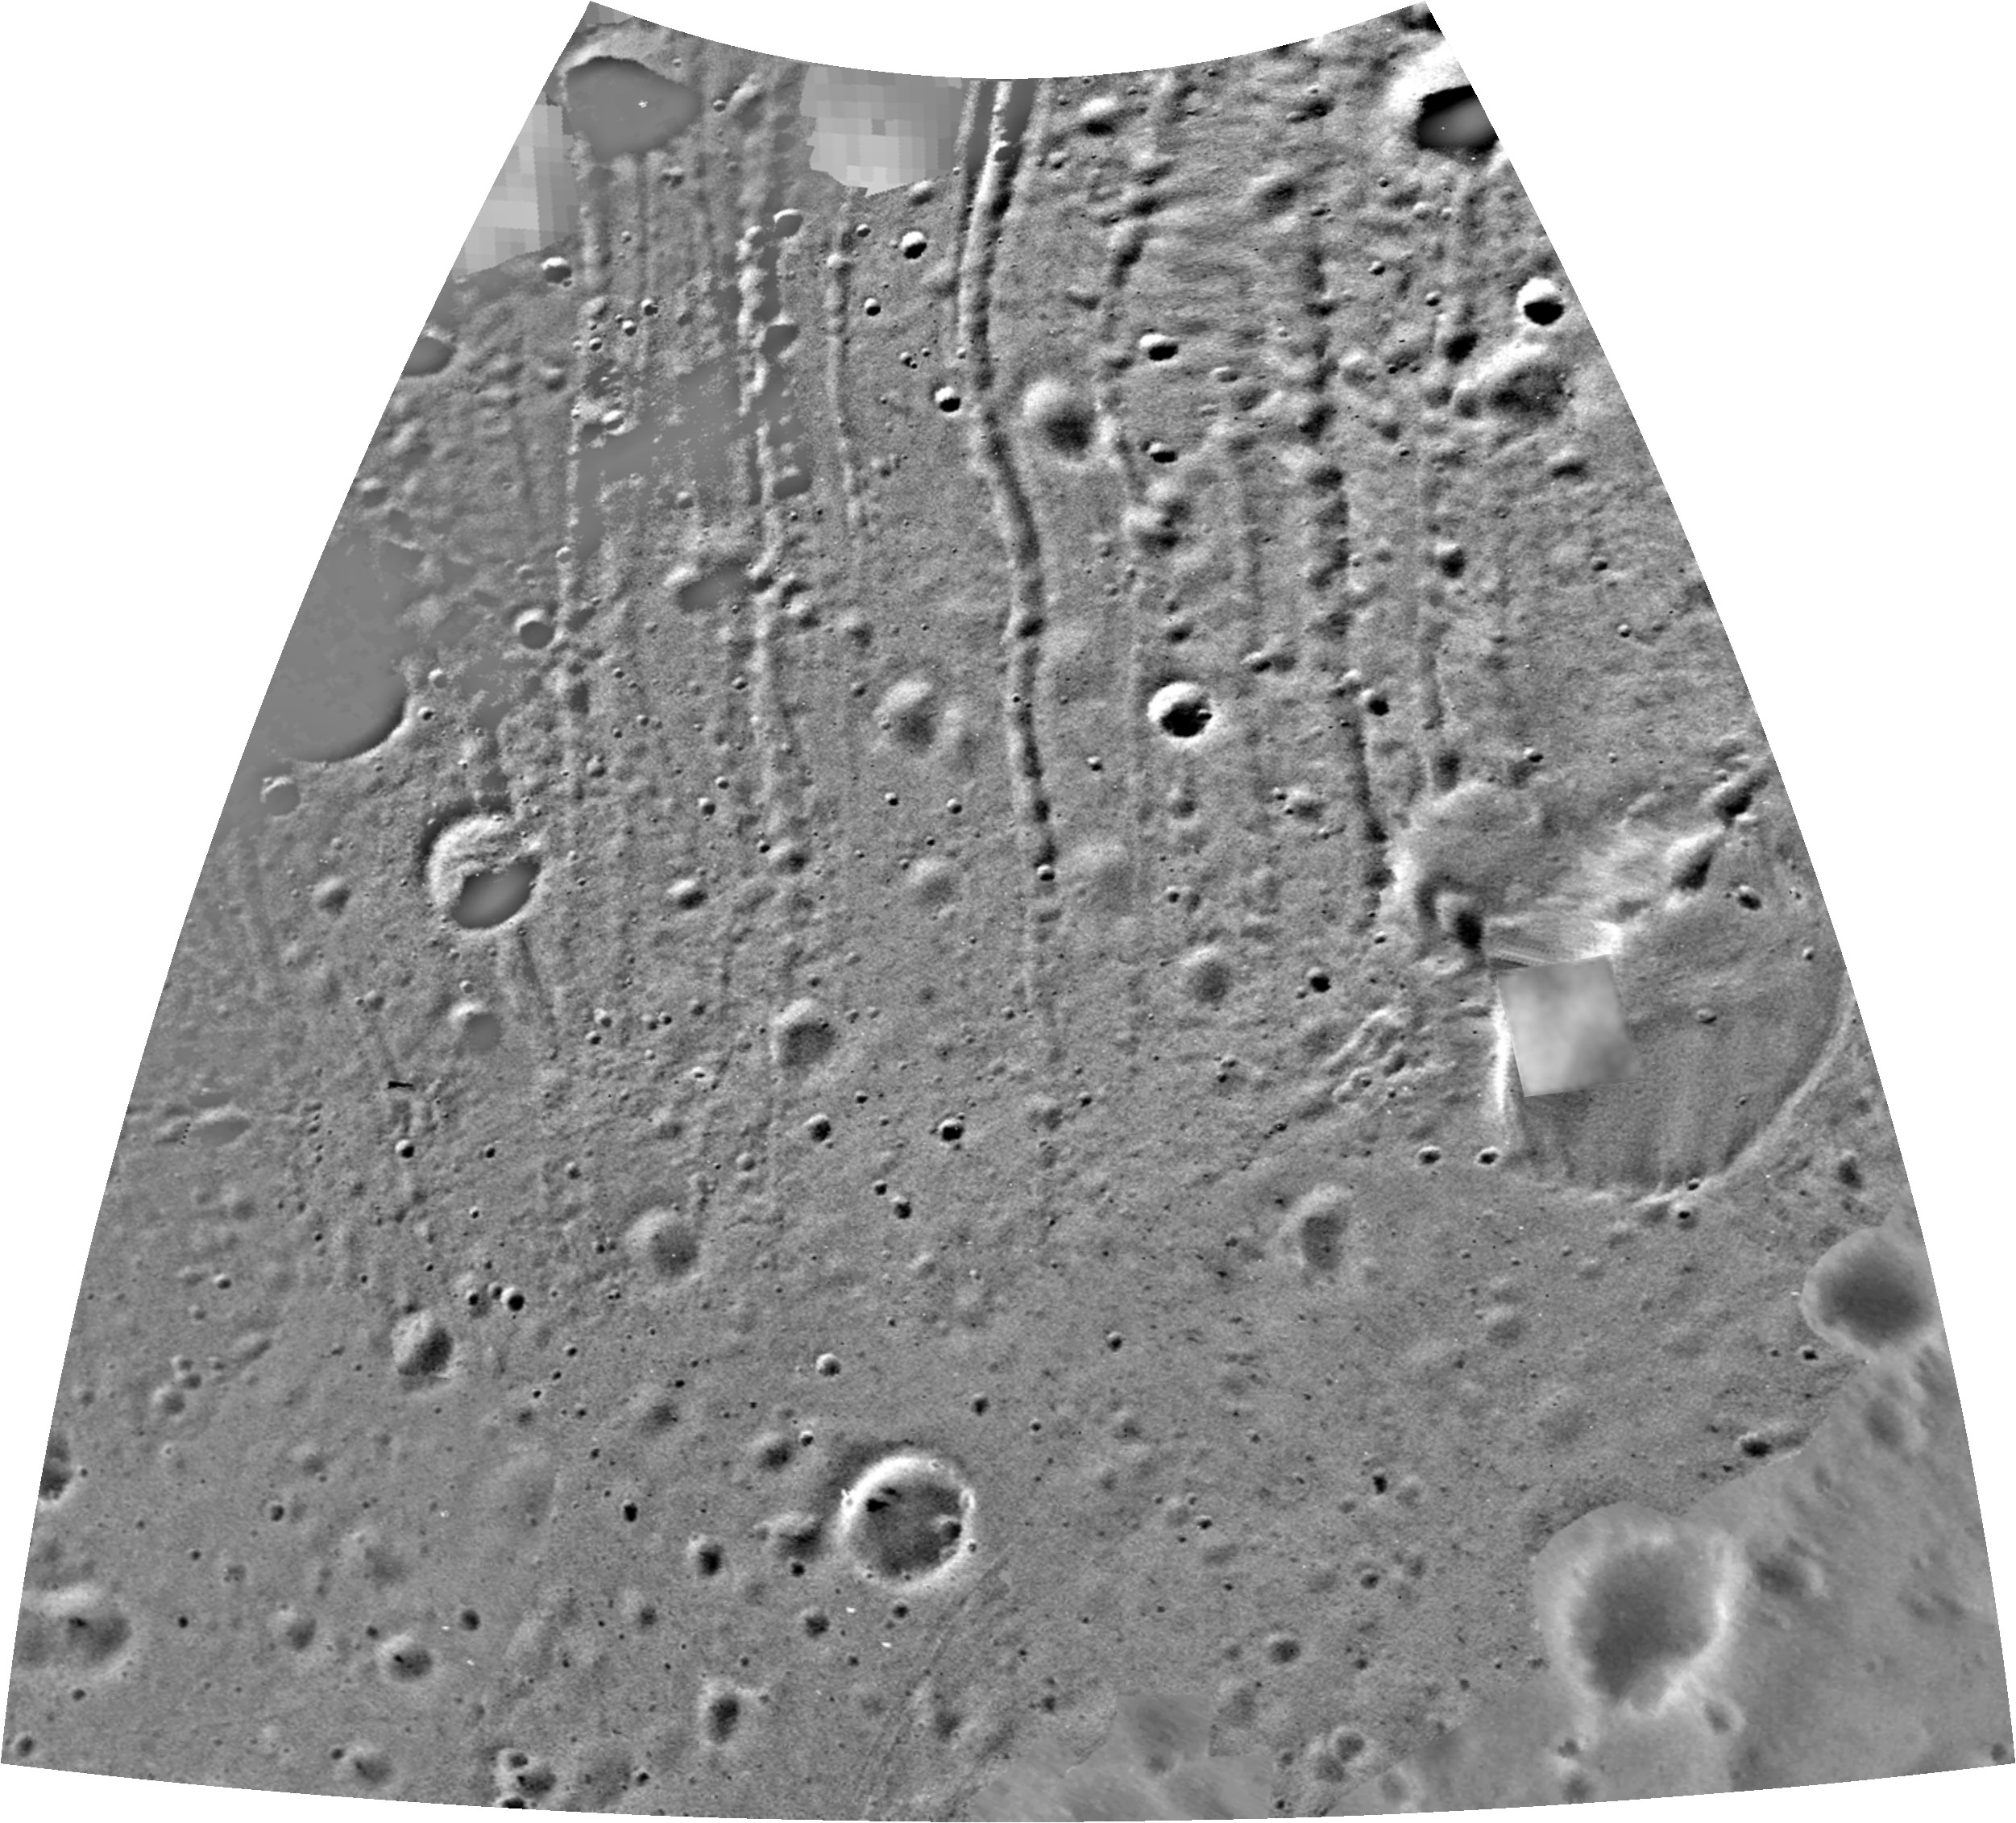
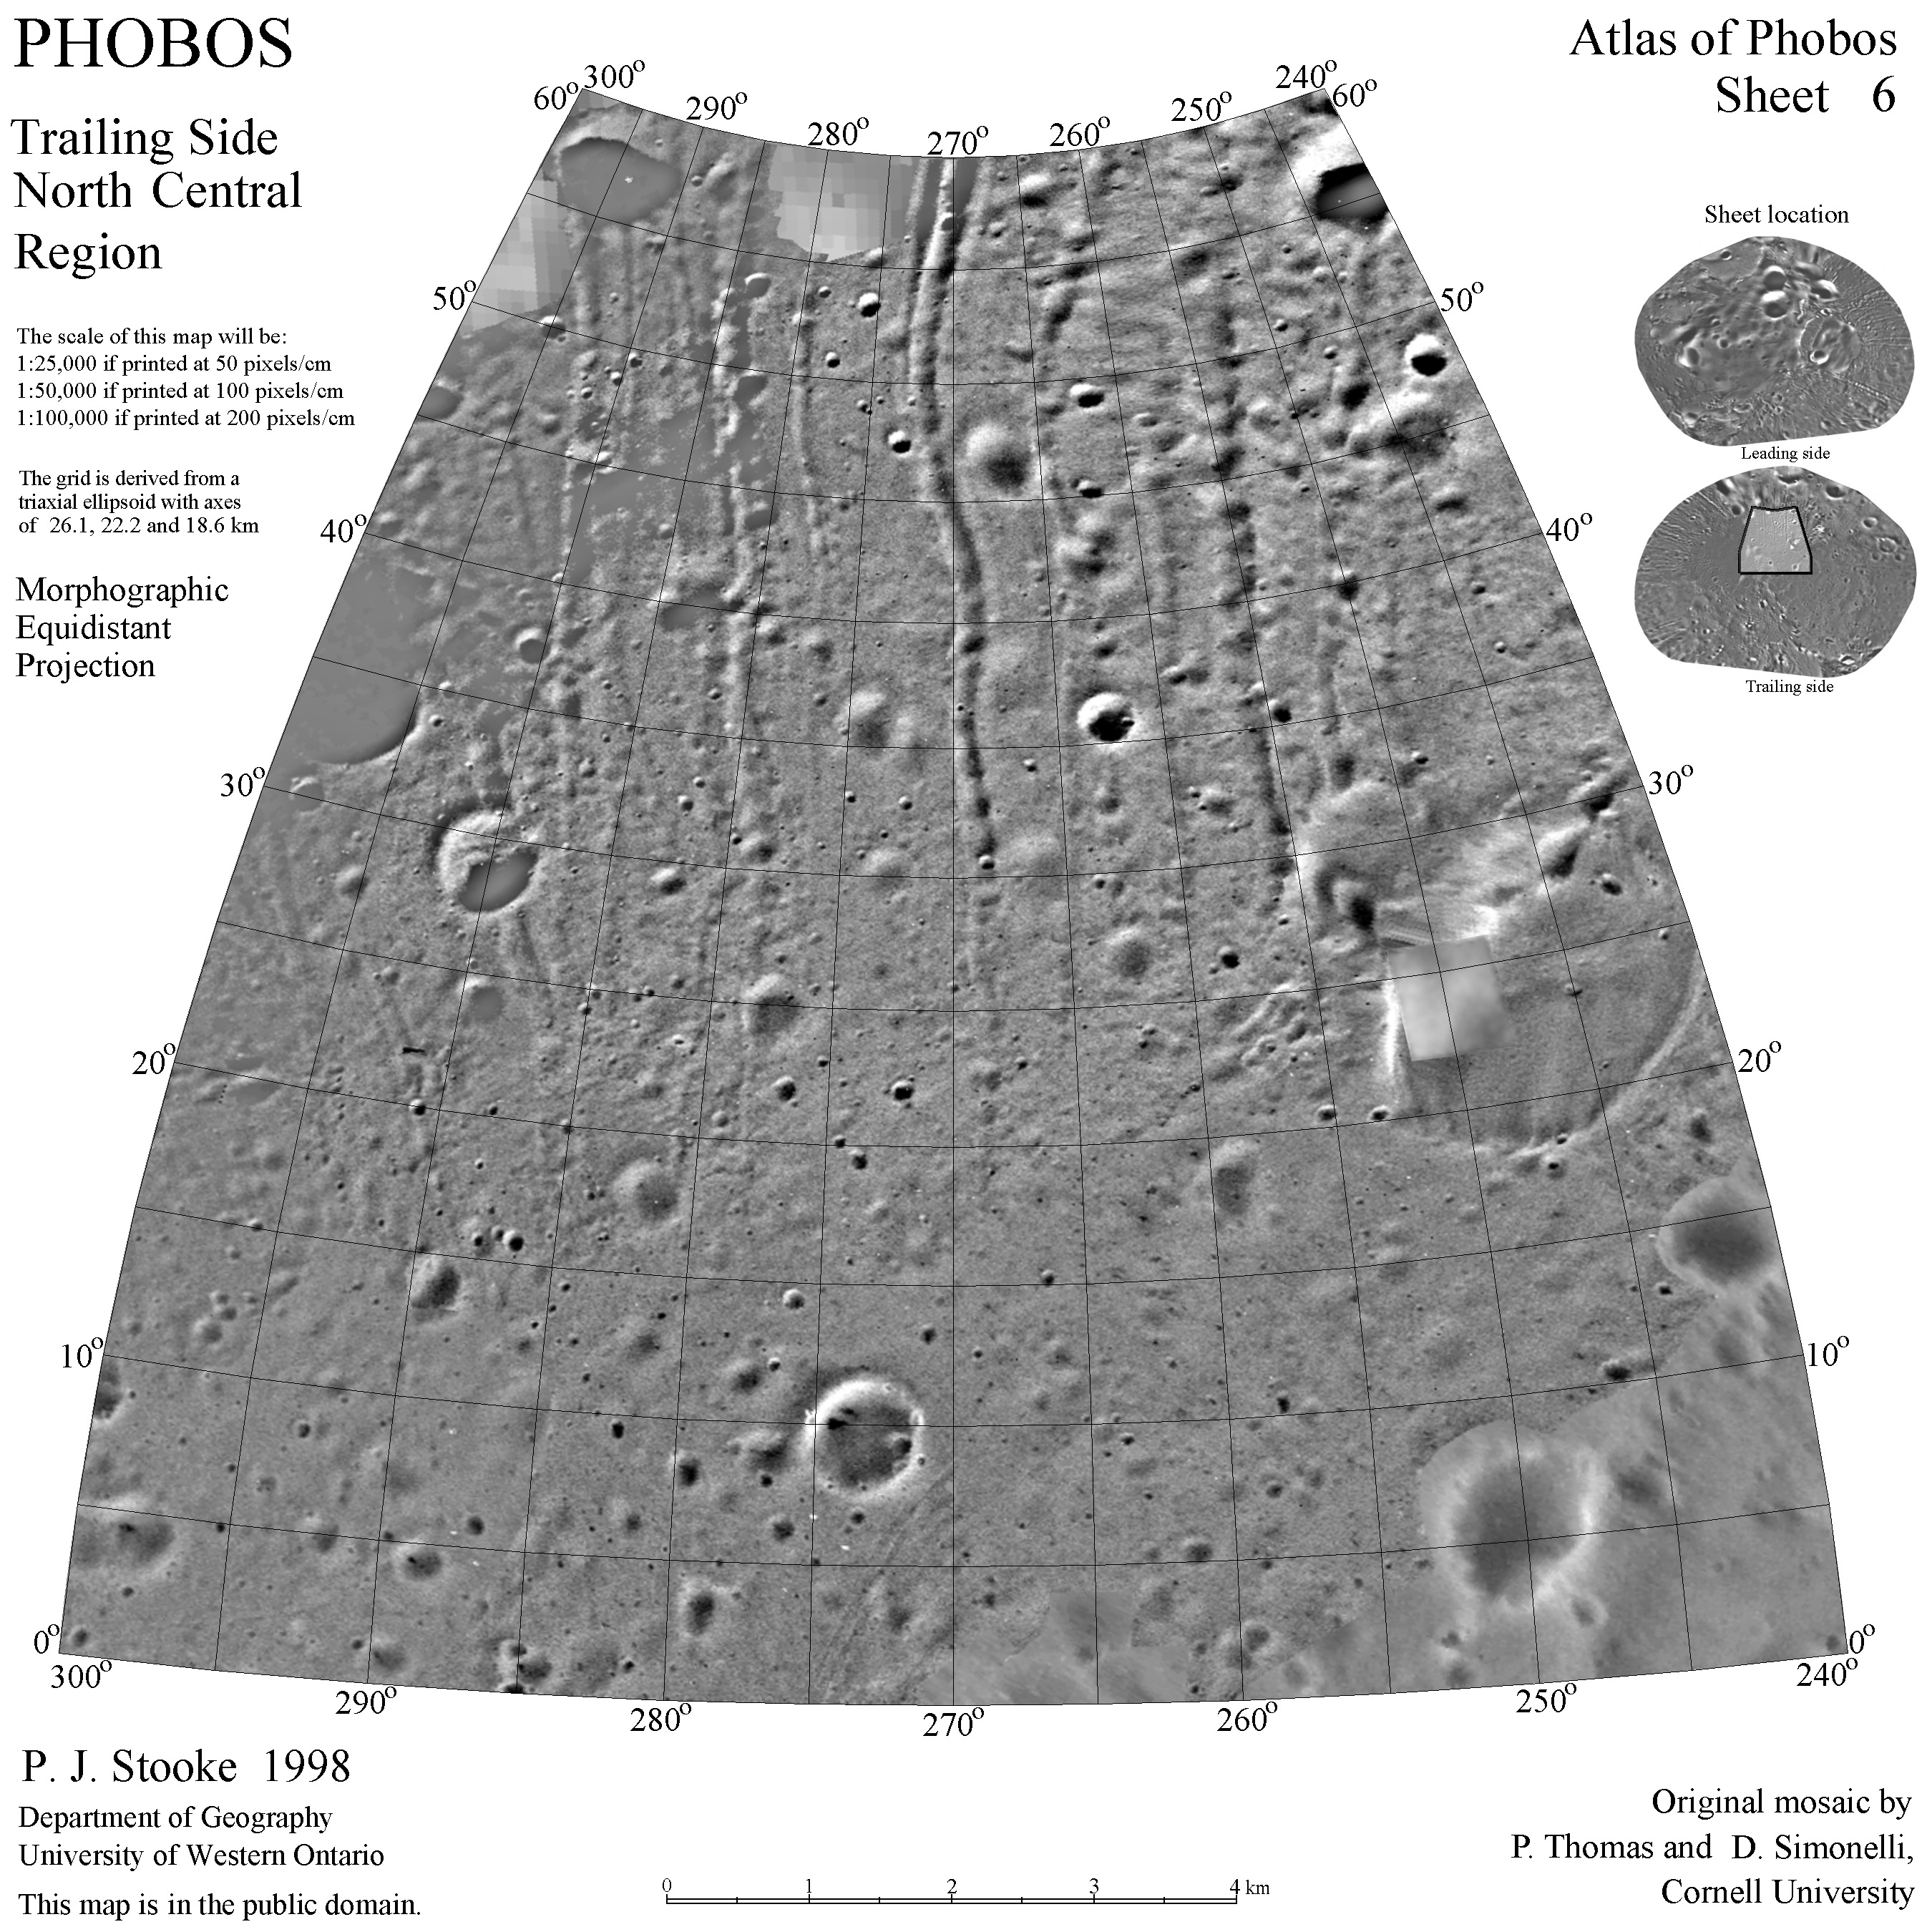
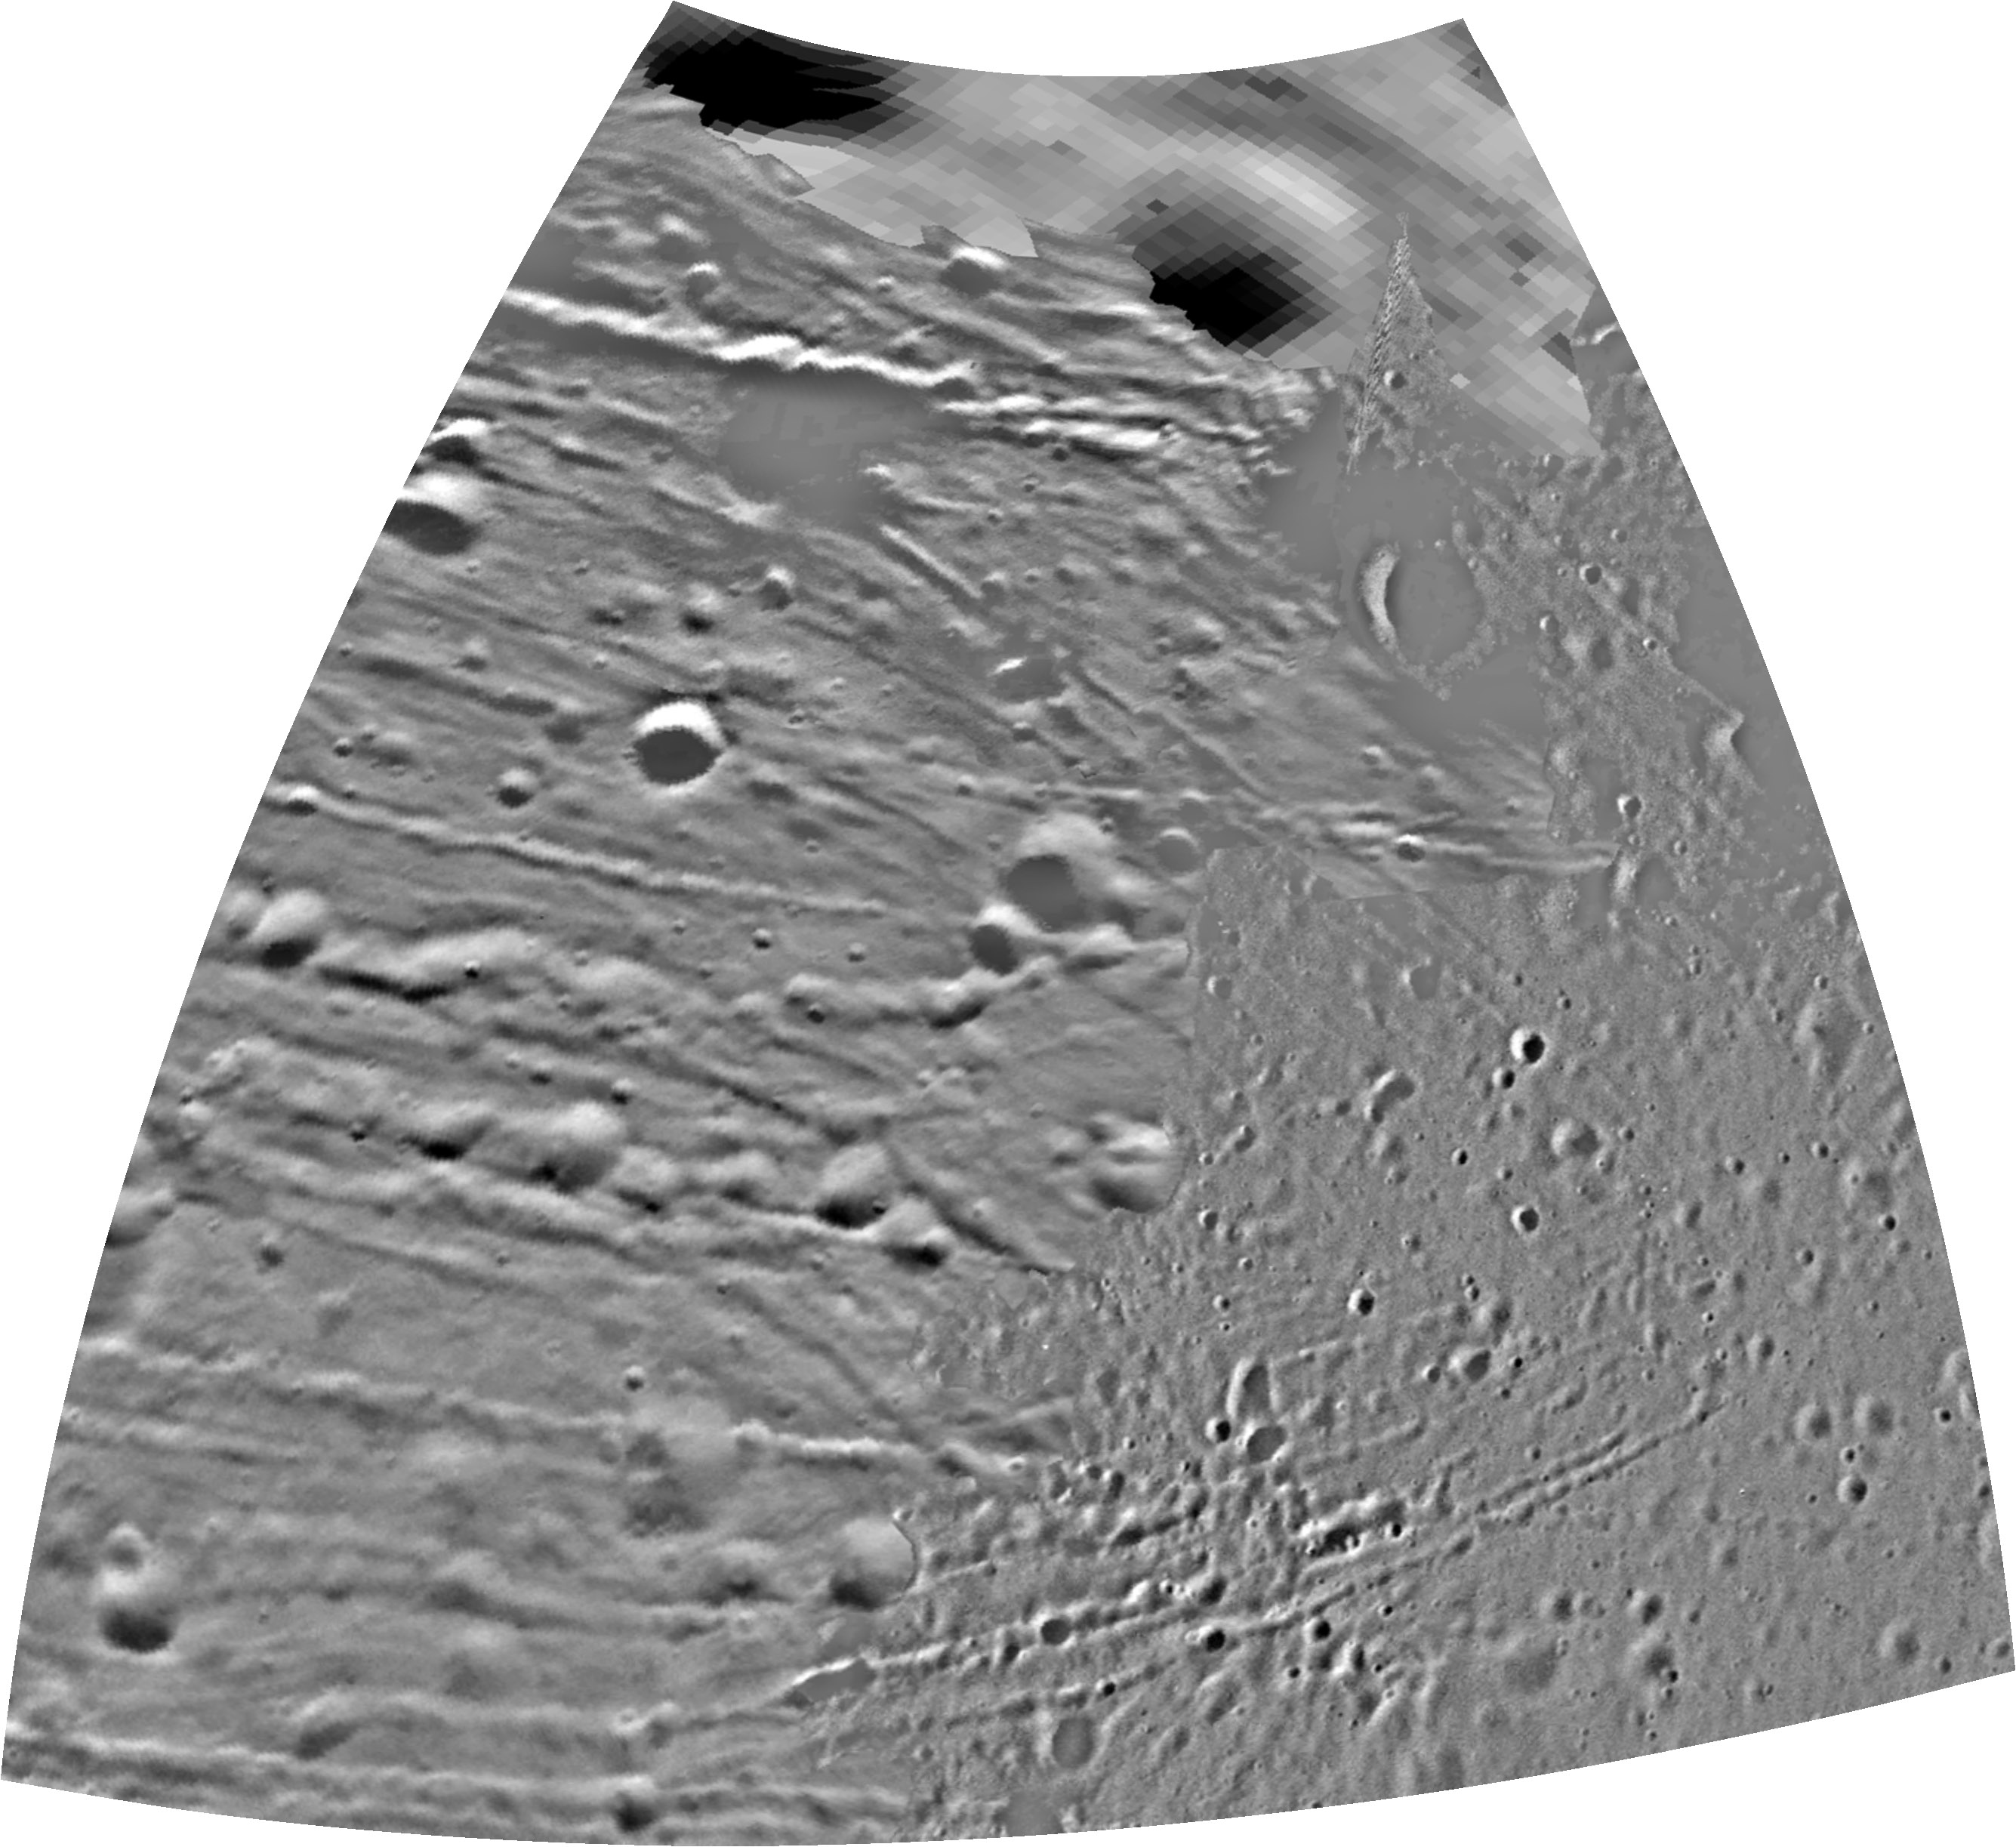
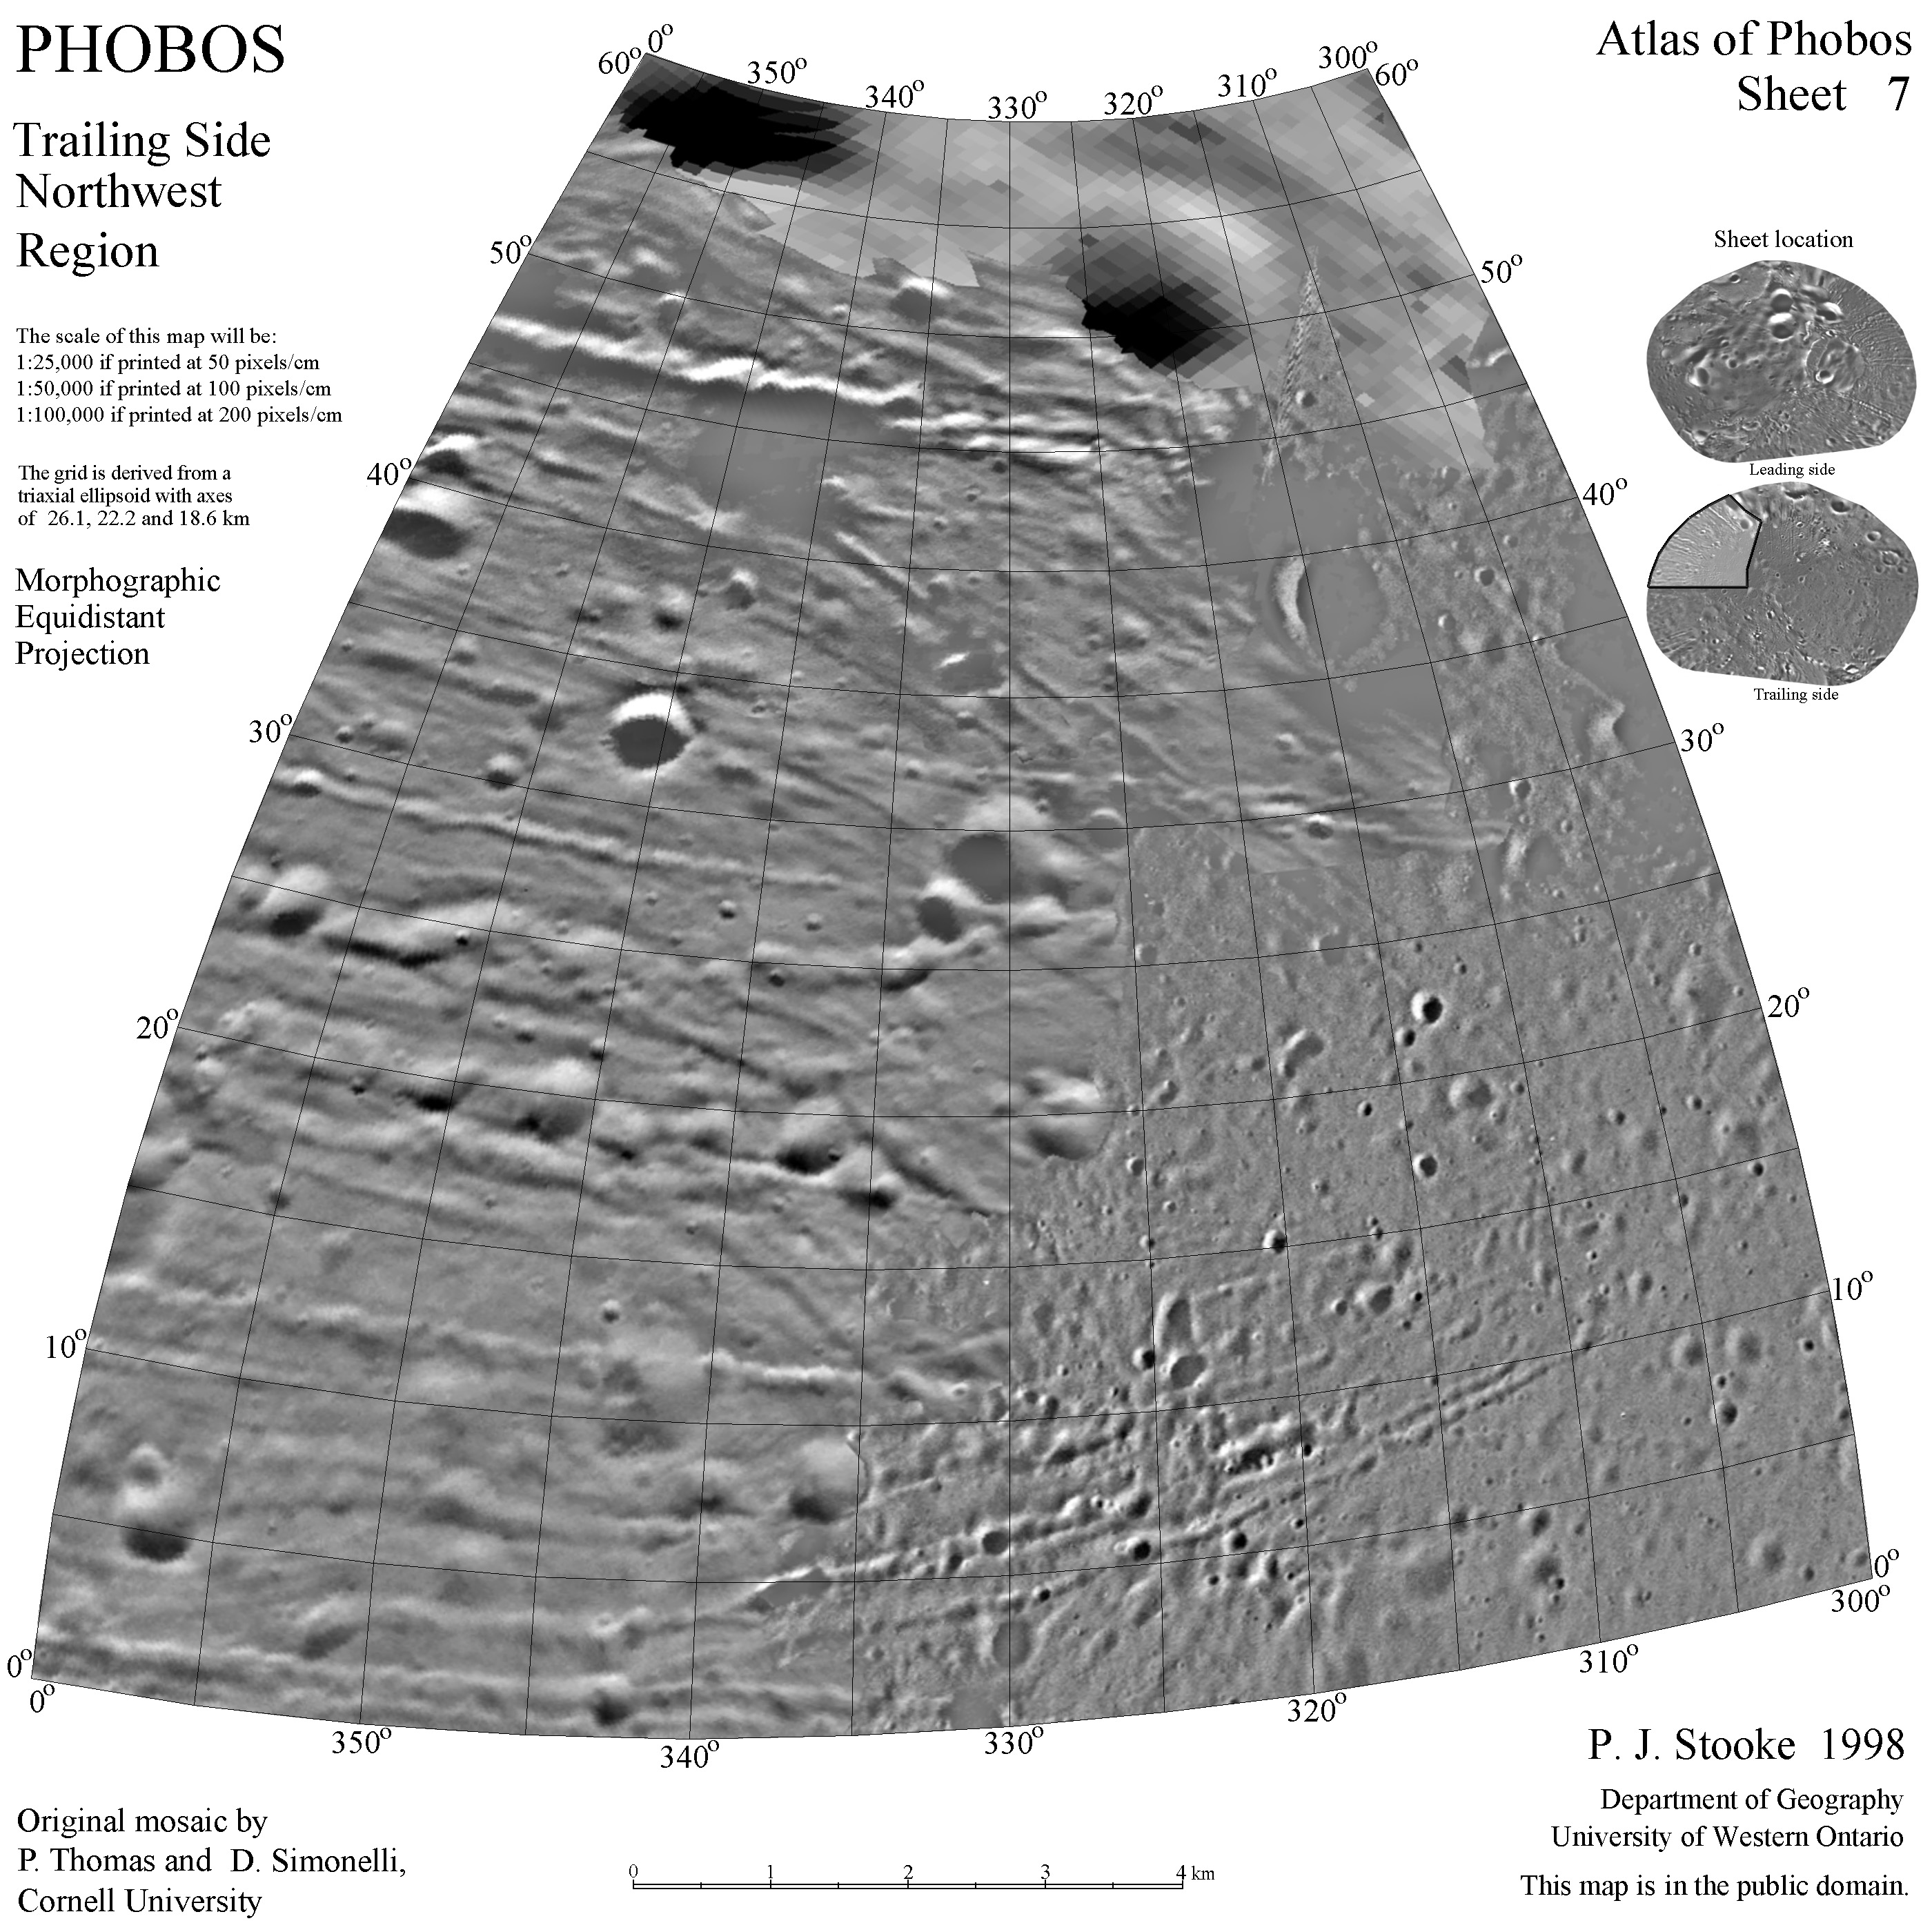
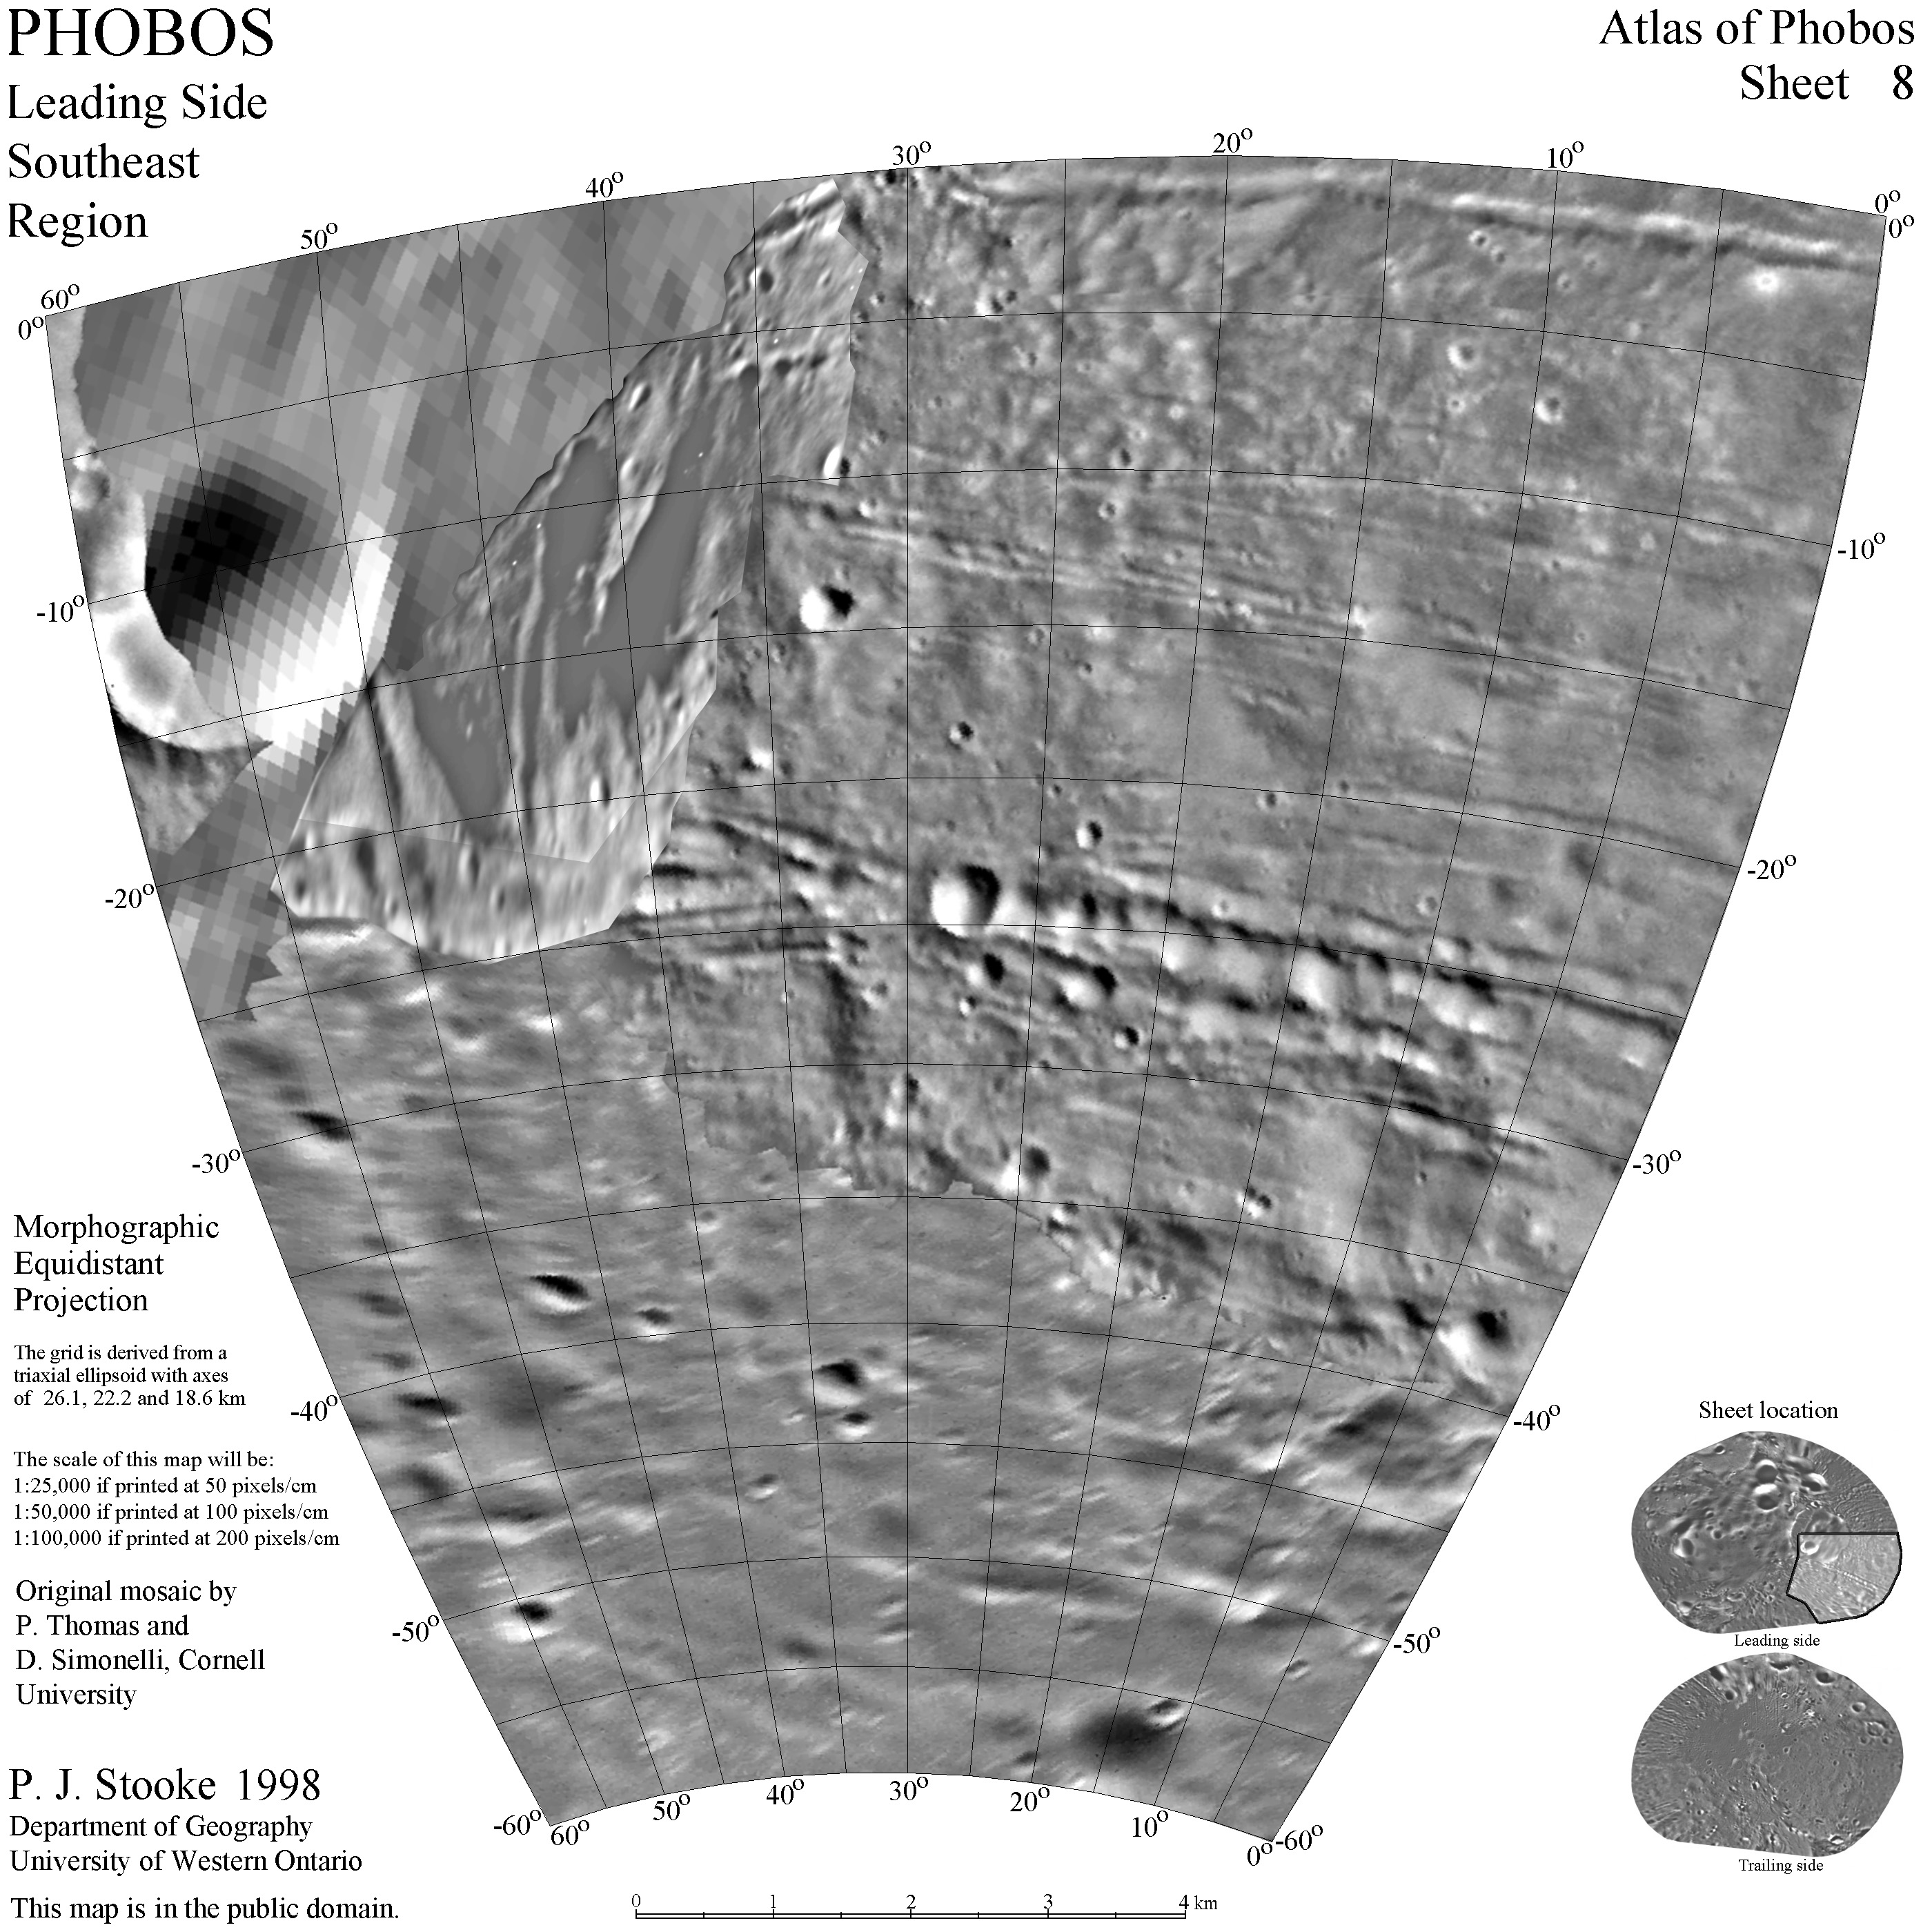
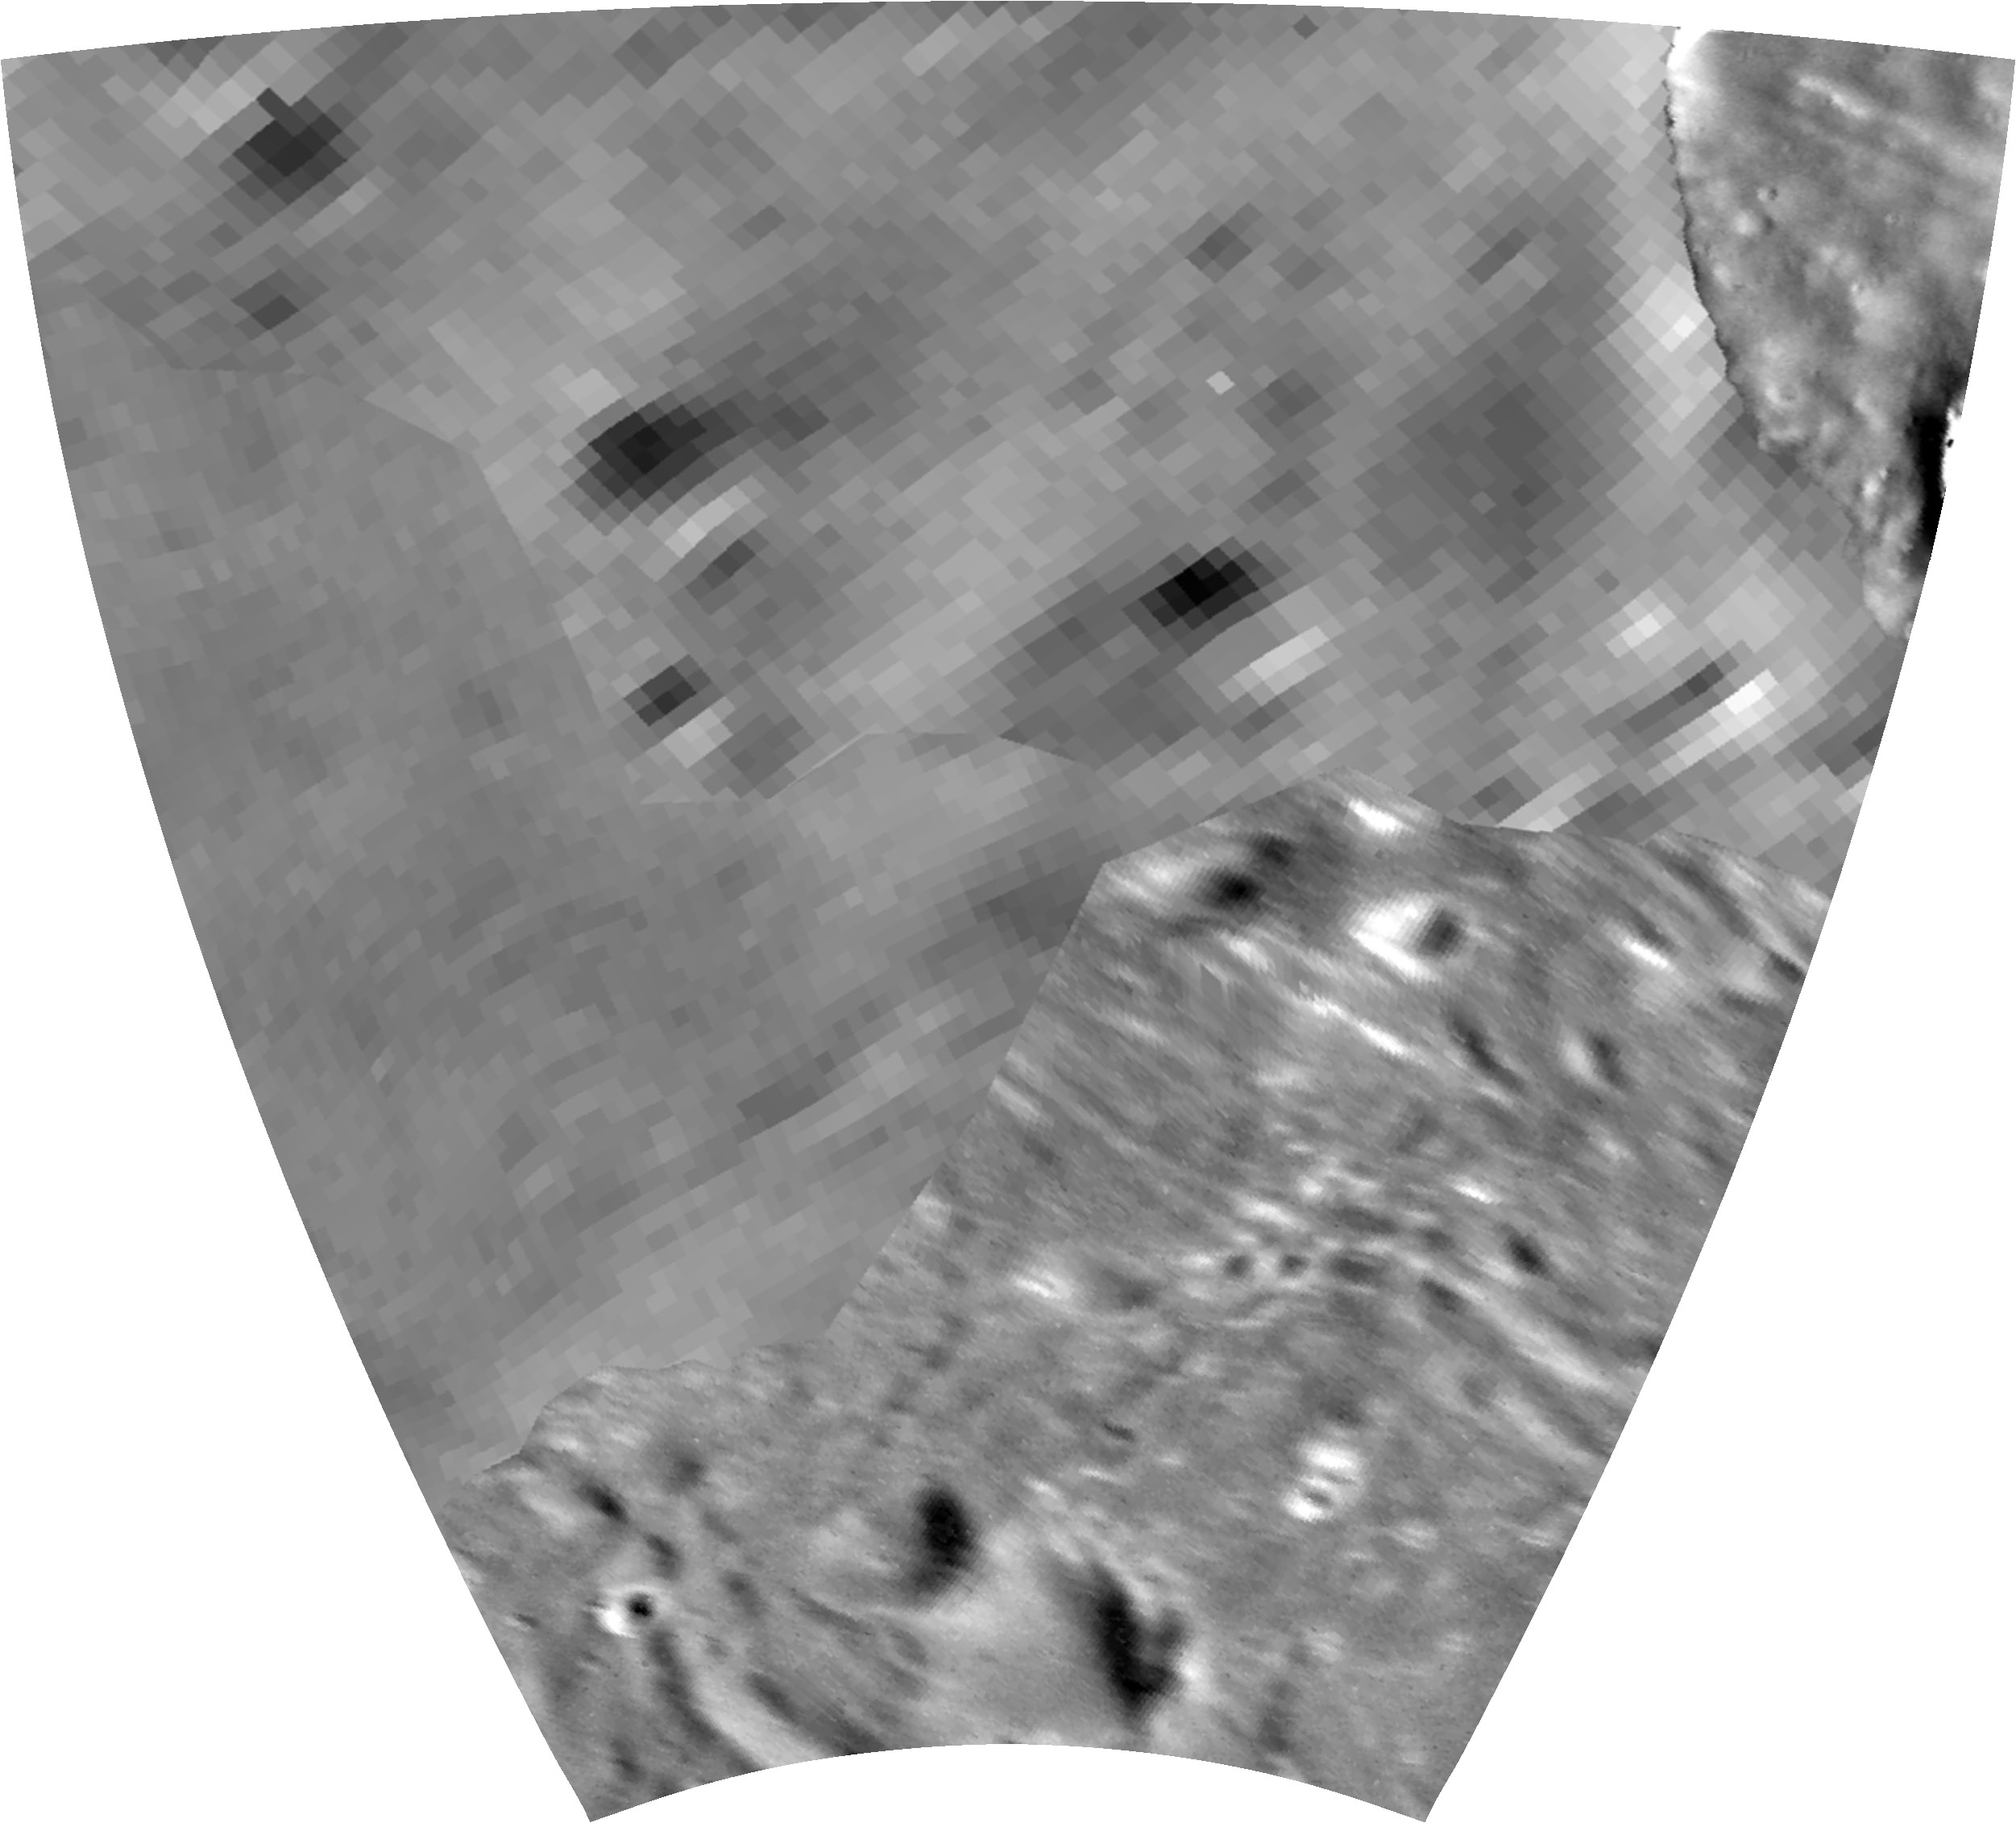
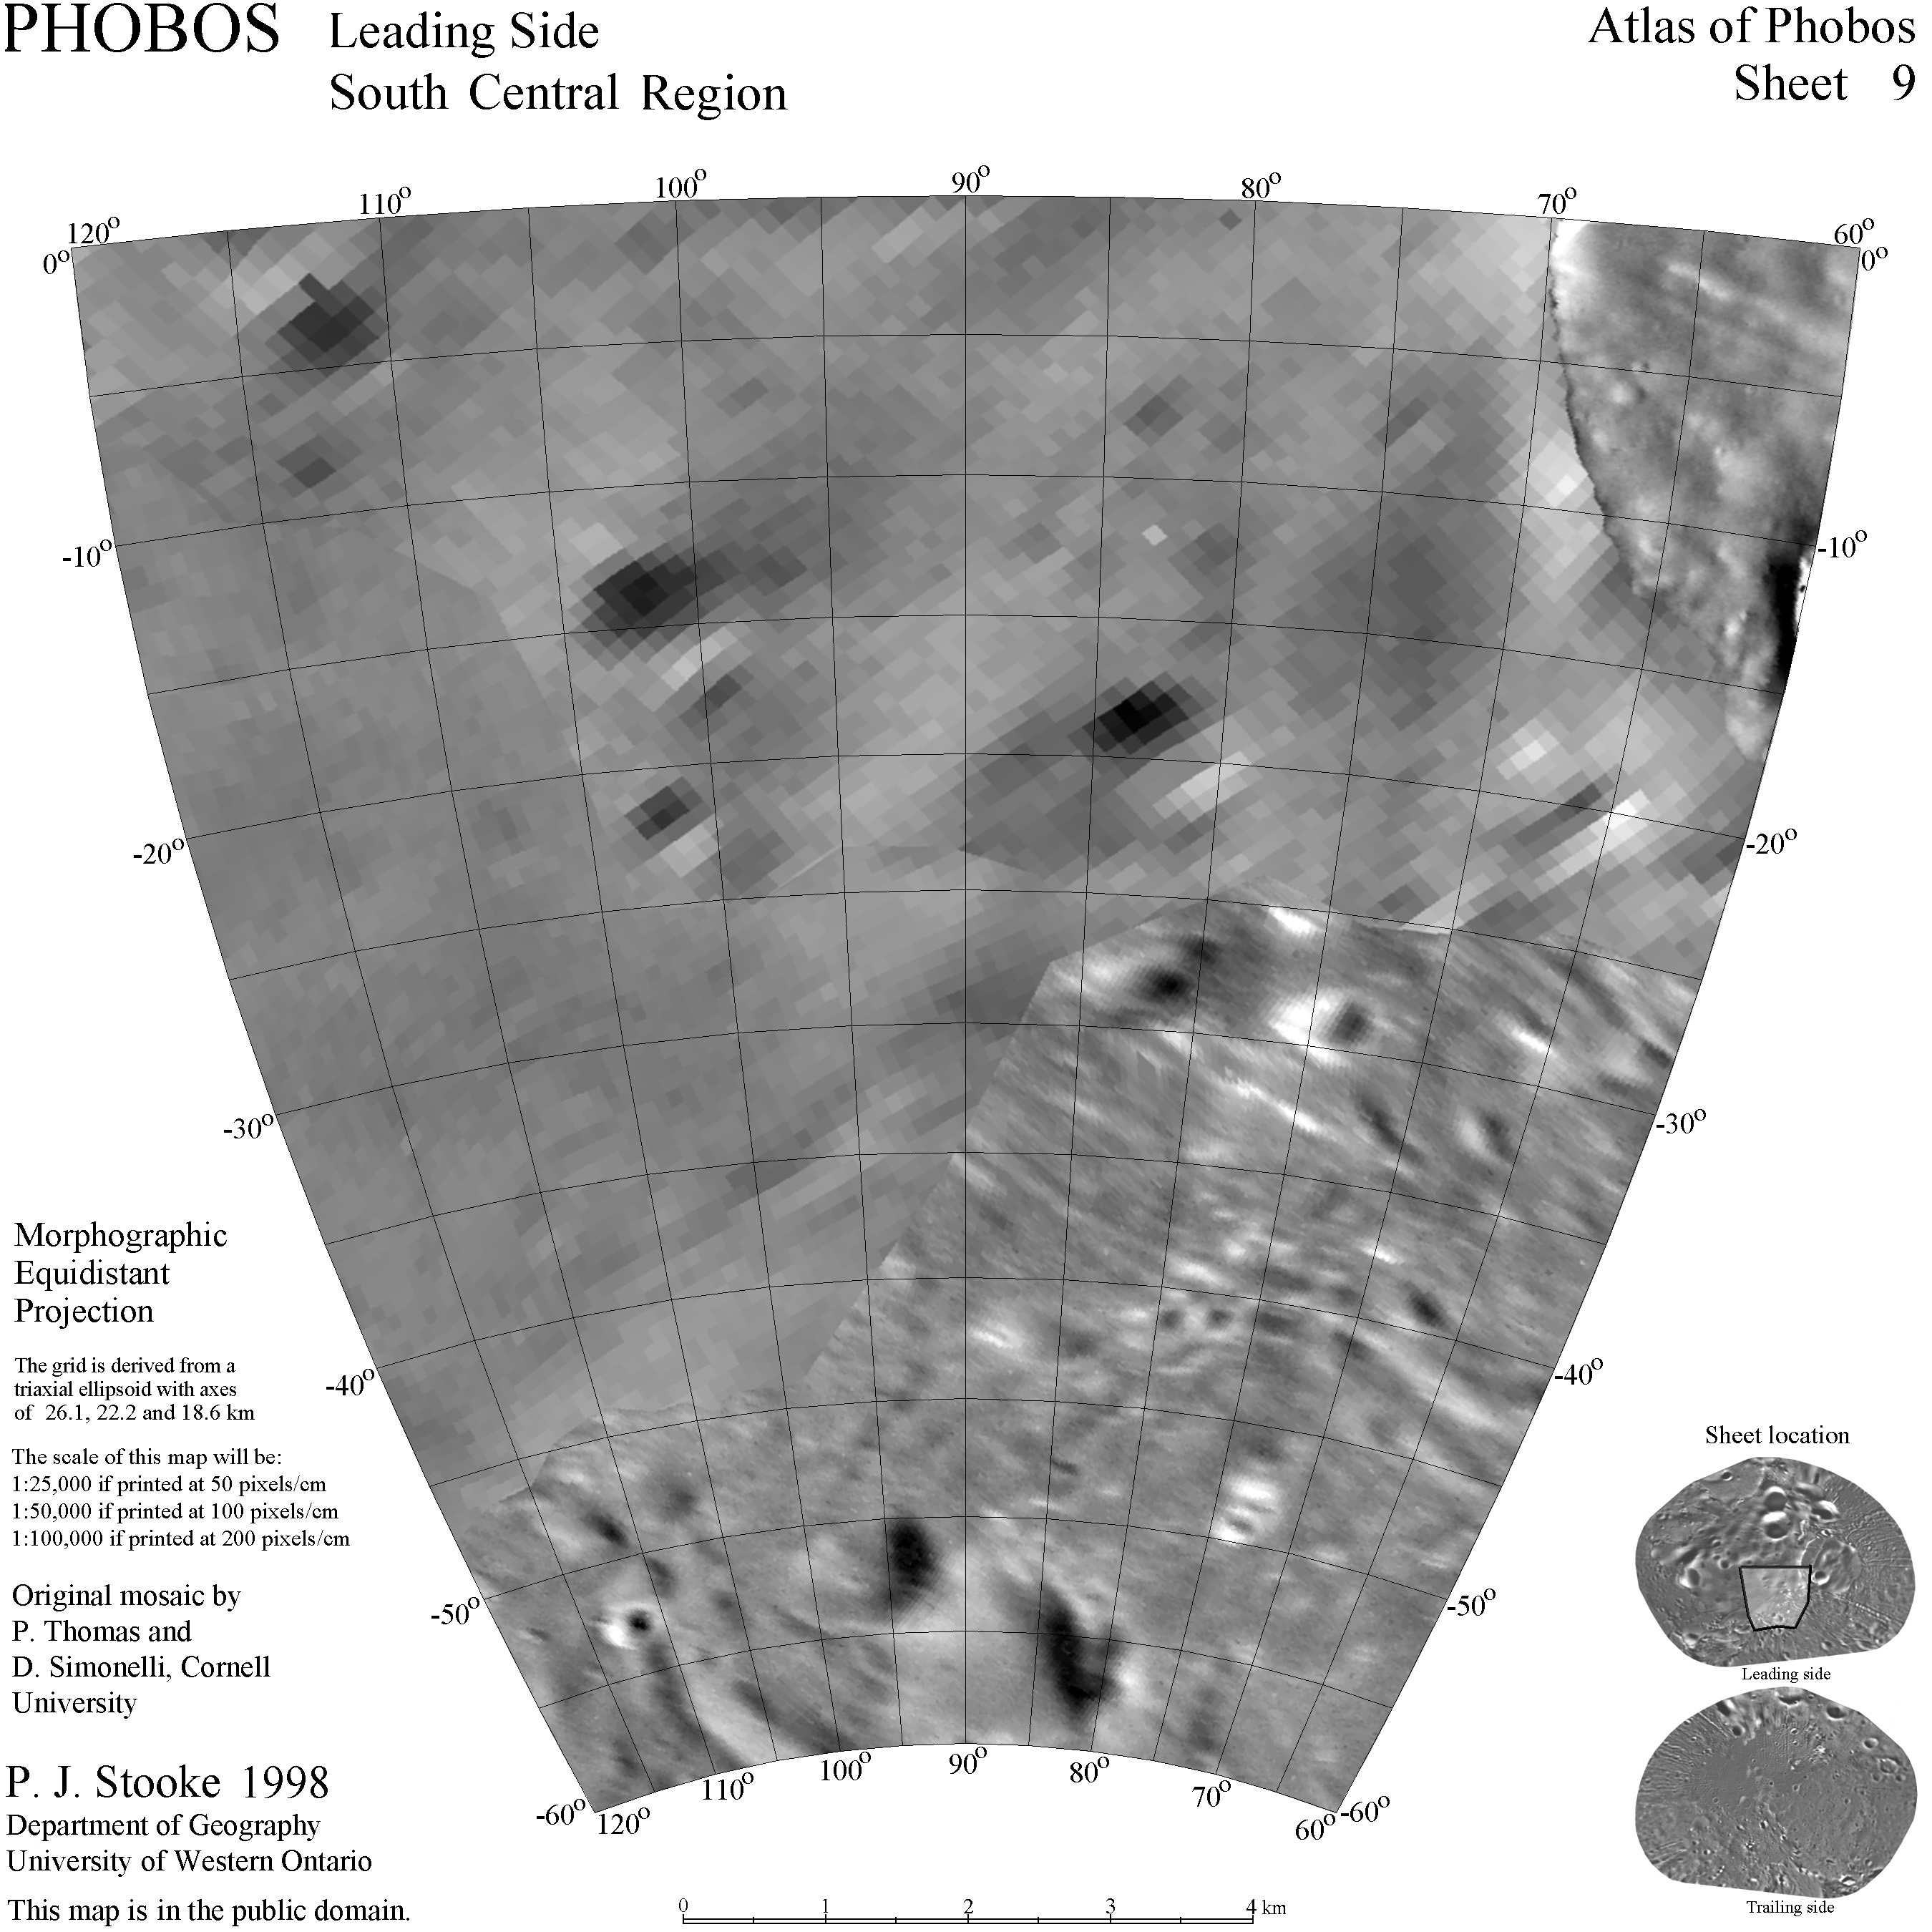
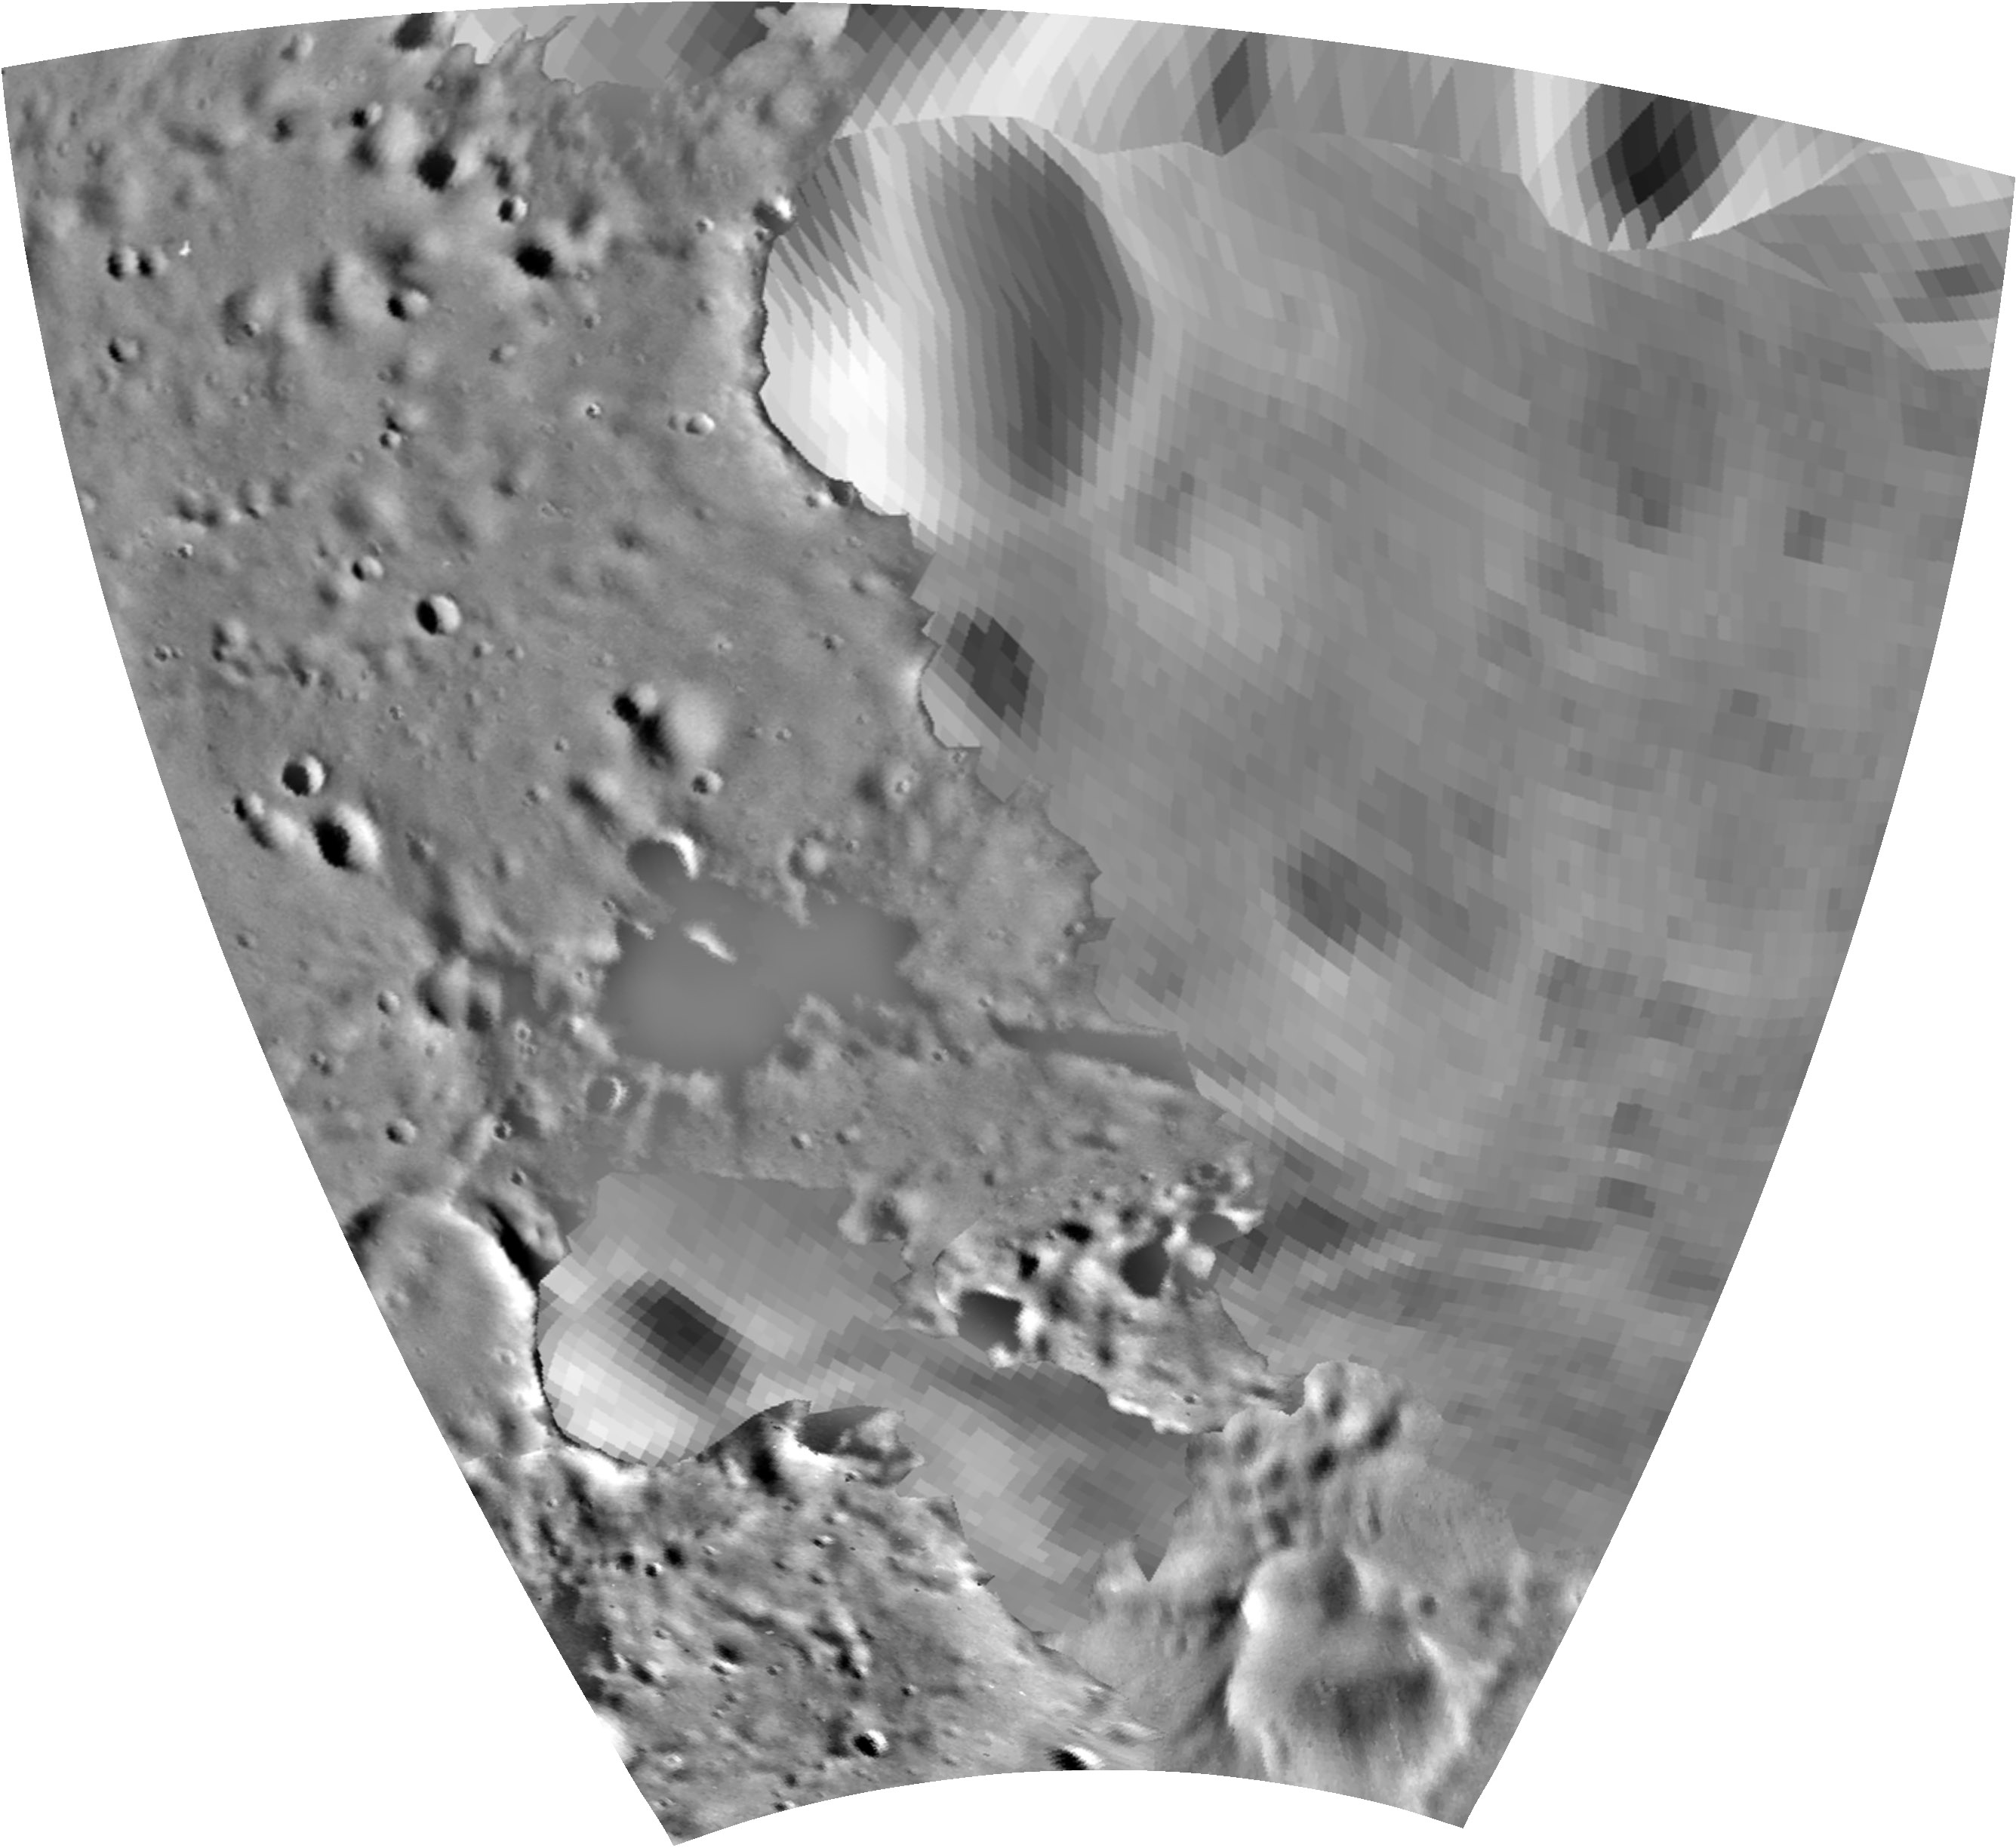
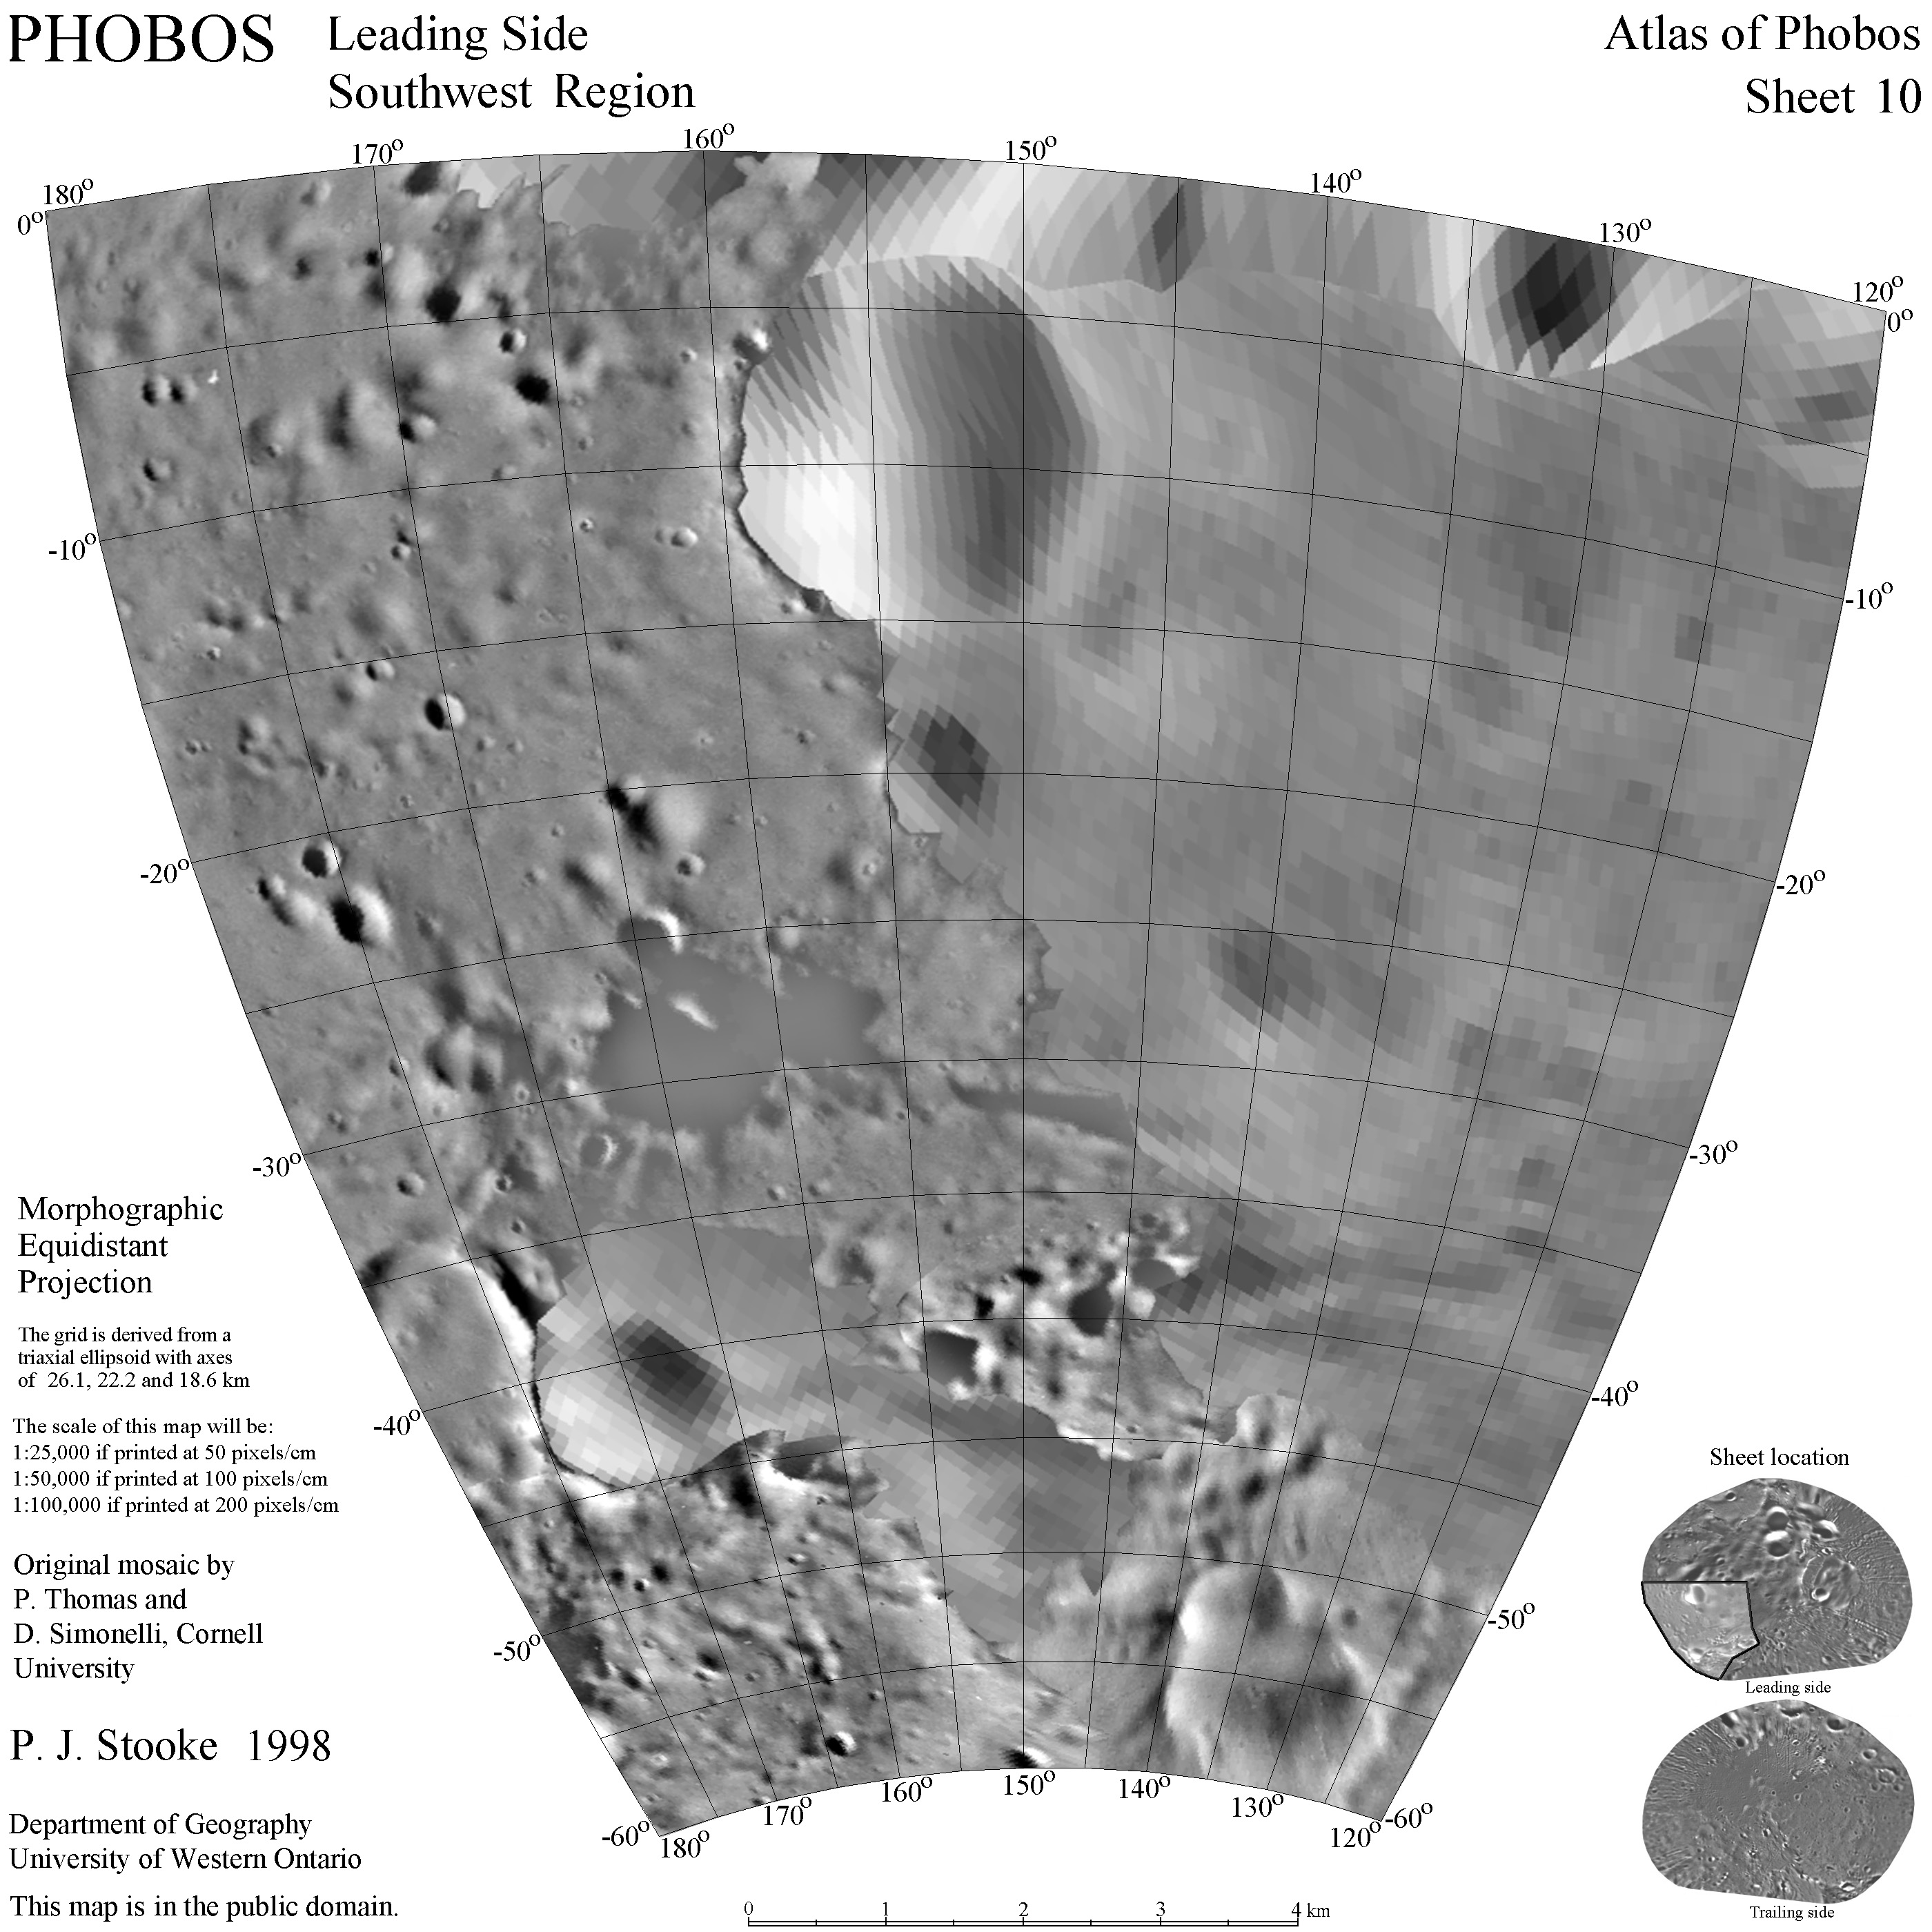
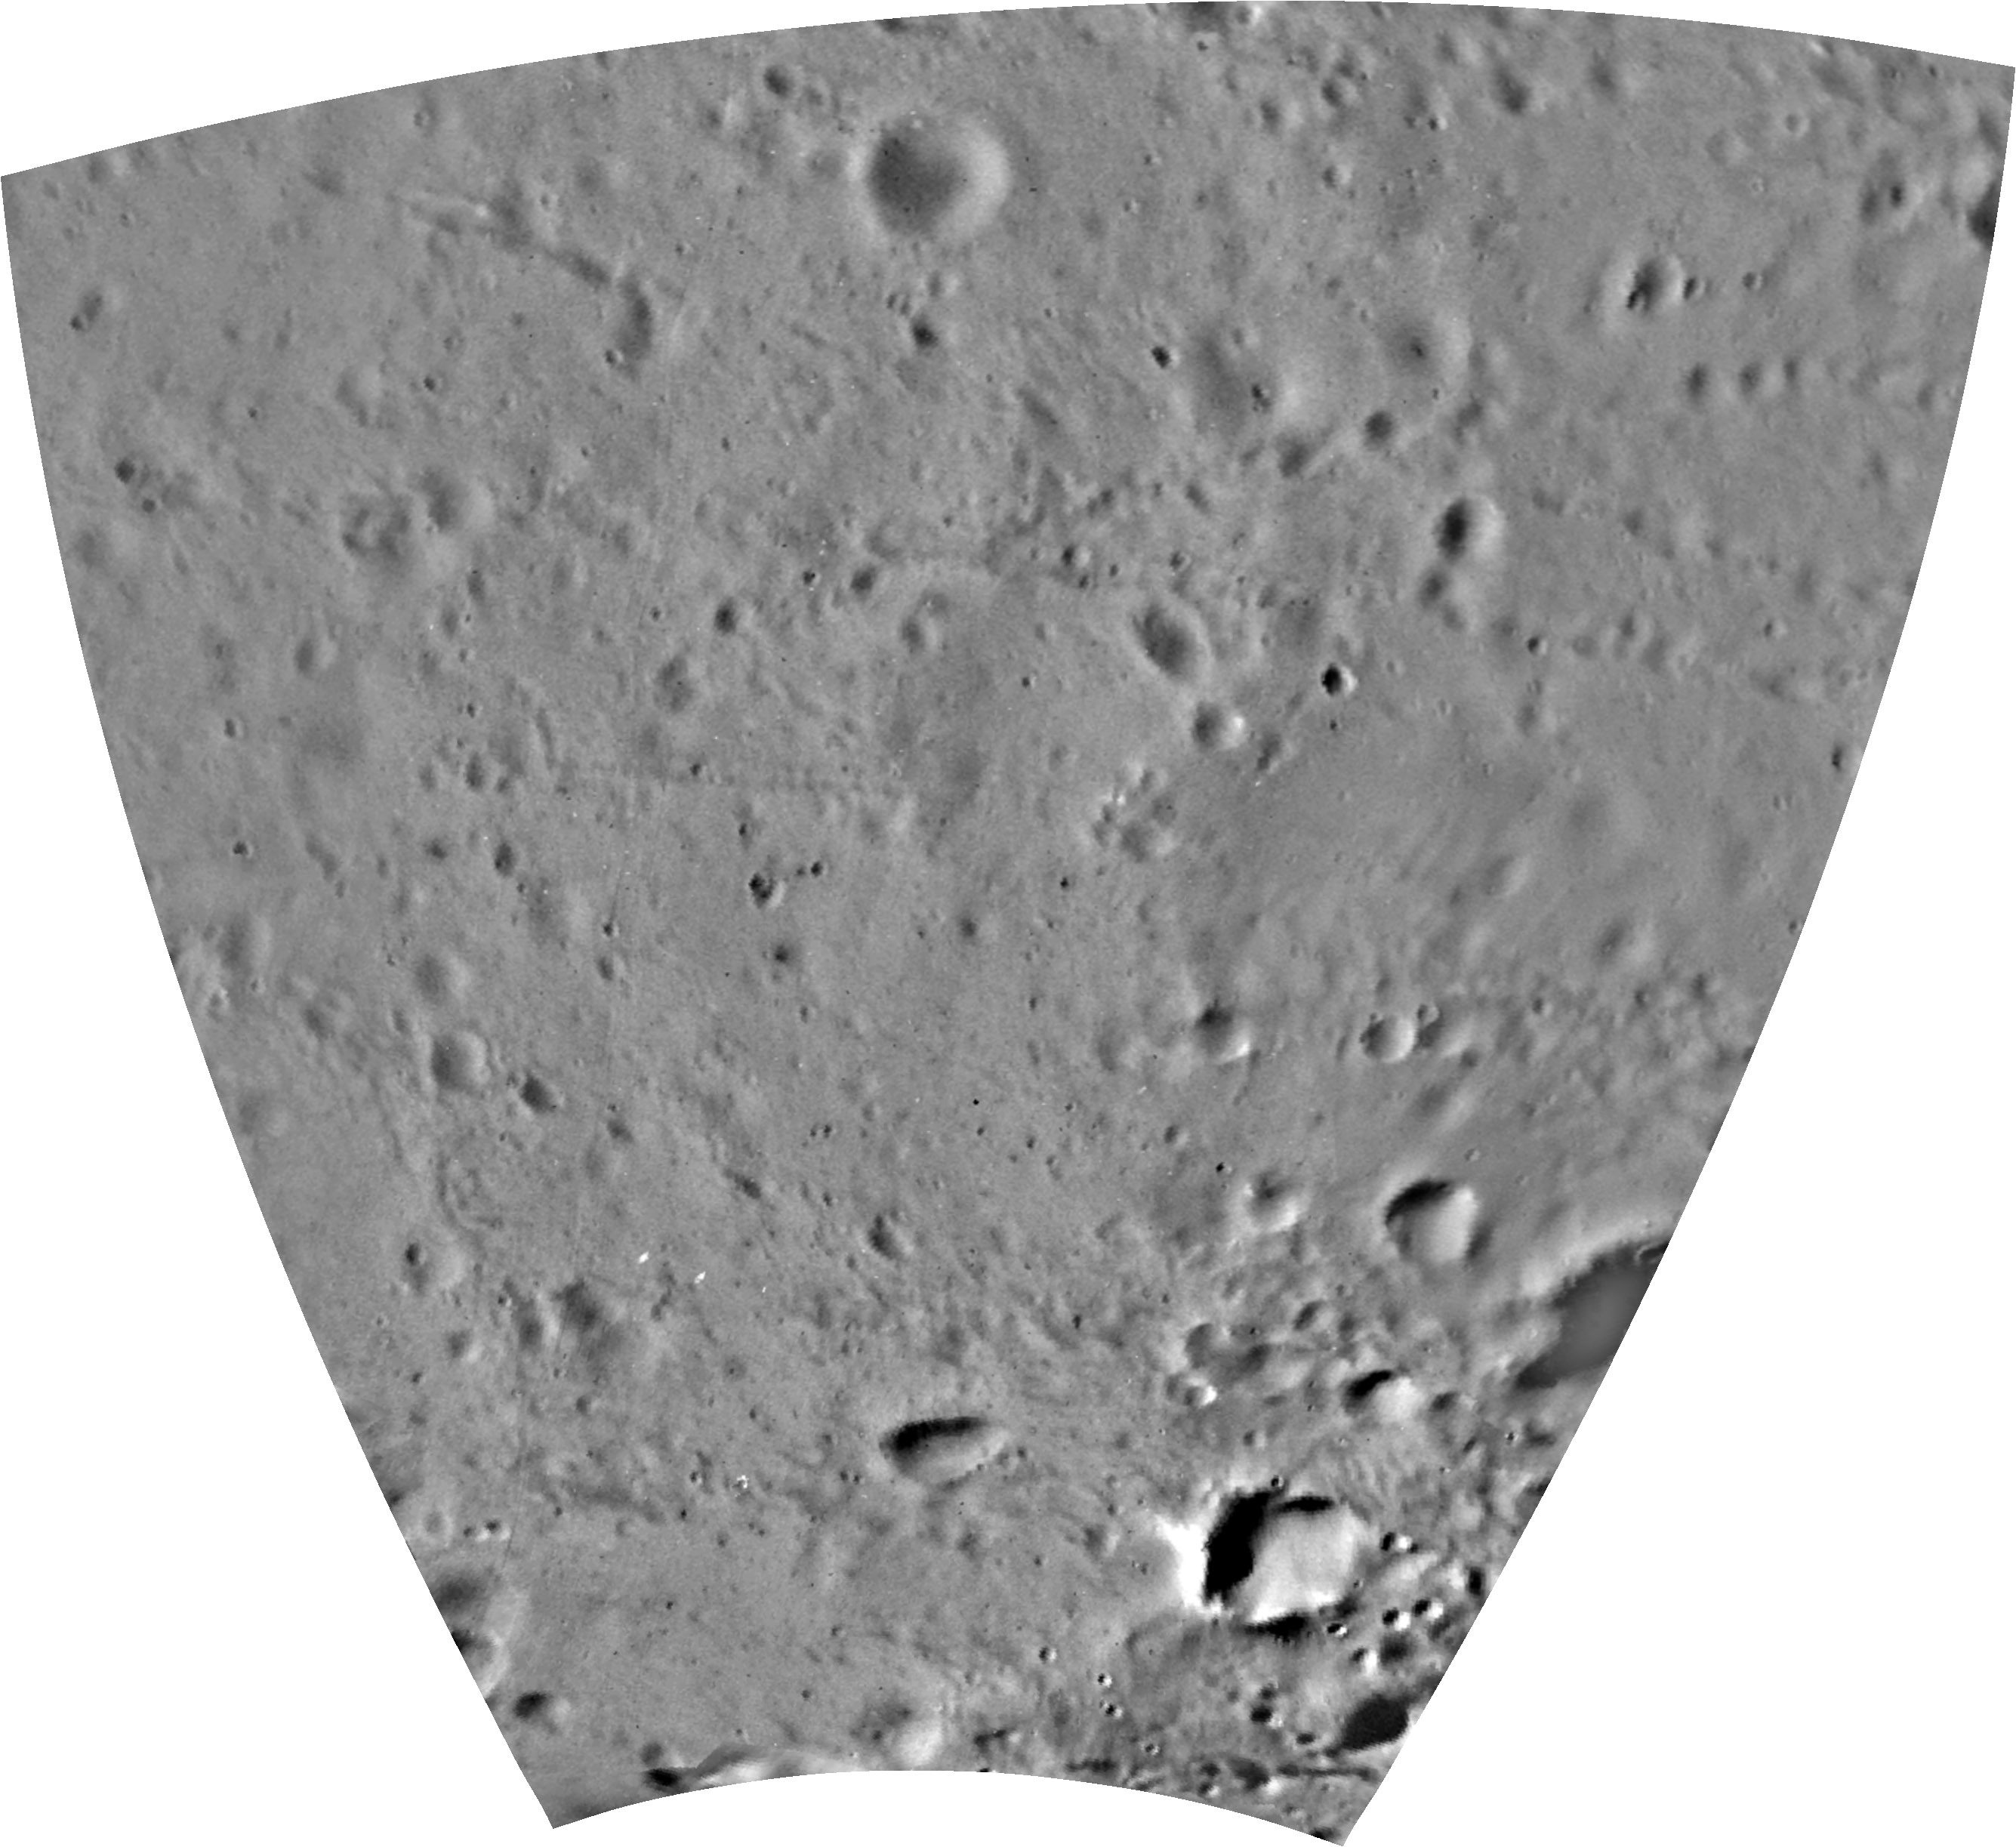
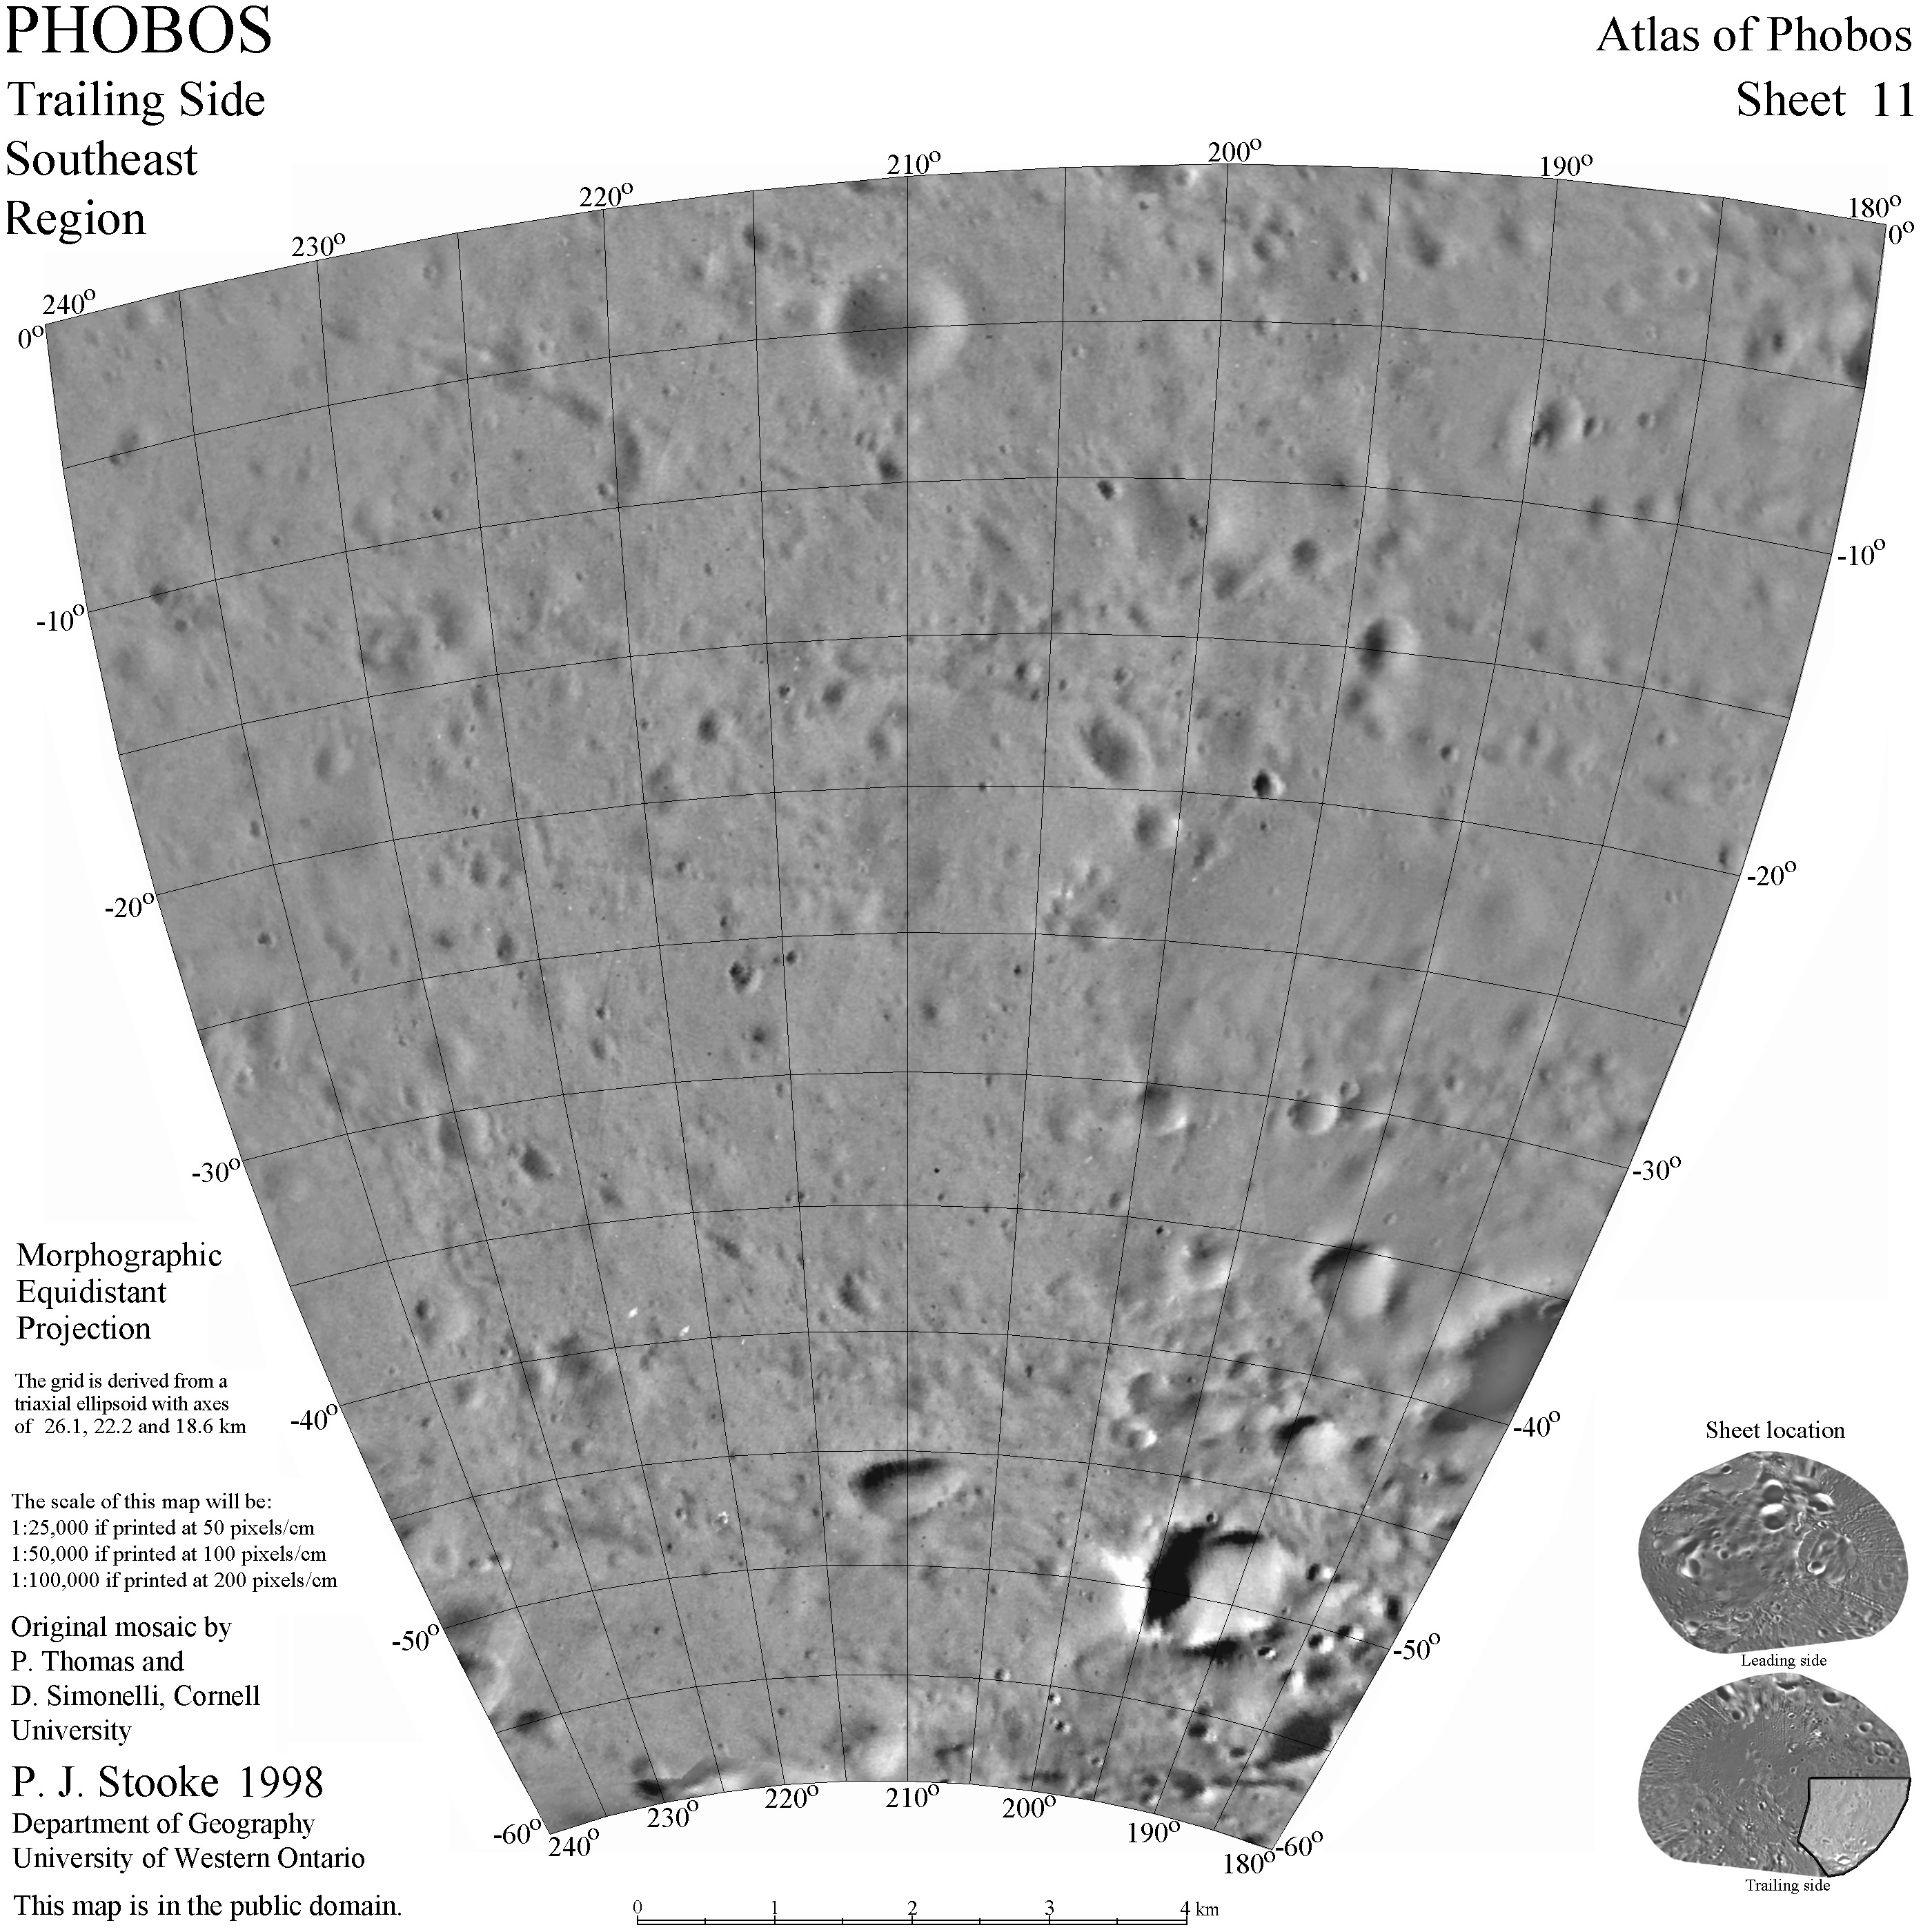
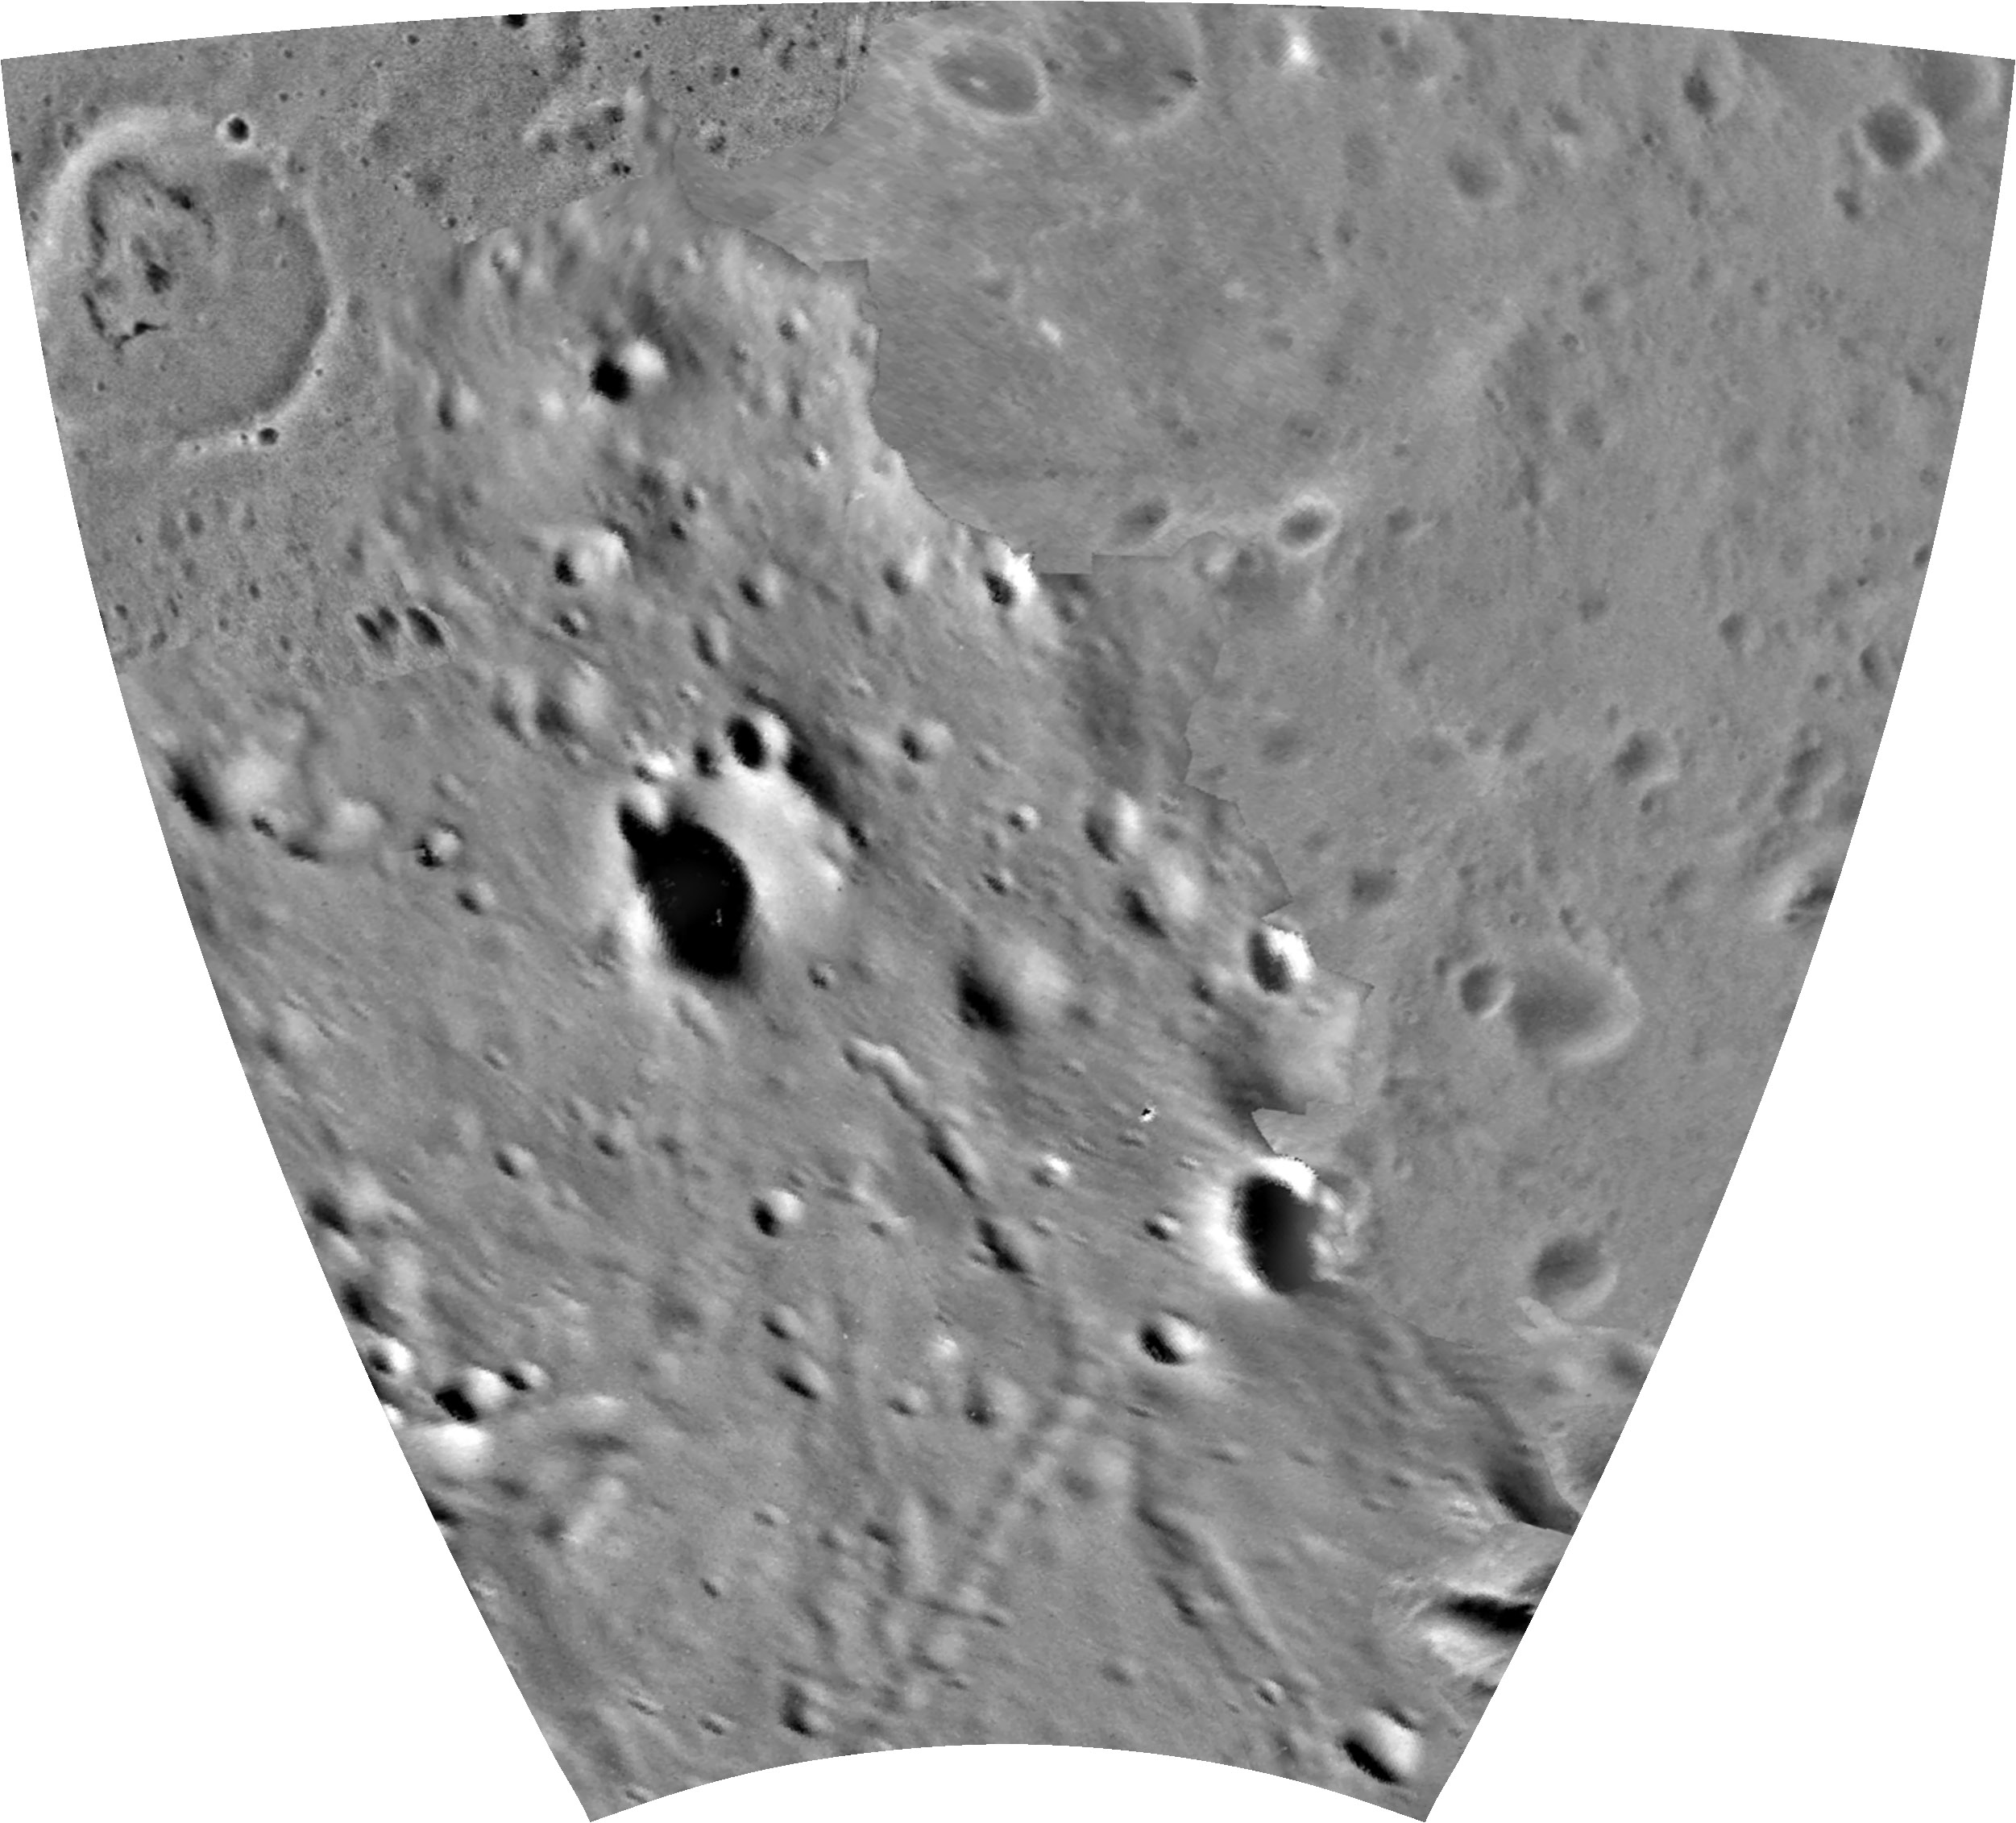
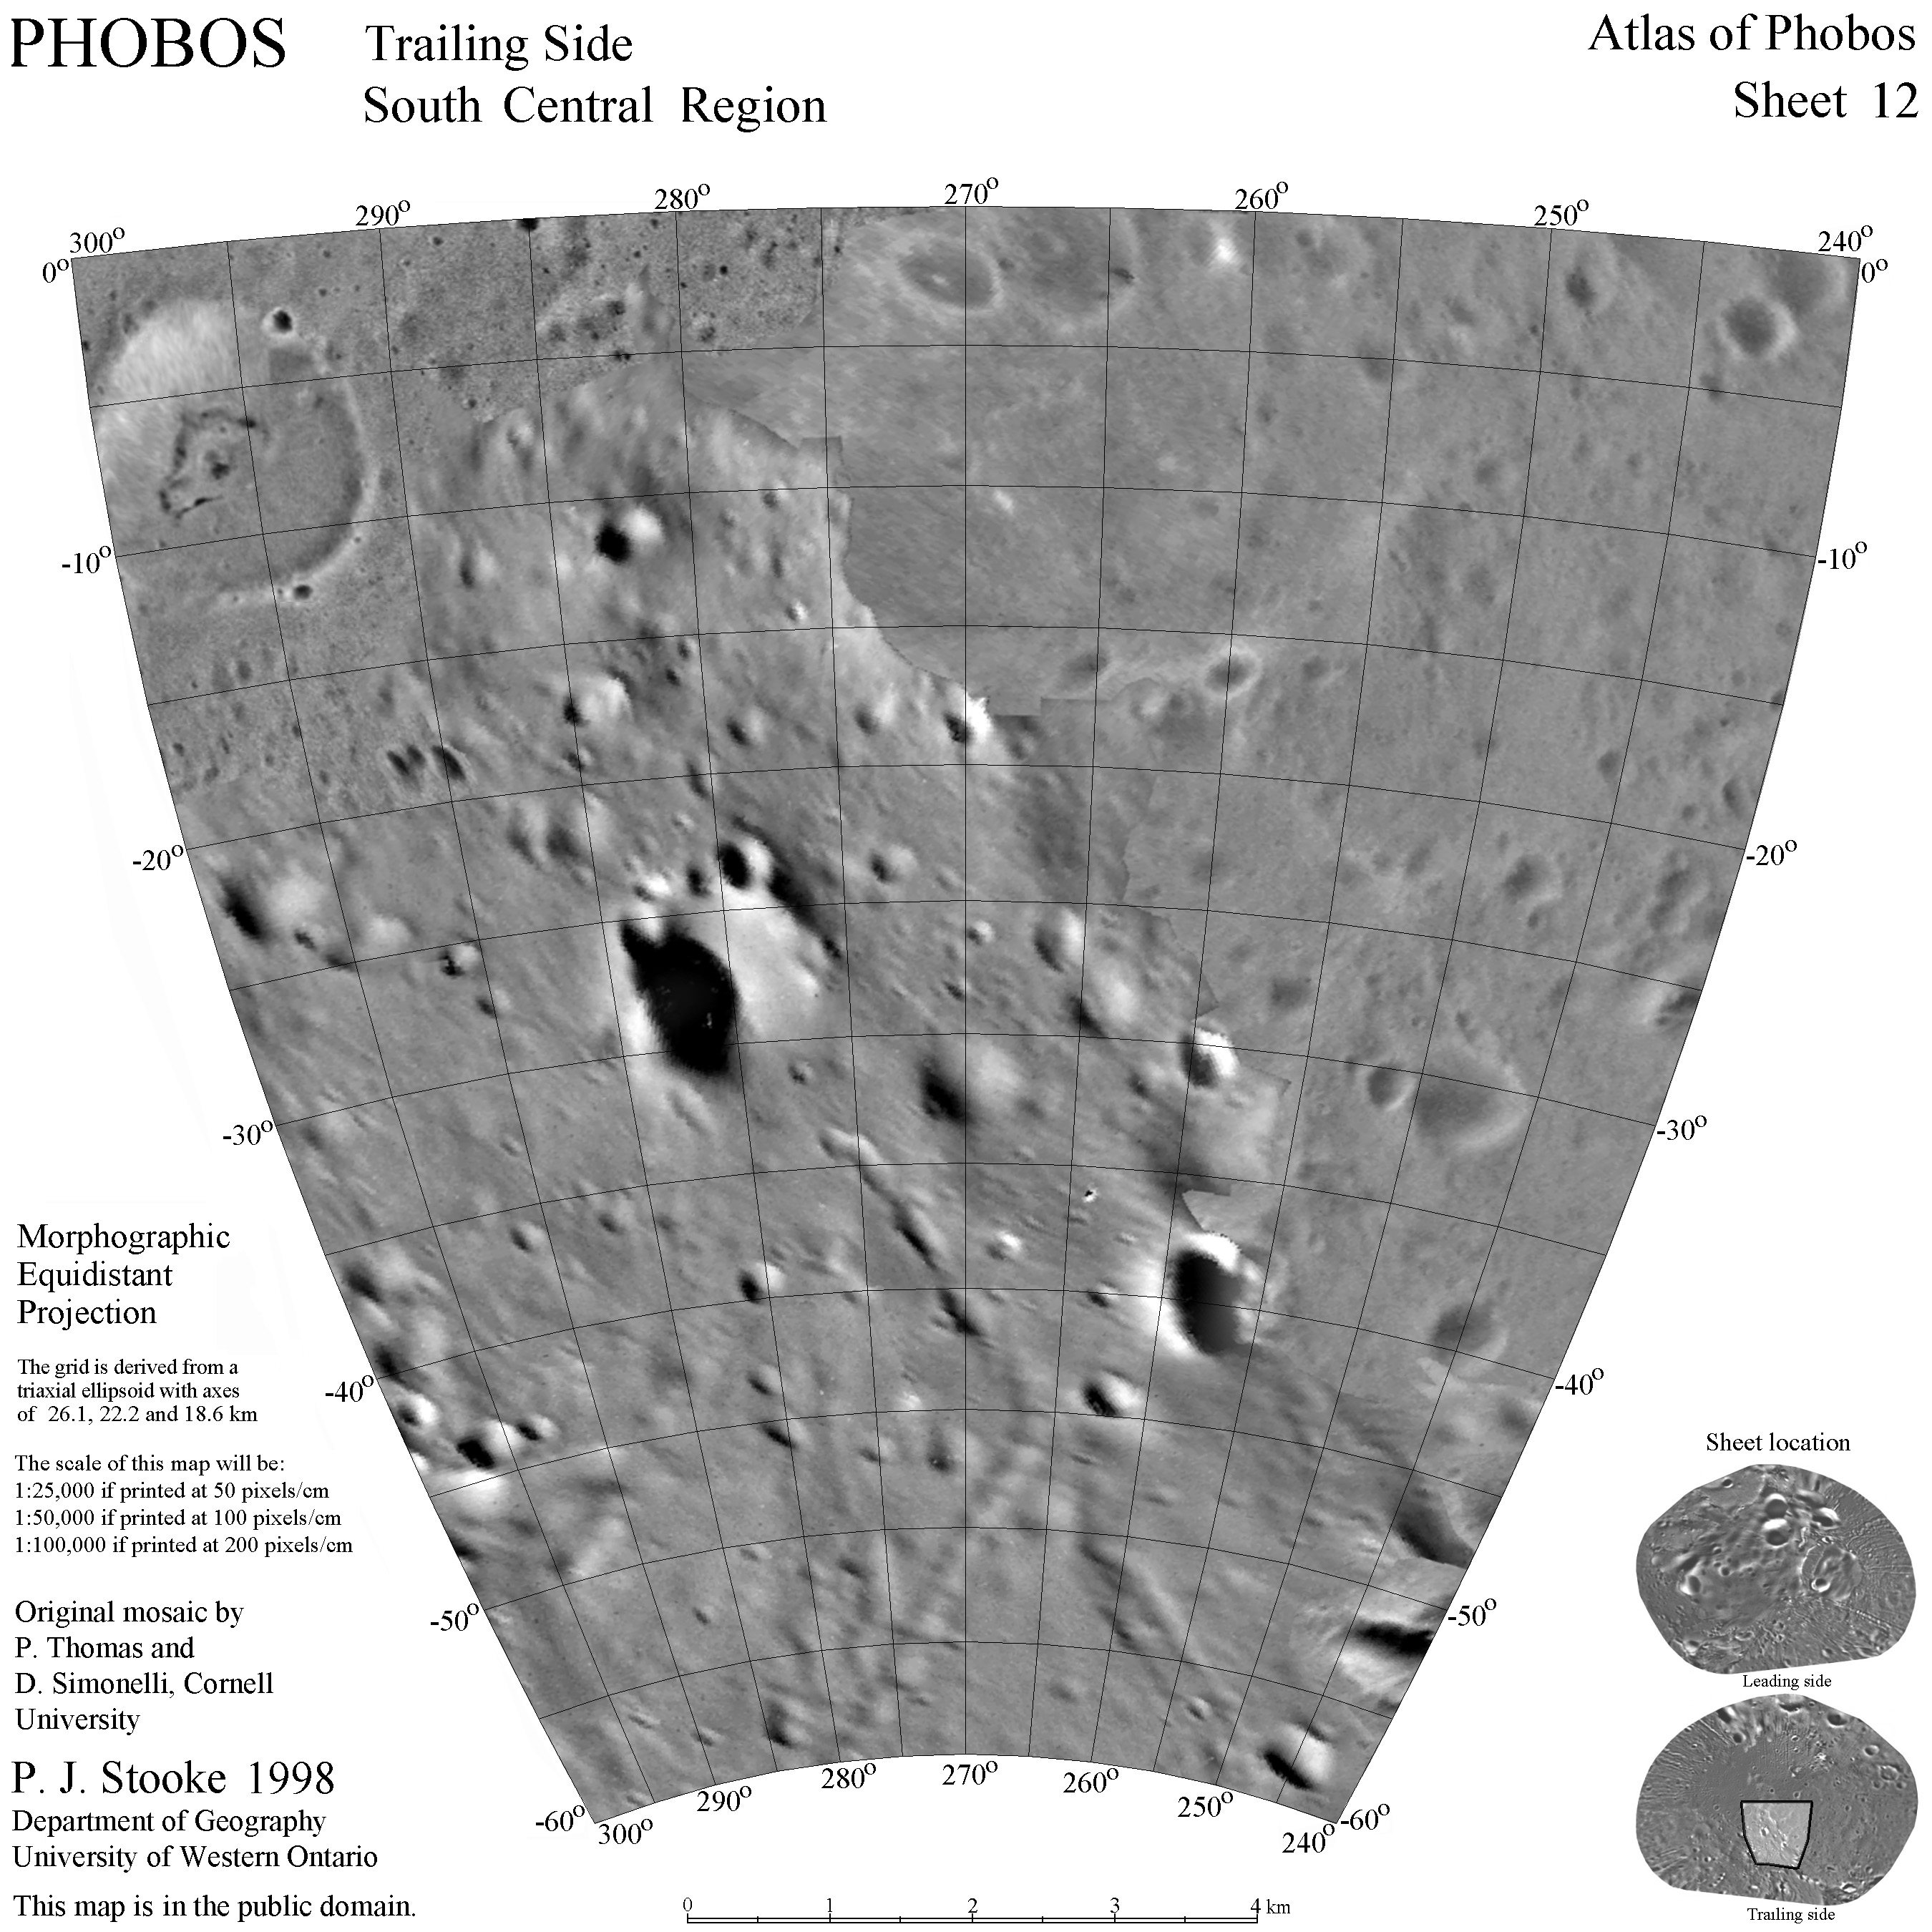
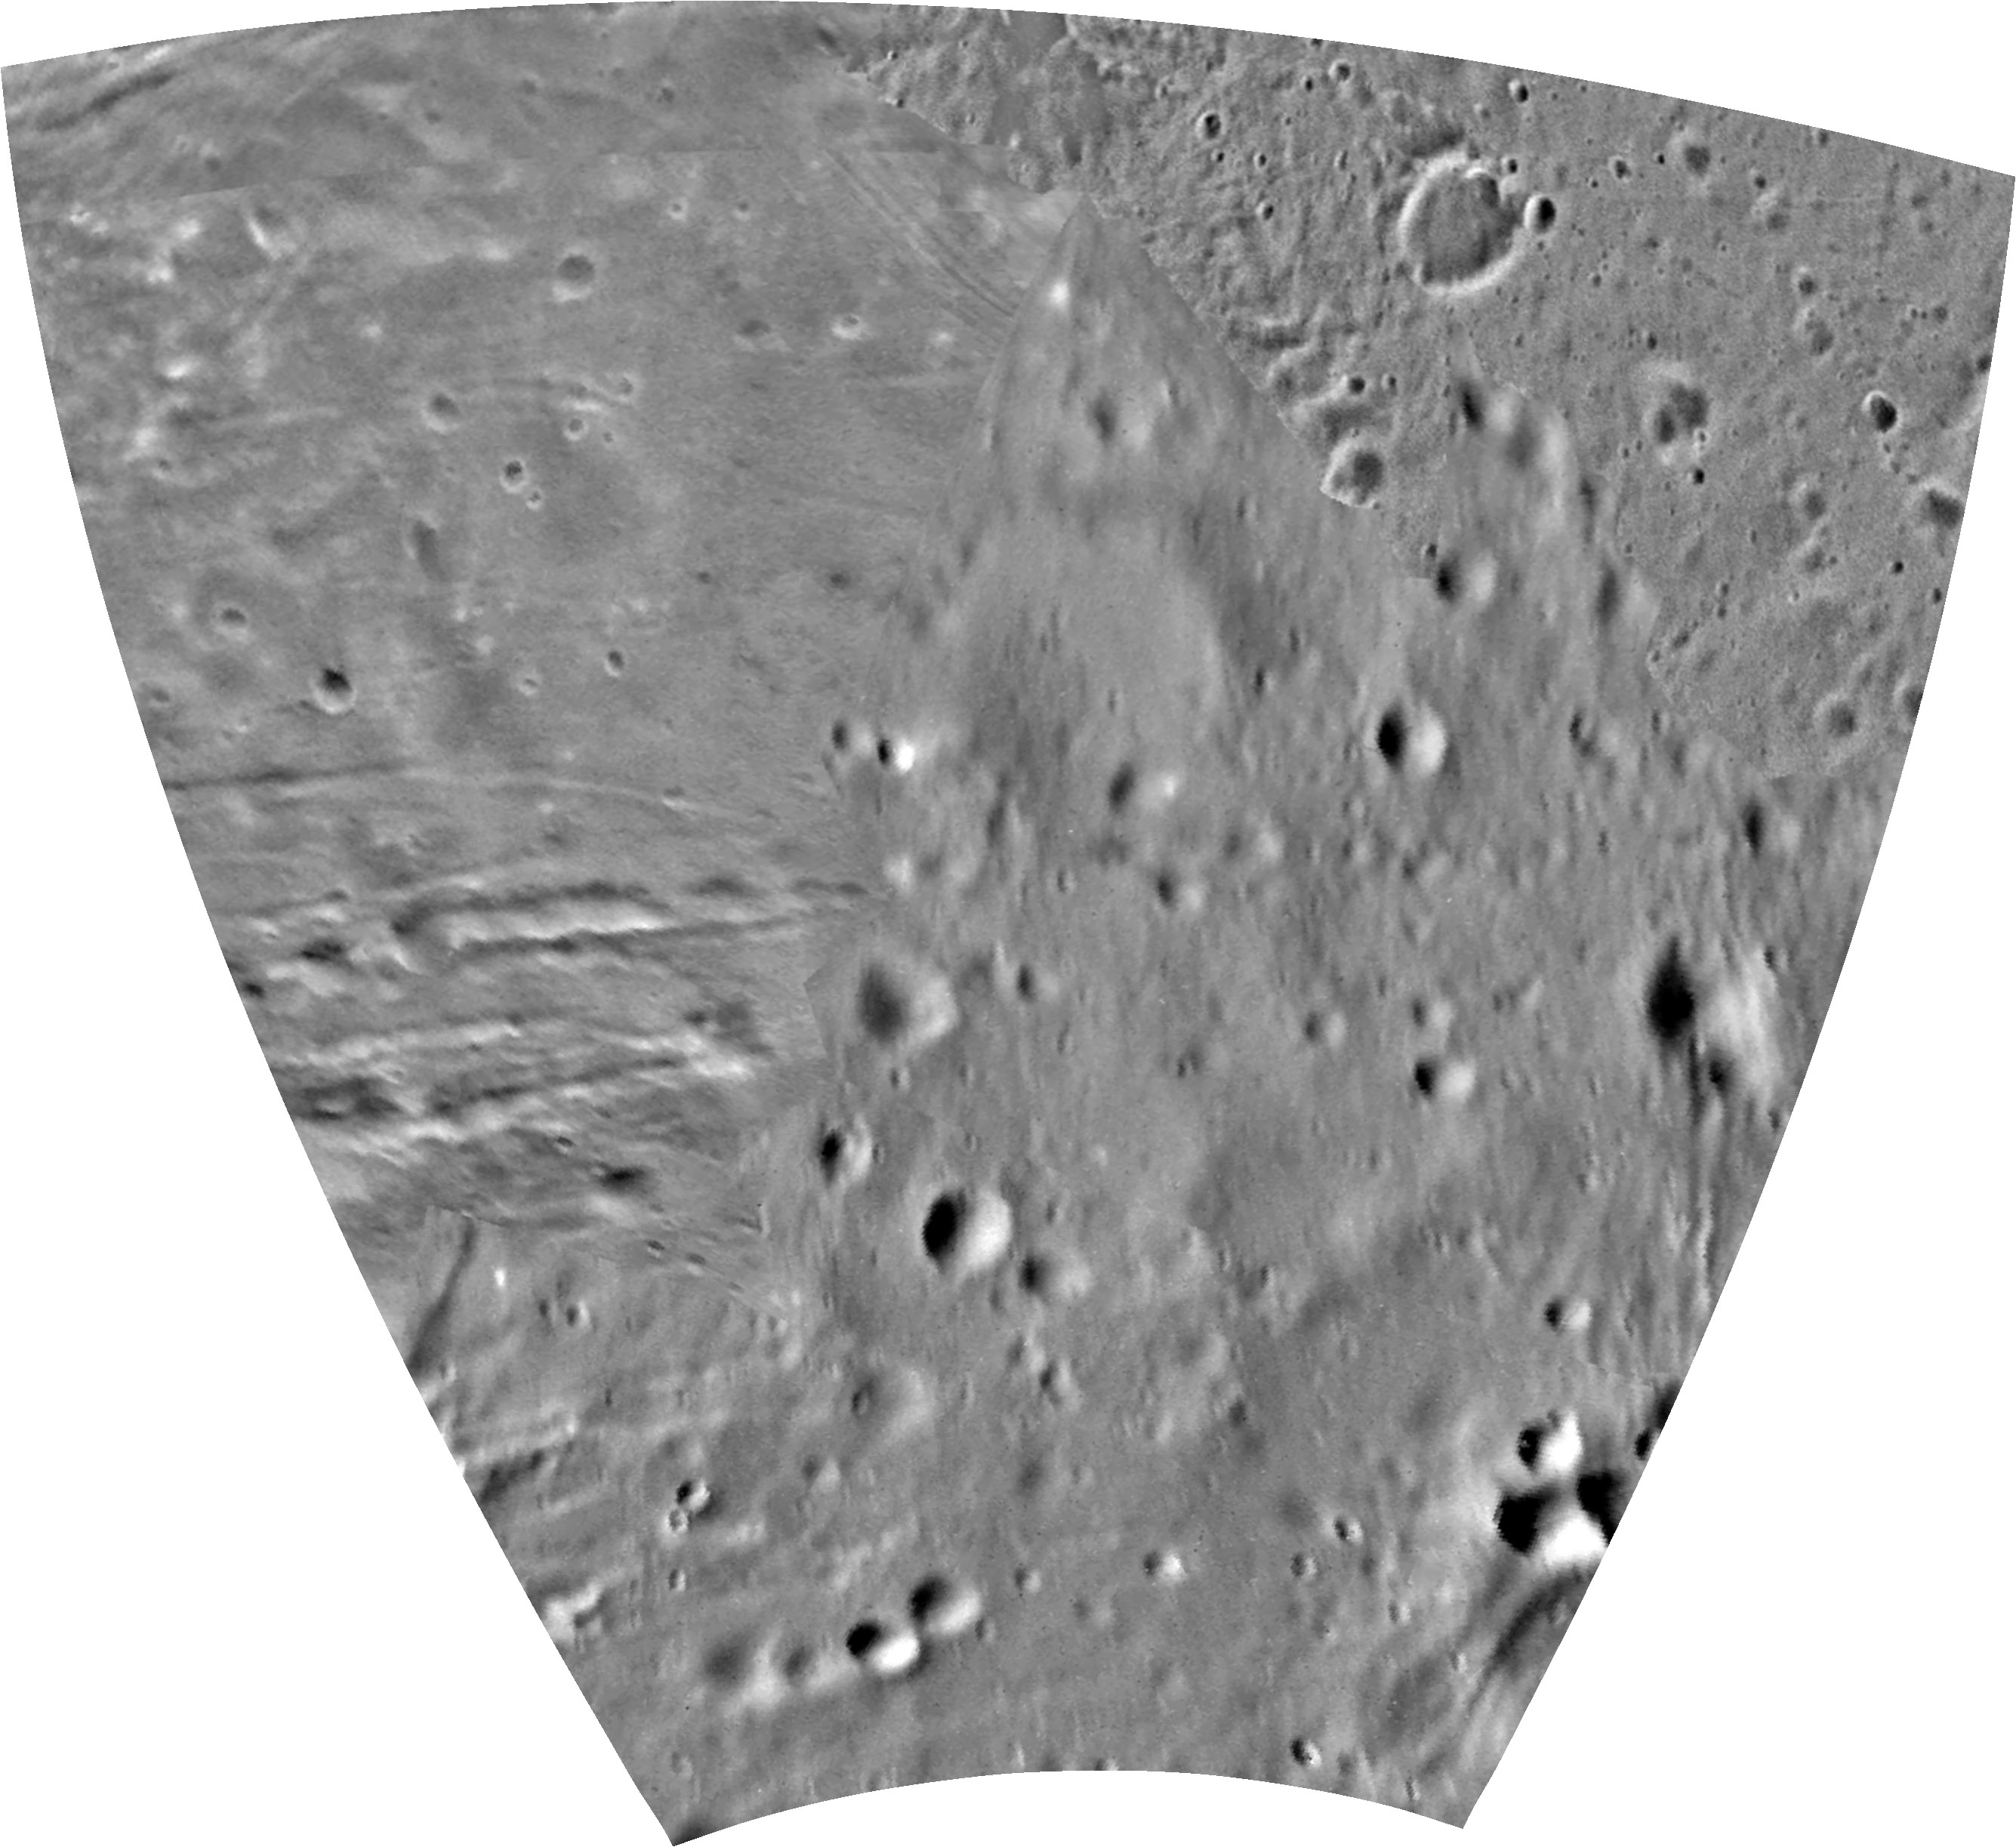
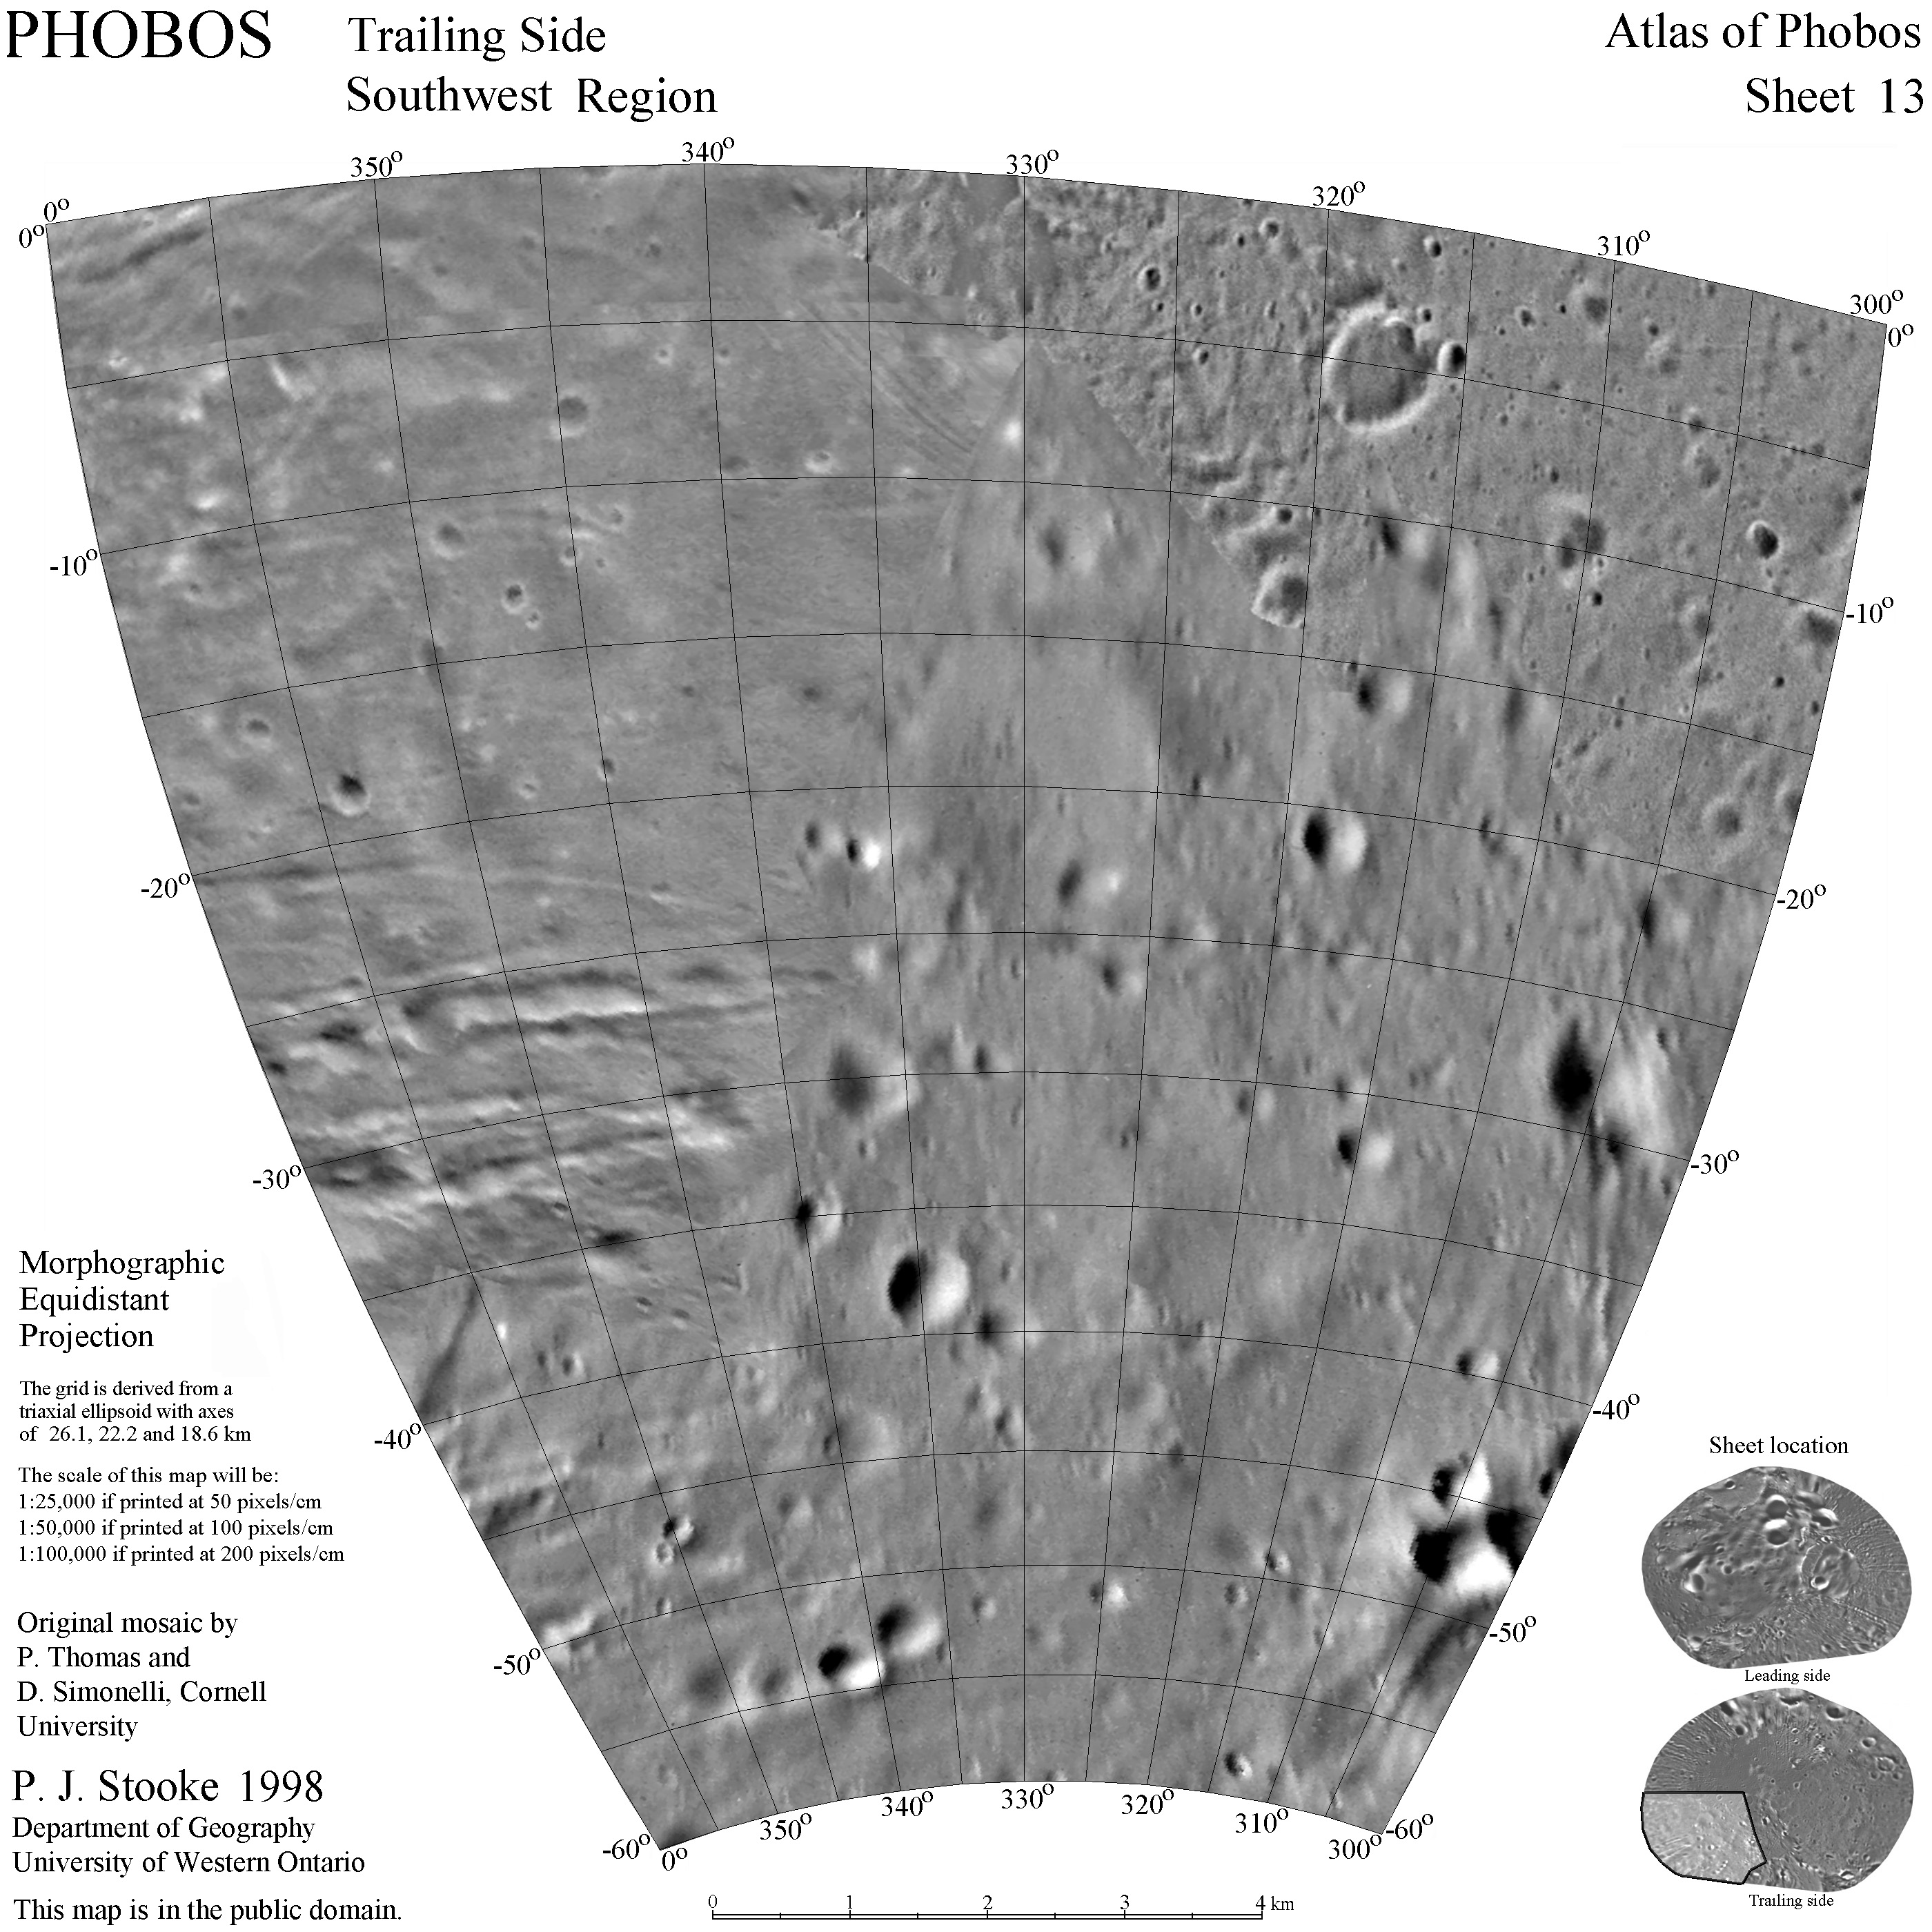
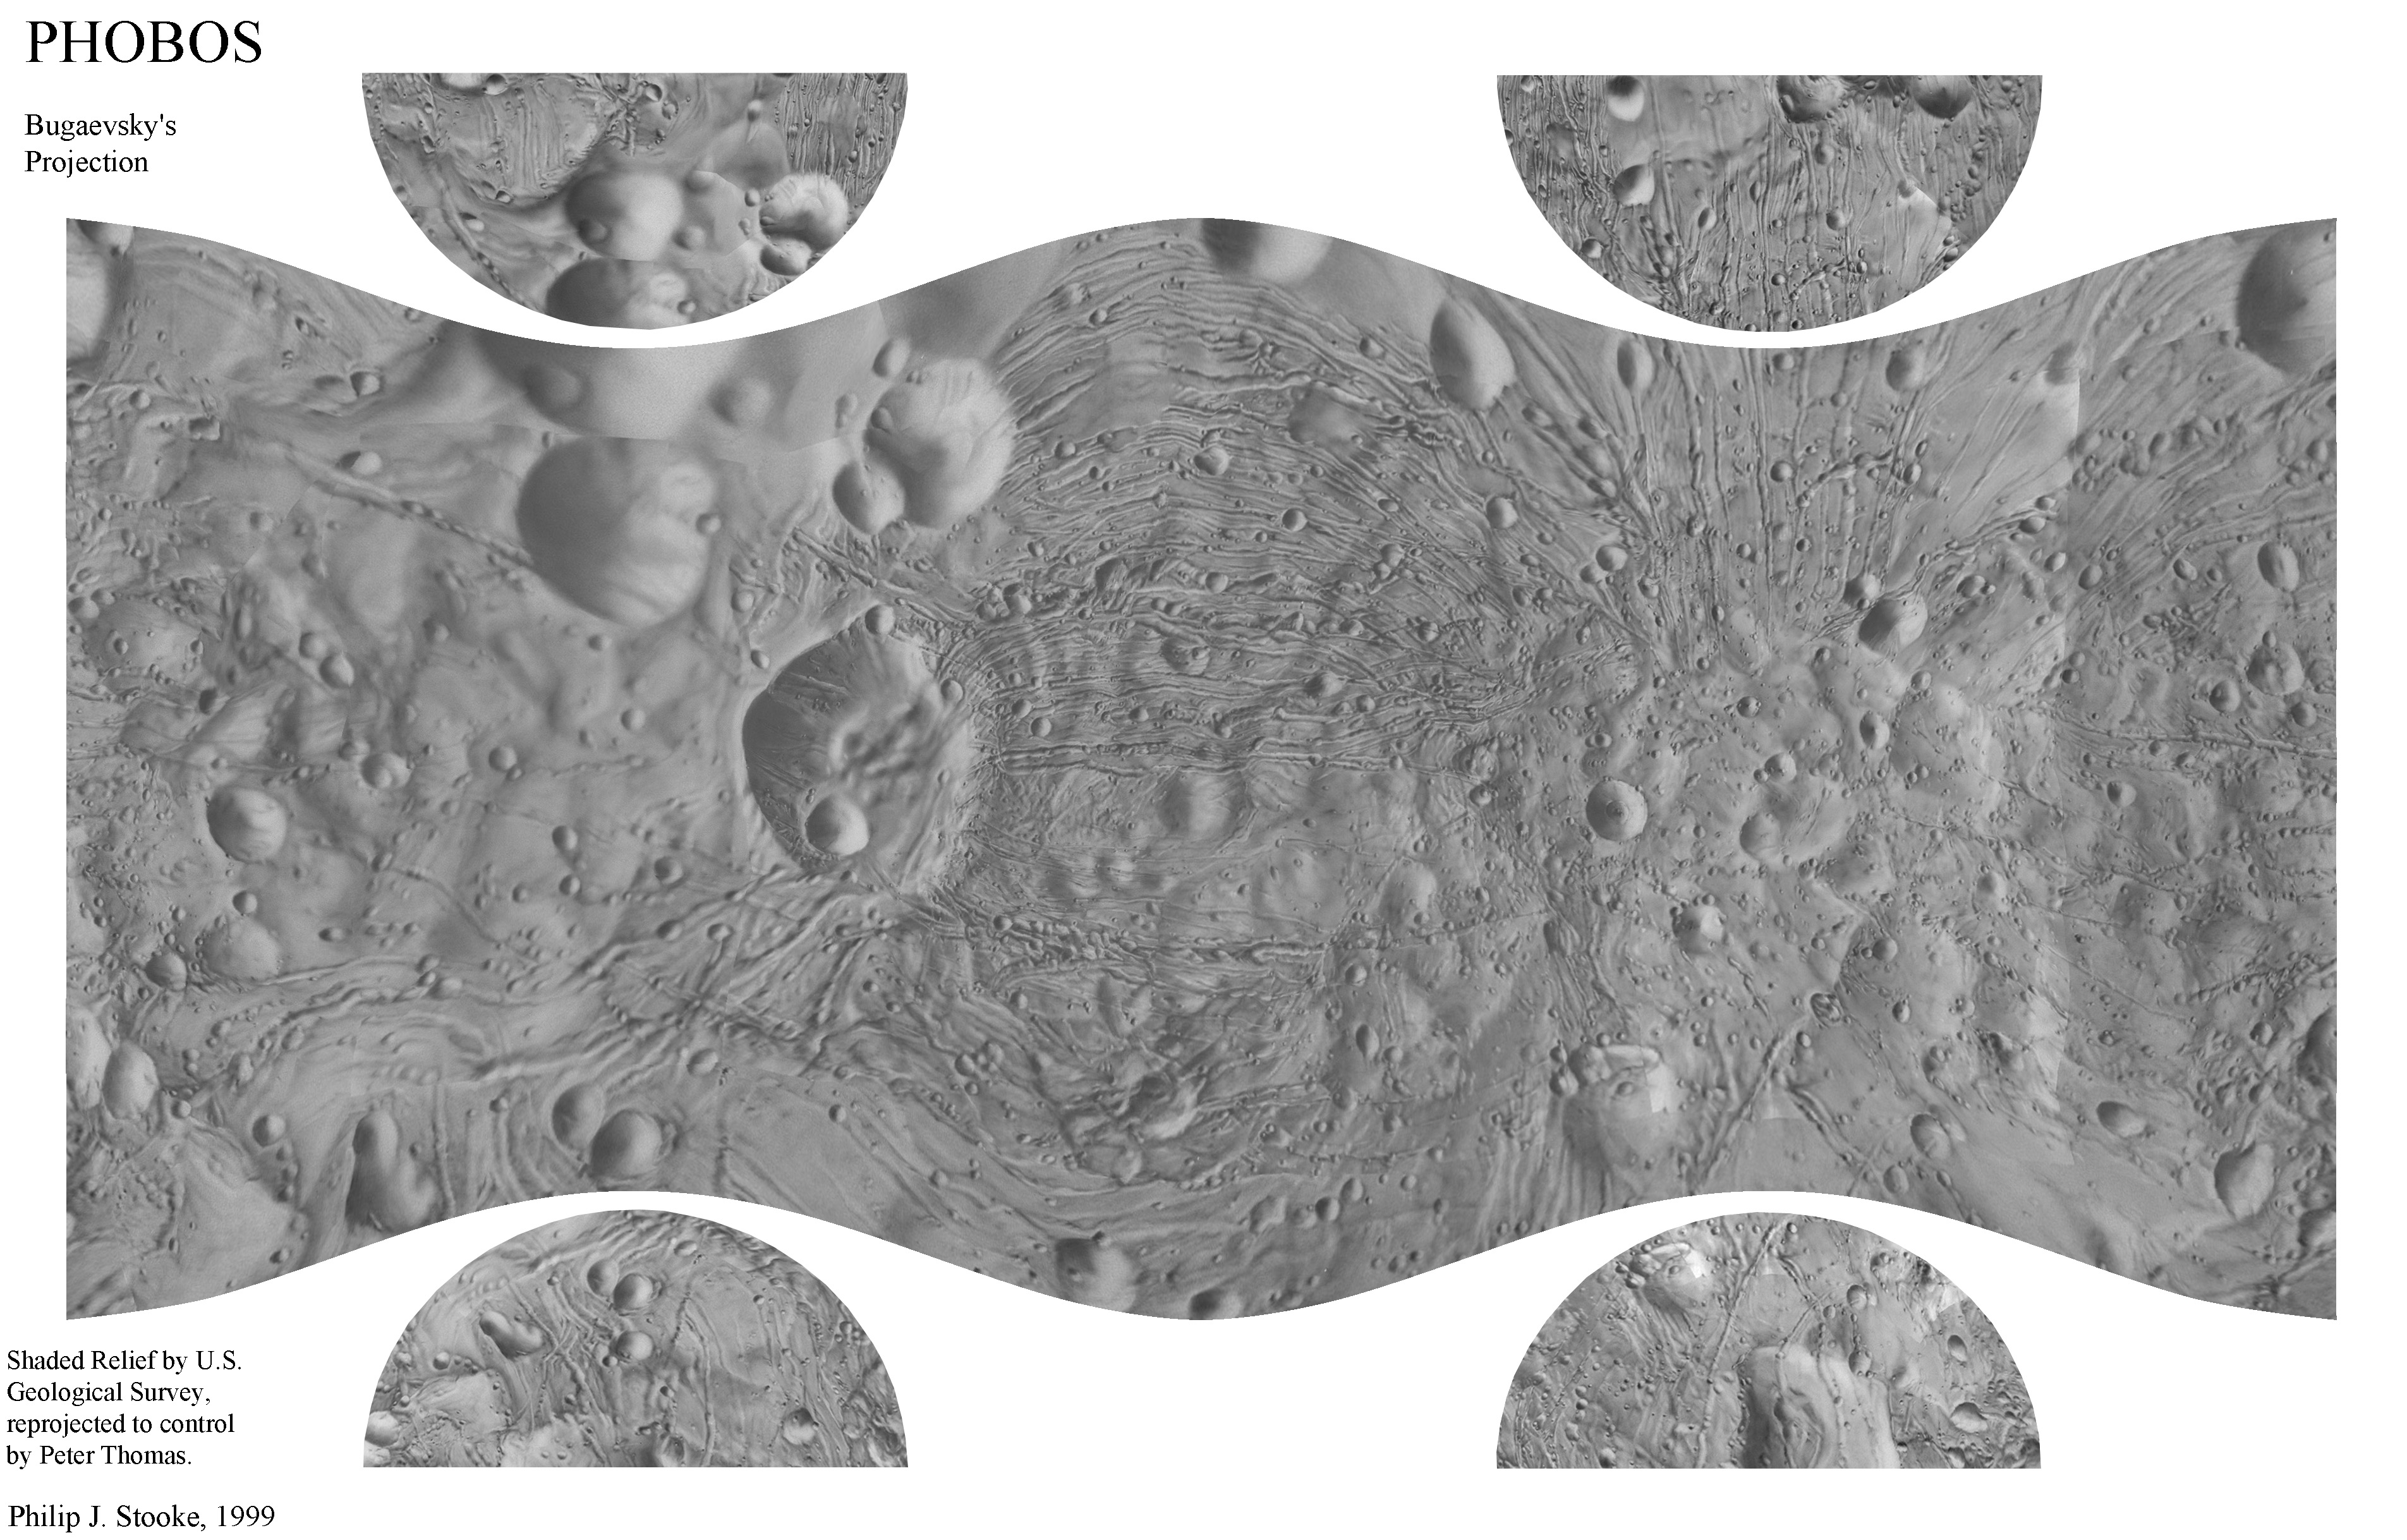
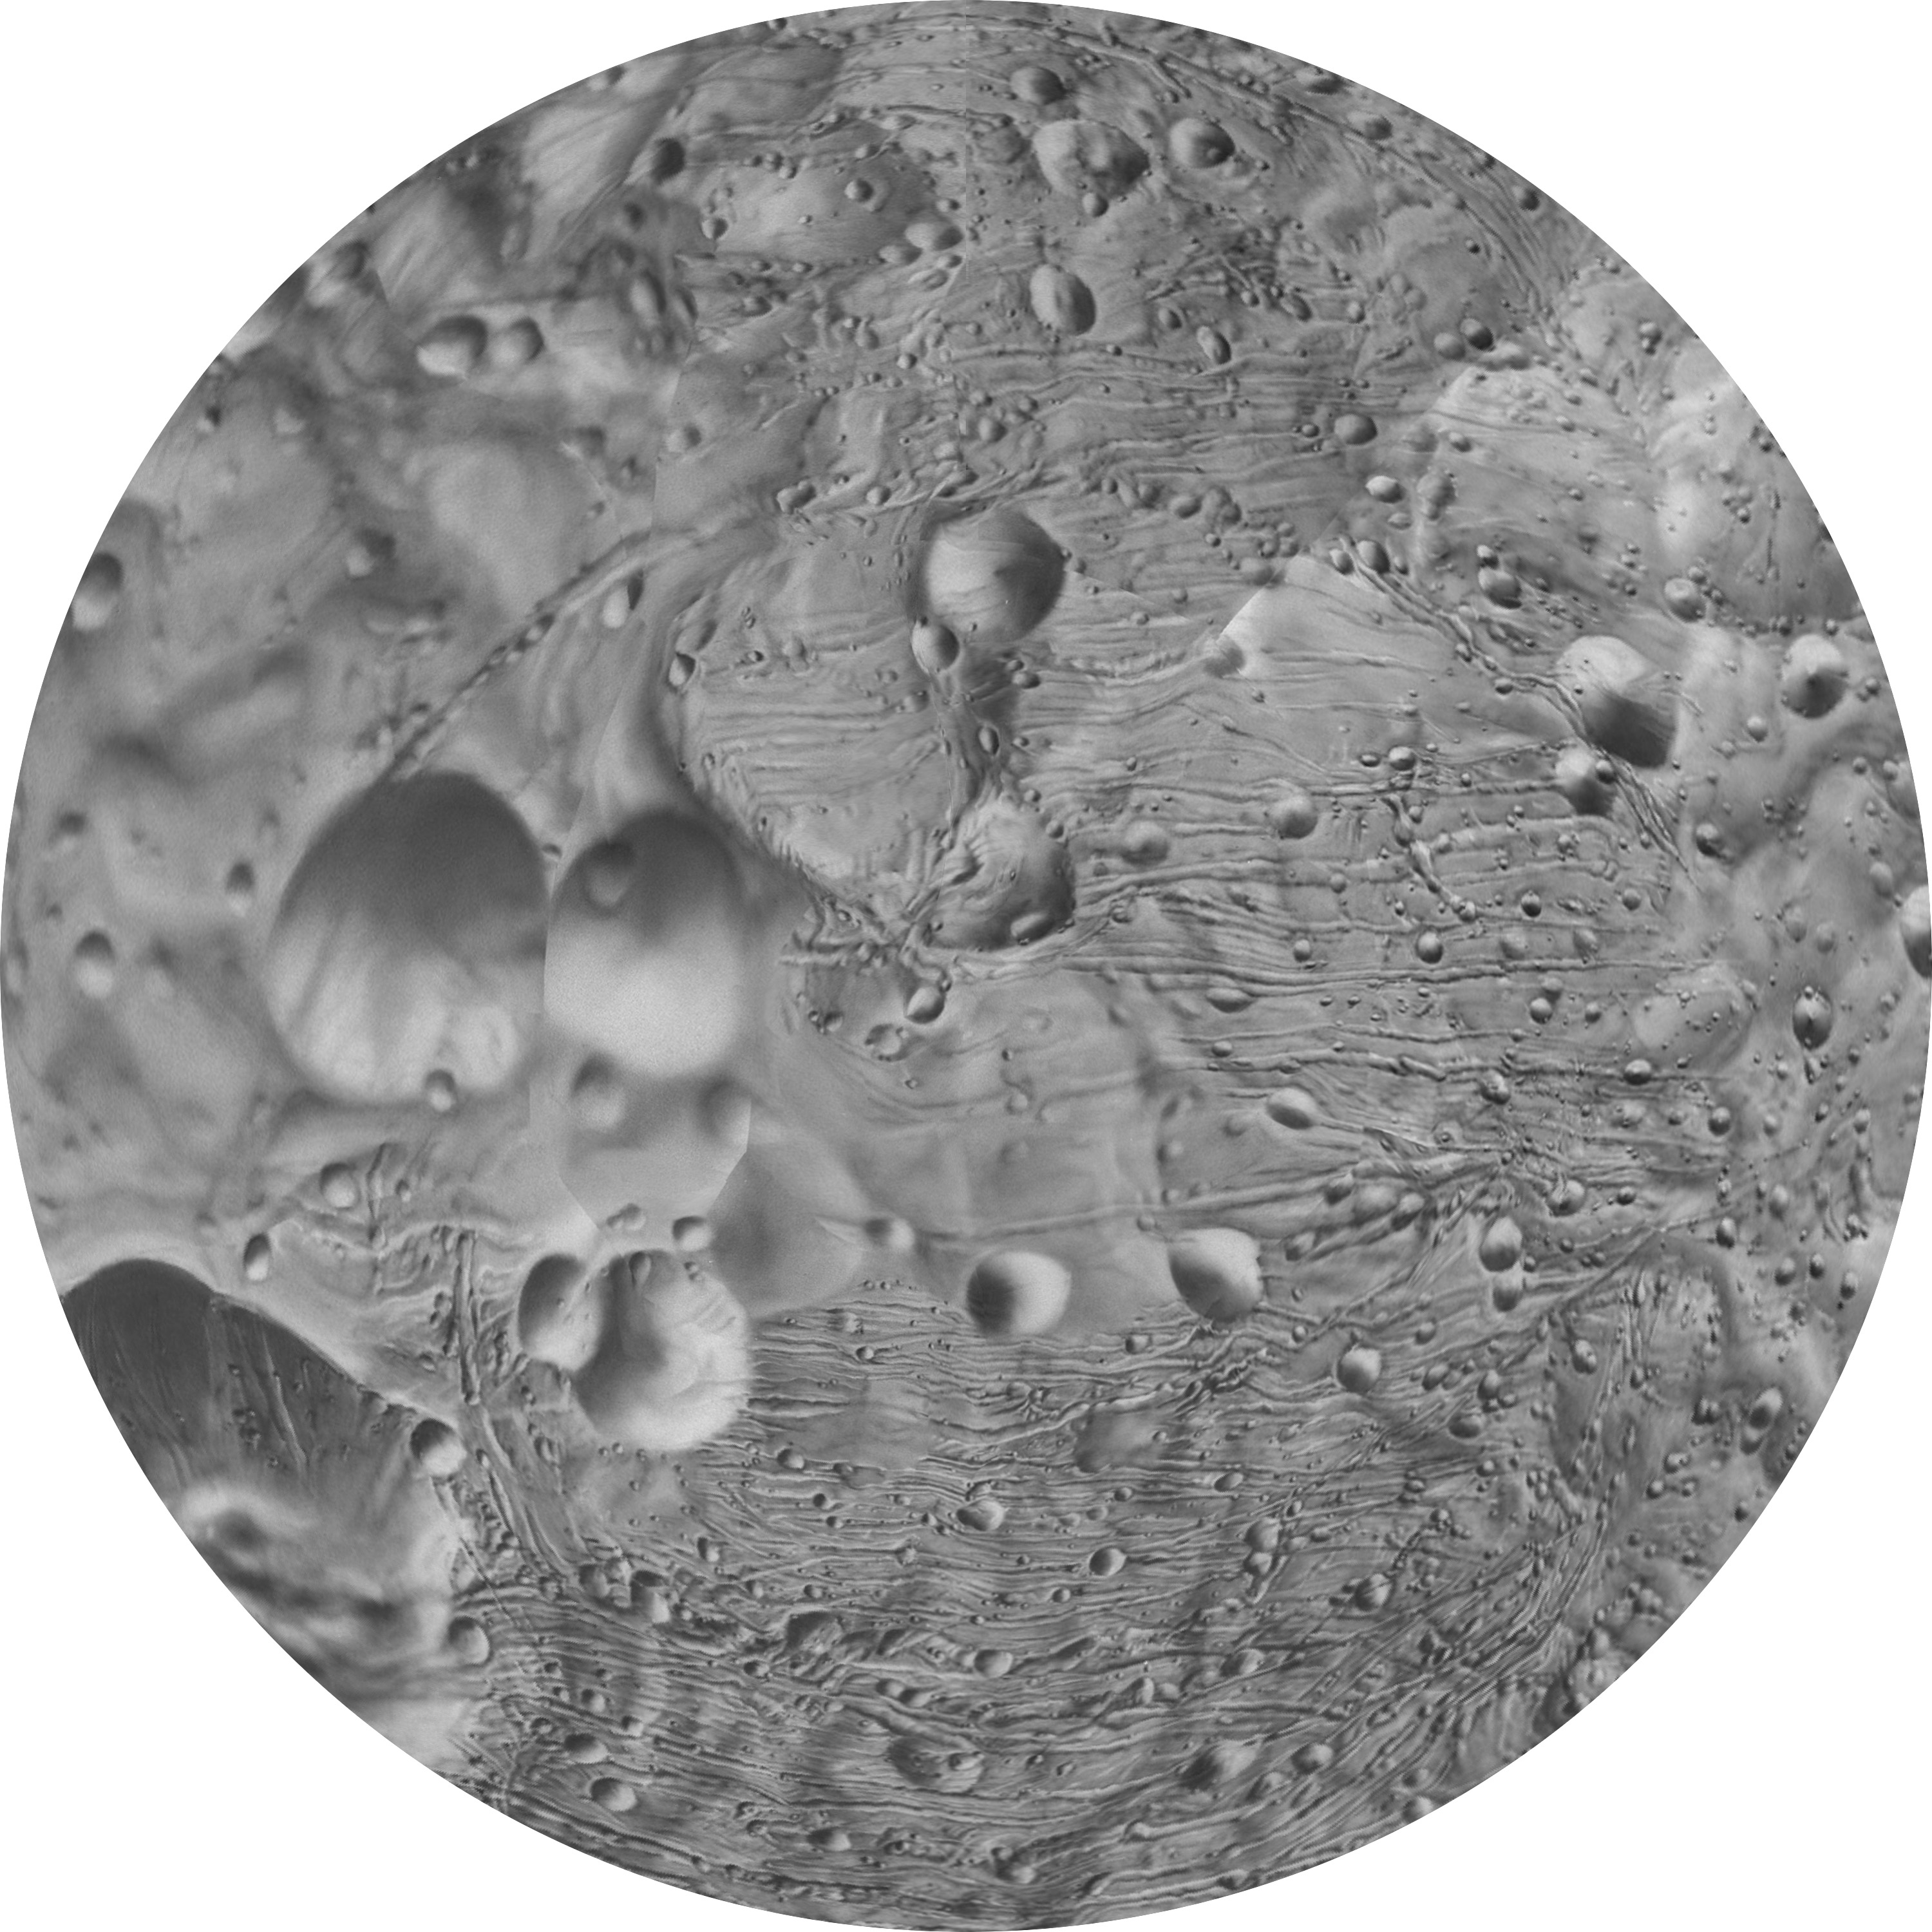
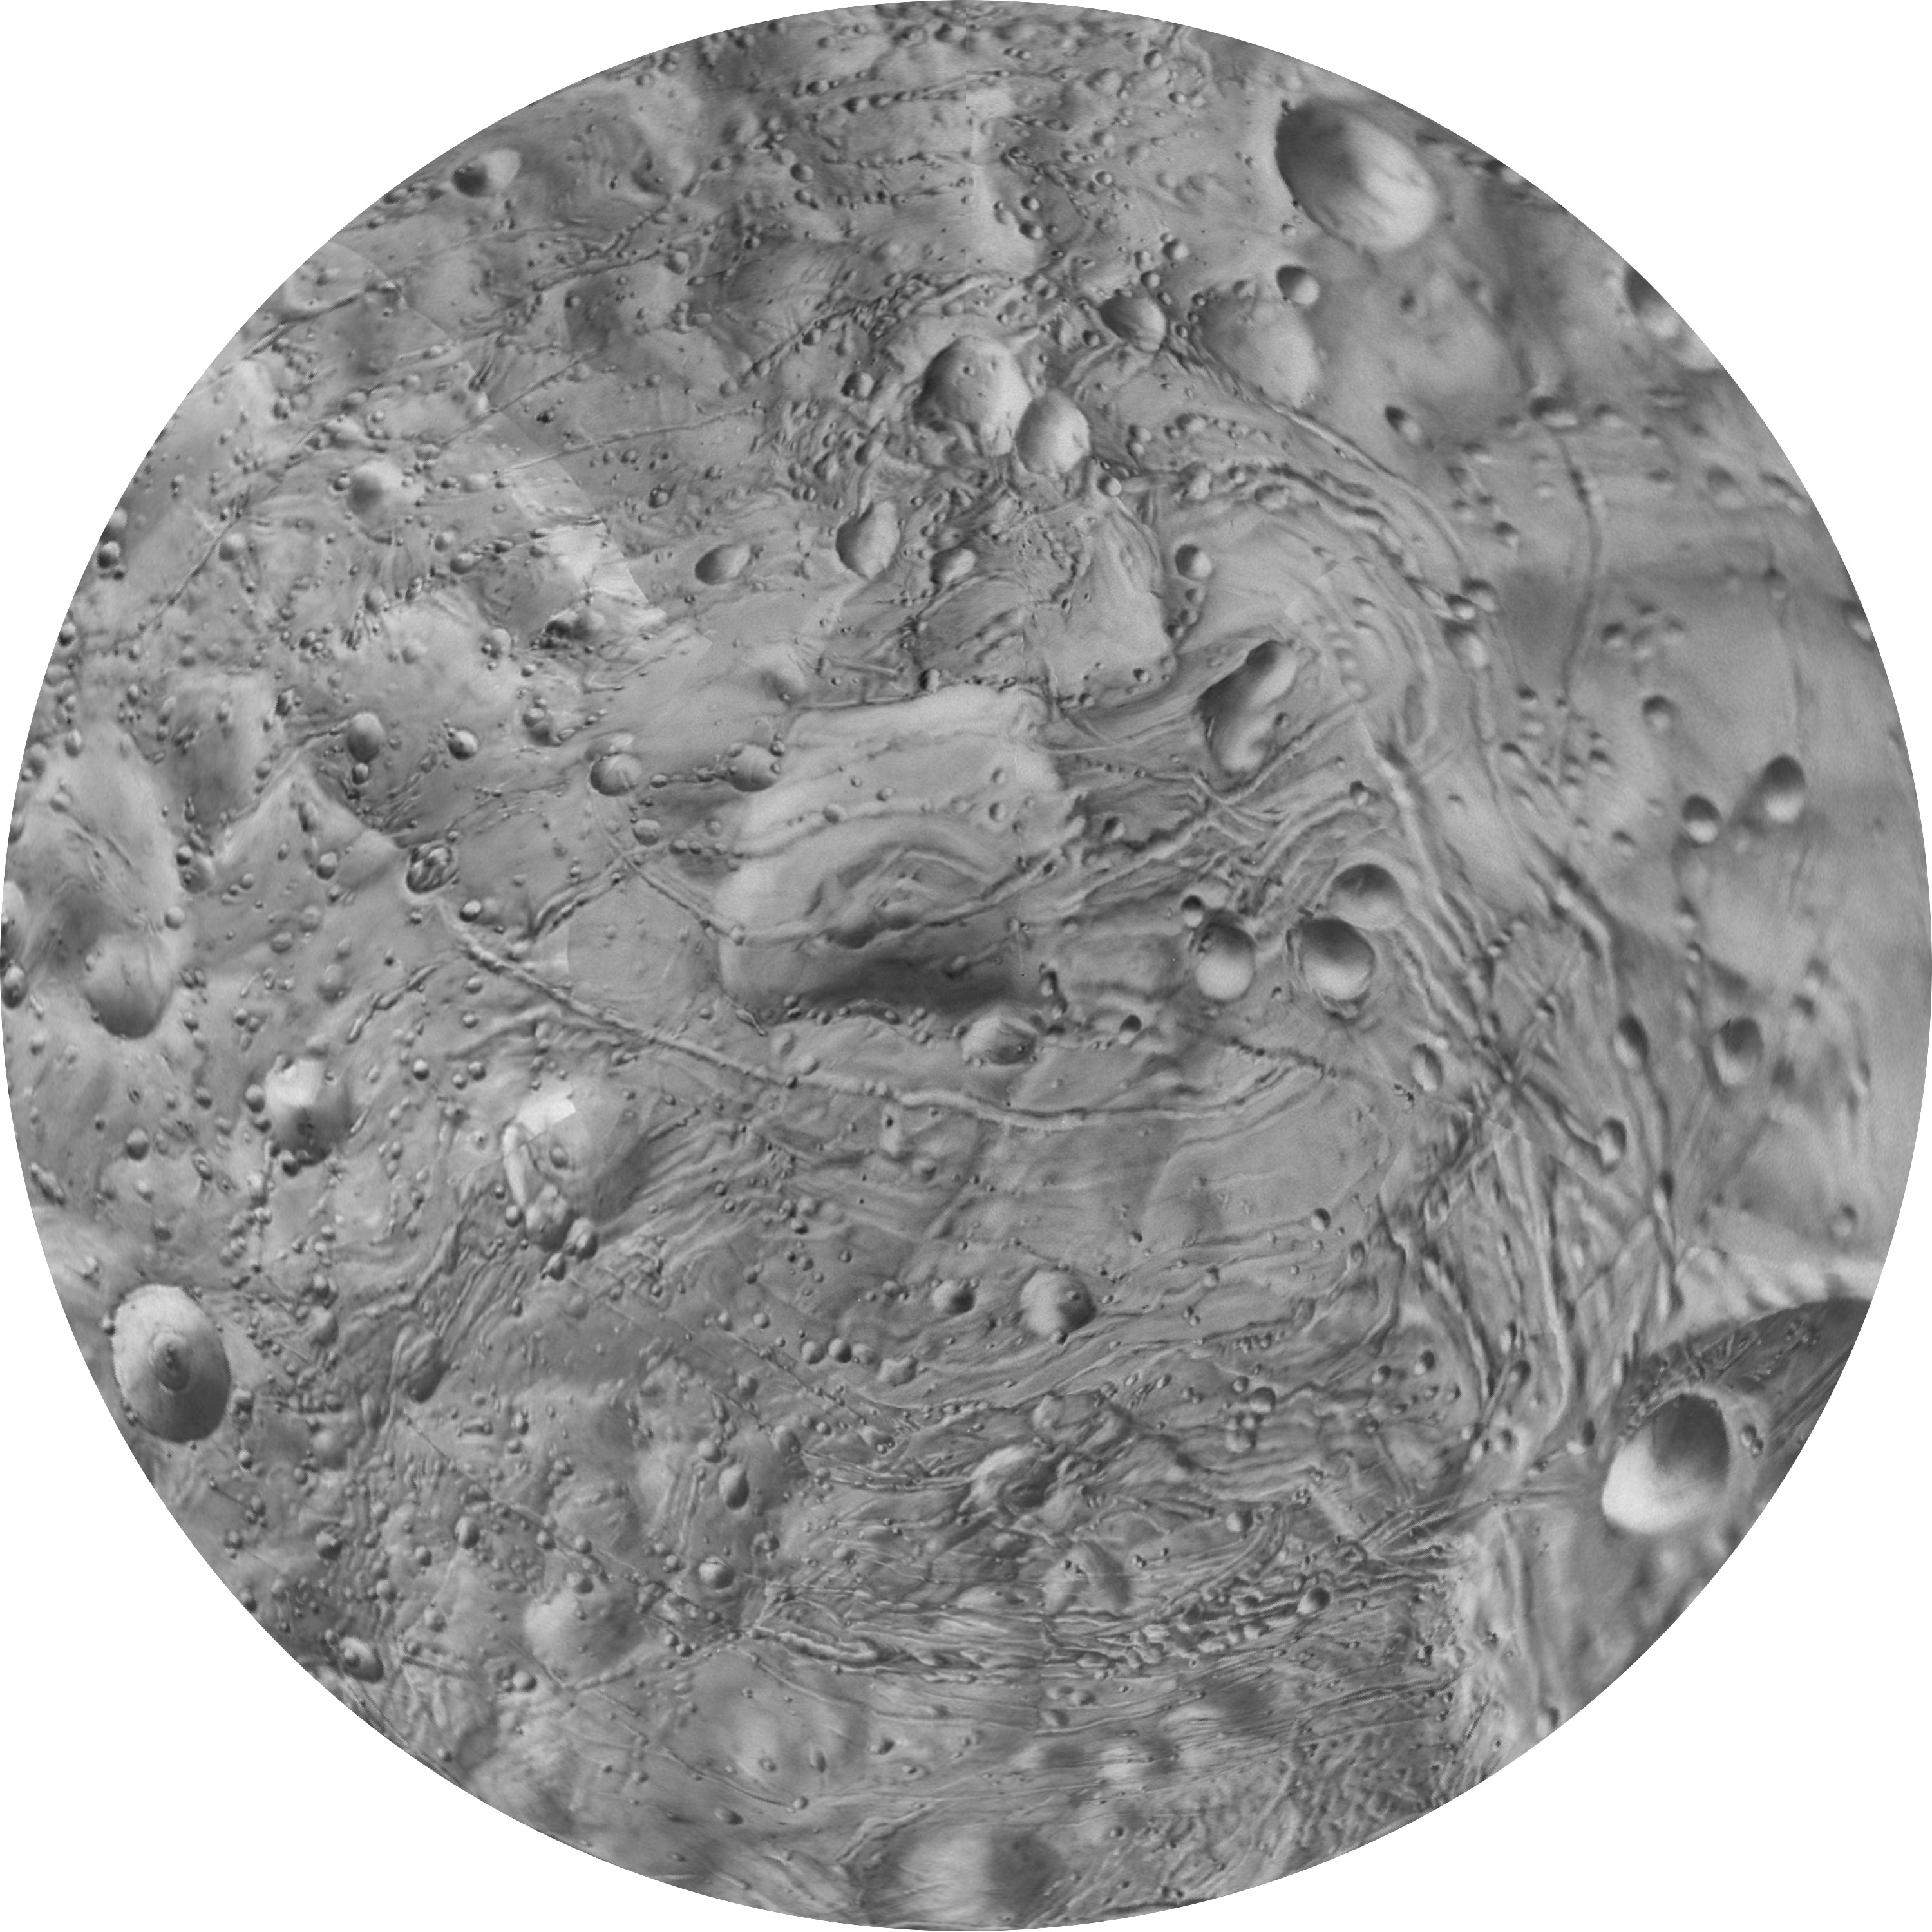
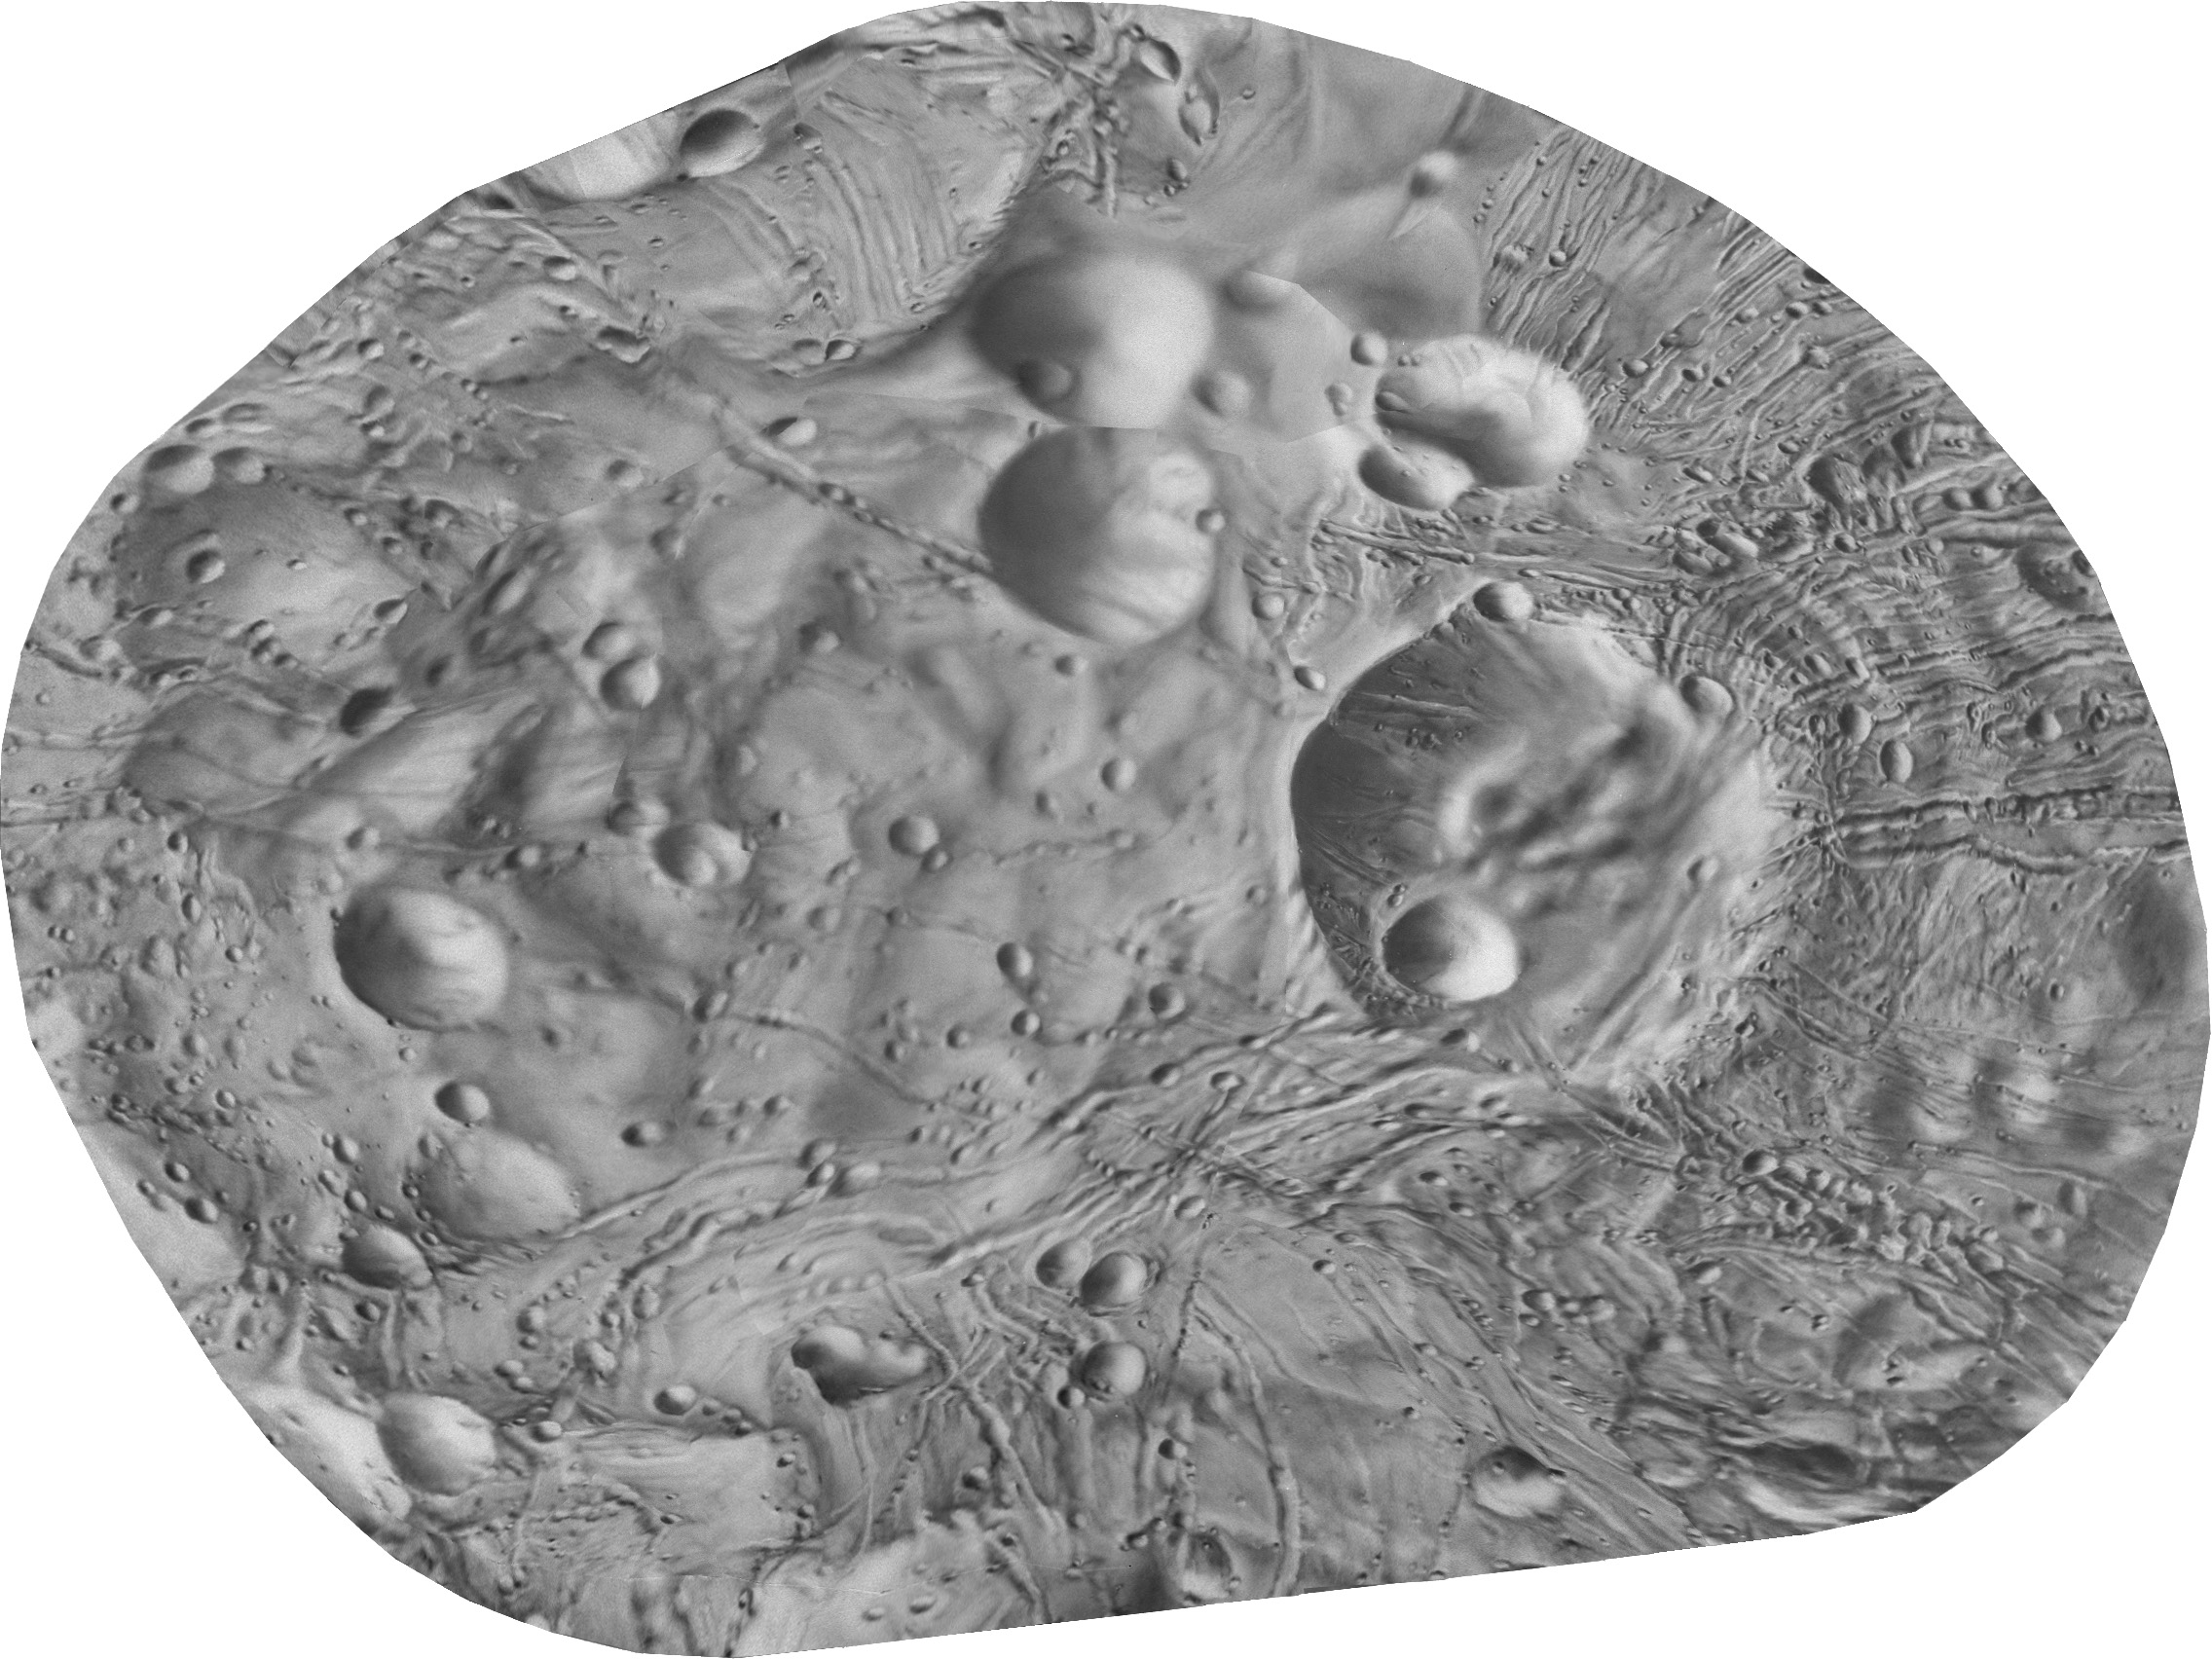
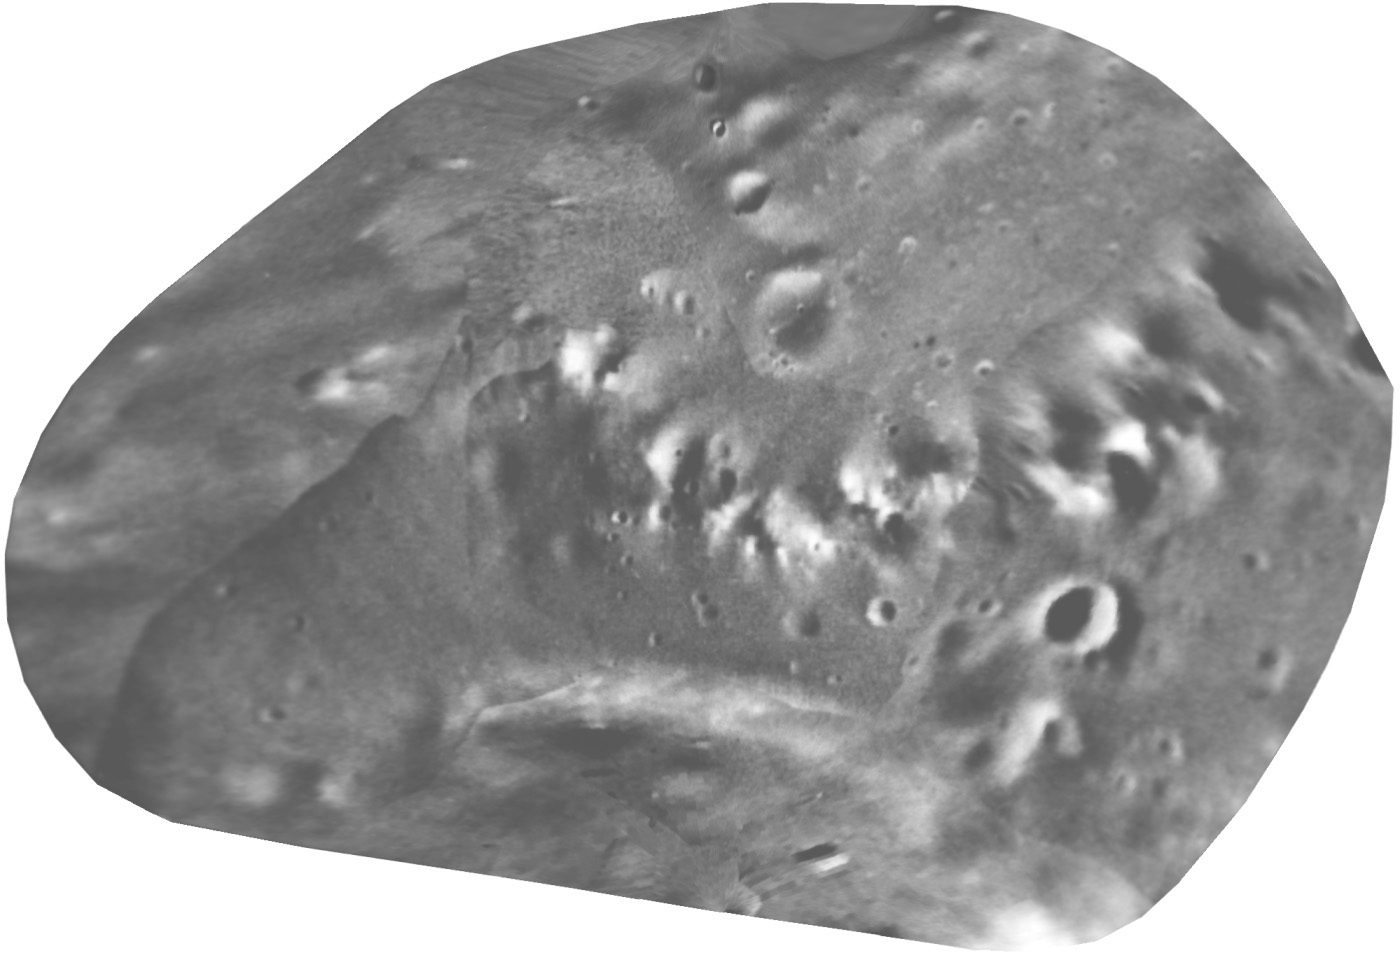
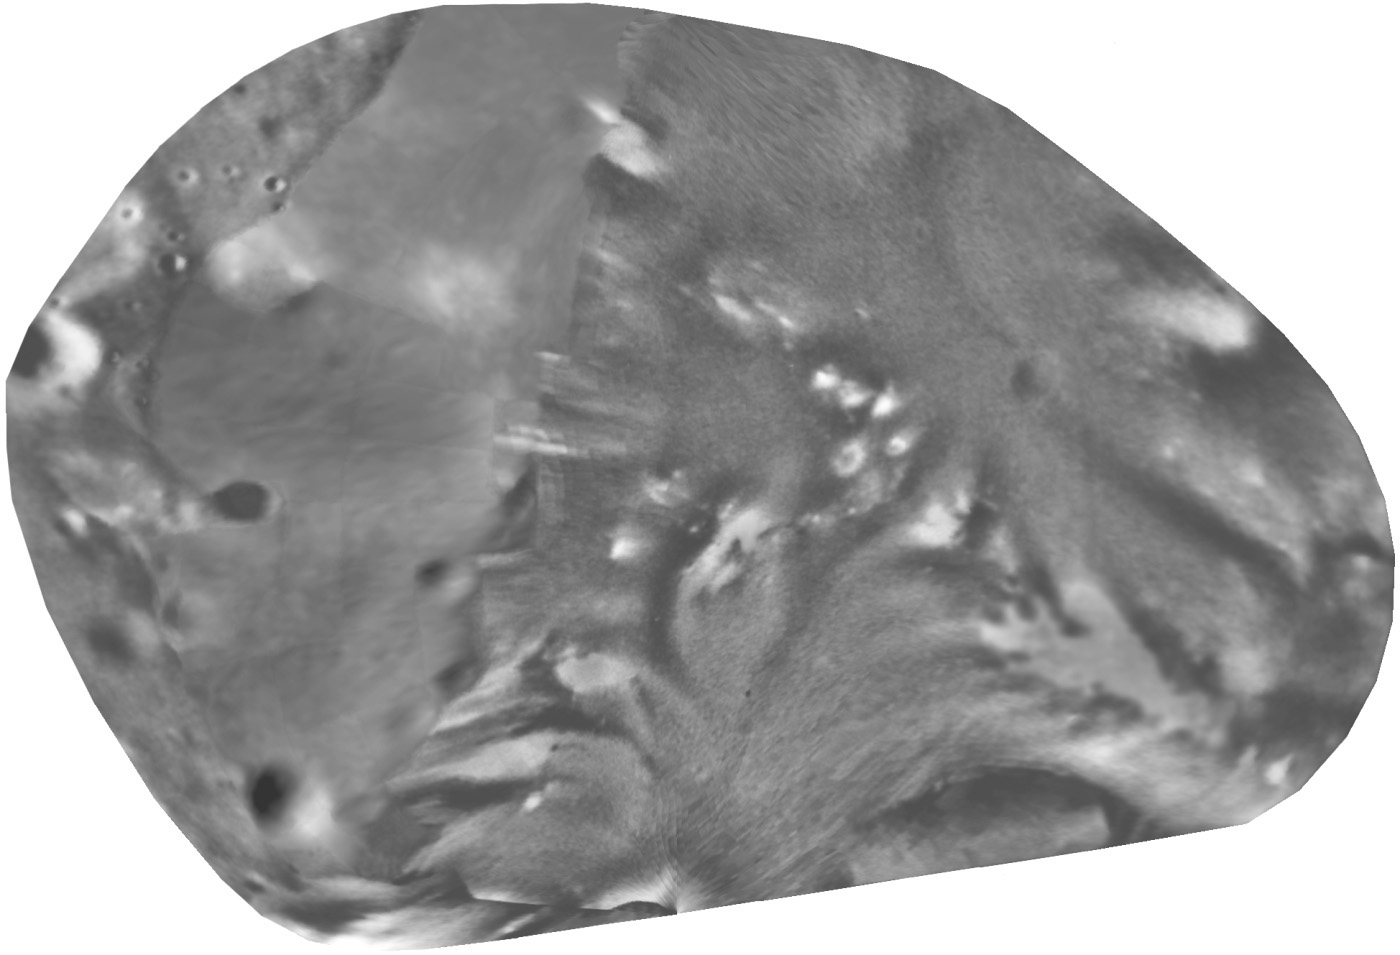
M1 Phobos
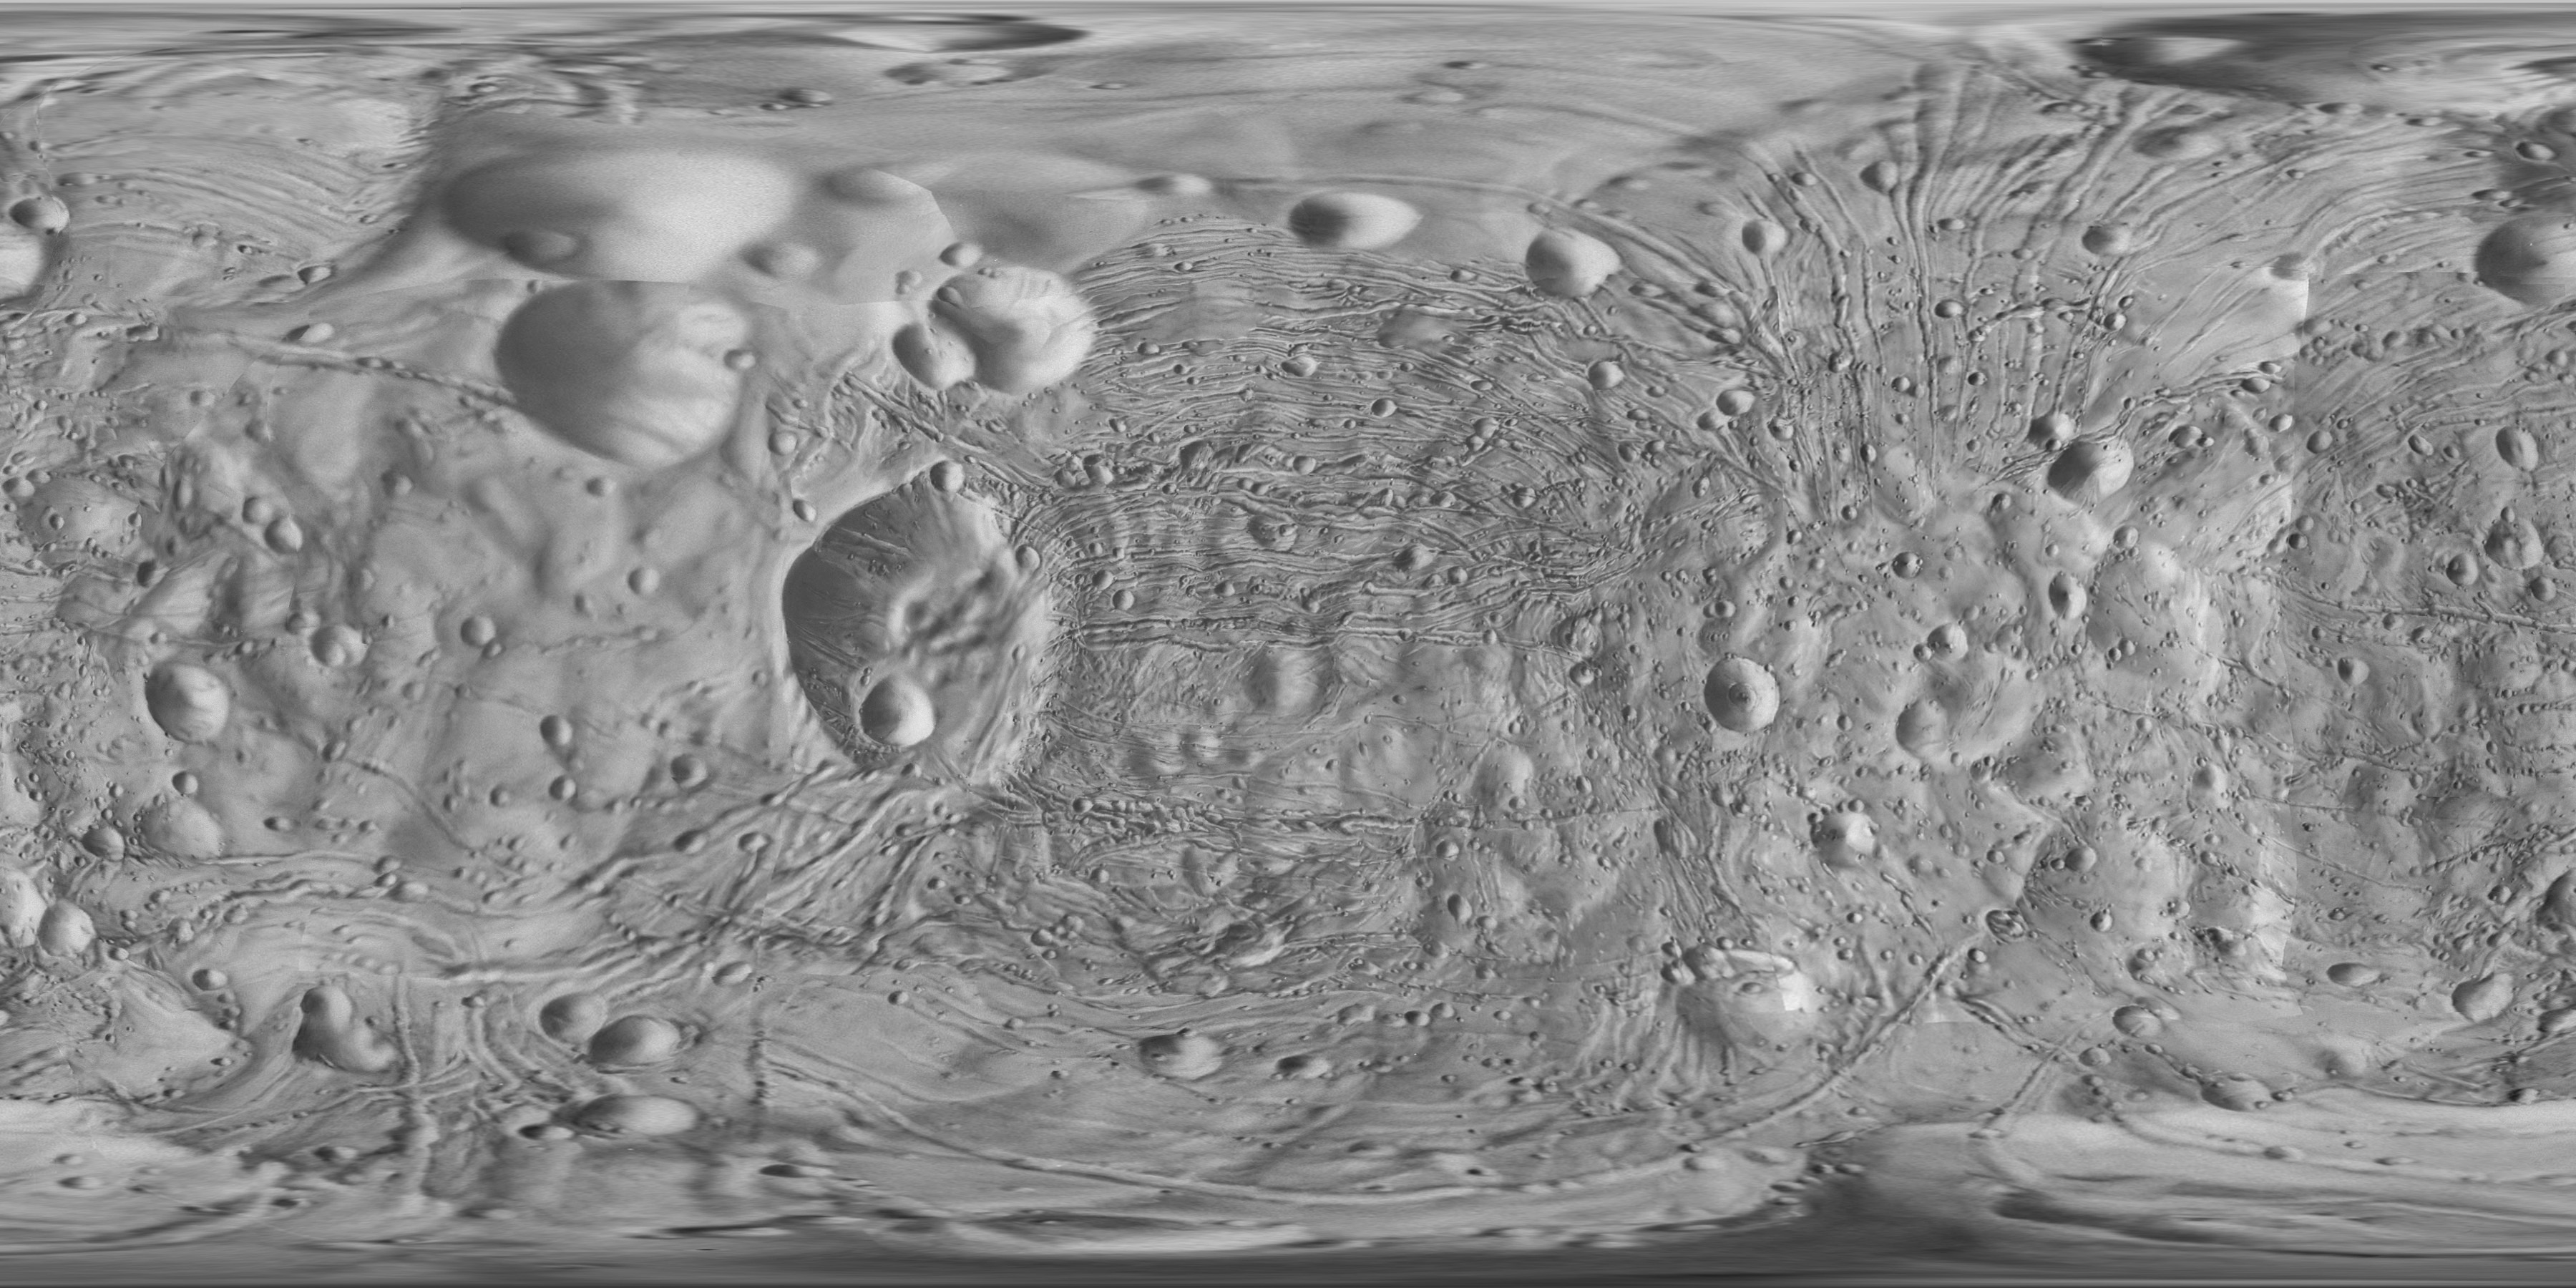
A. Photomosaics from Viking images, in various projections.
The mosaics were created initially by Peter Thomas, Damon Simonelli
and colleagues at Cornell University, to whom the author is very
grateful for permission to use them. They have been modified
slightly for this release, then reprojected to a map projection designed
for use with non-spherical bodies. The map grids are derived from
a best-fit triaxial ellipsoid whose dimensions are given on each map.
These maps cover all of Phobos in 14 sheets, each 60 degrees by 60 degrees,
sheet limits shown on labelled and gridded versions.
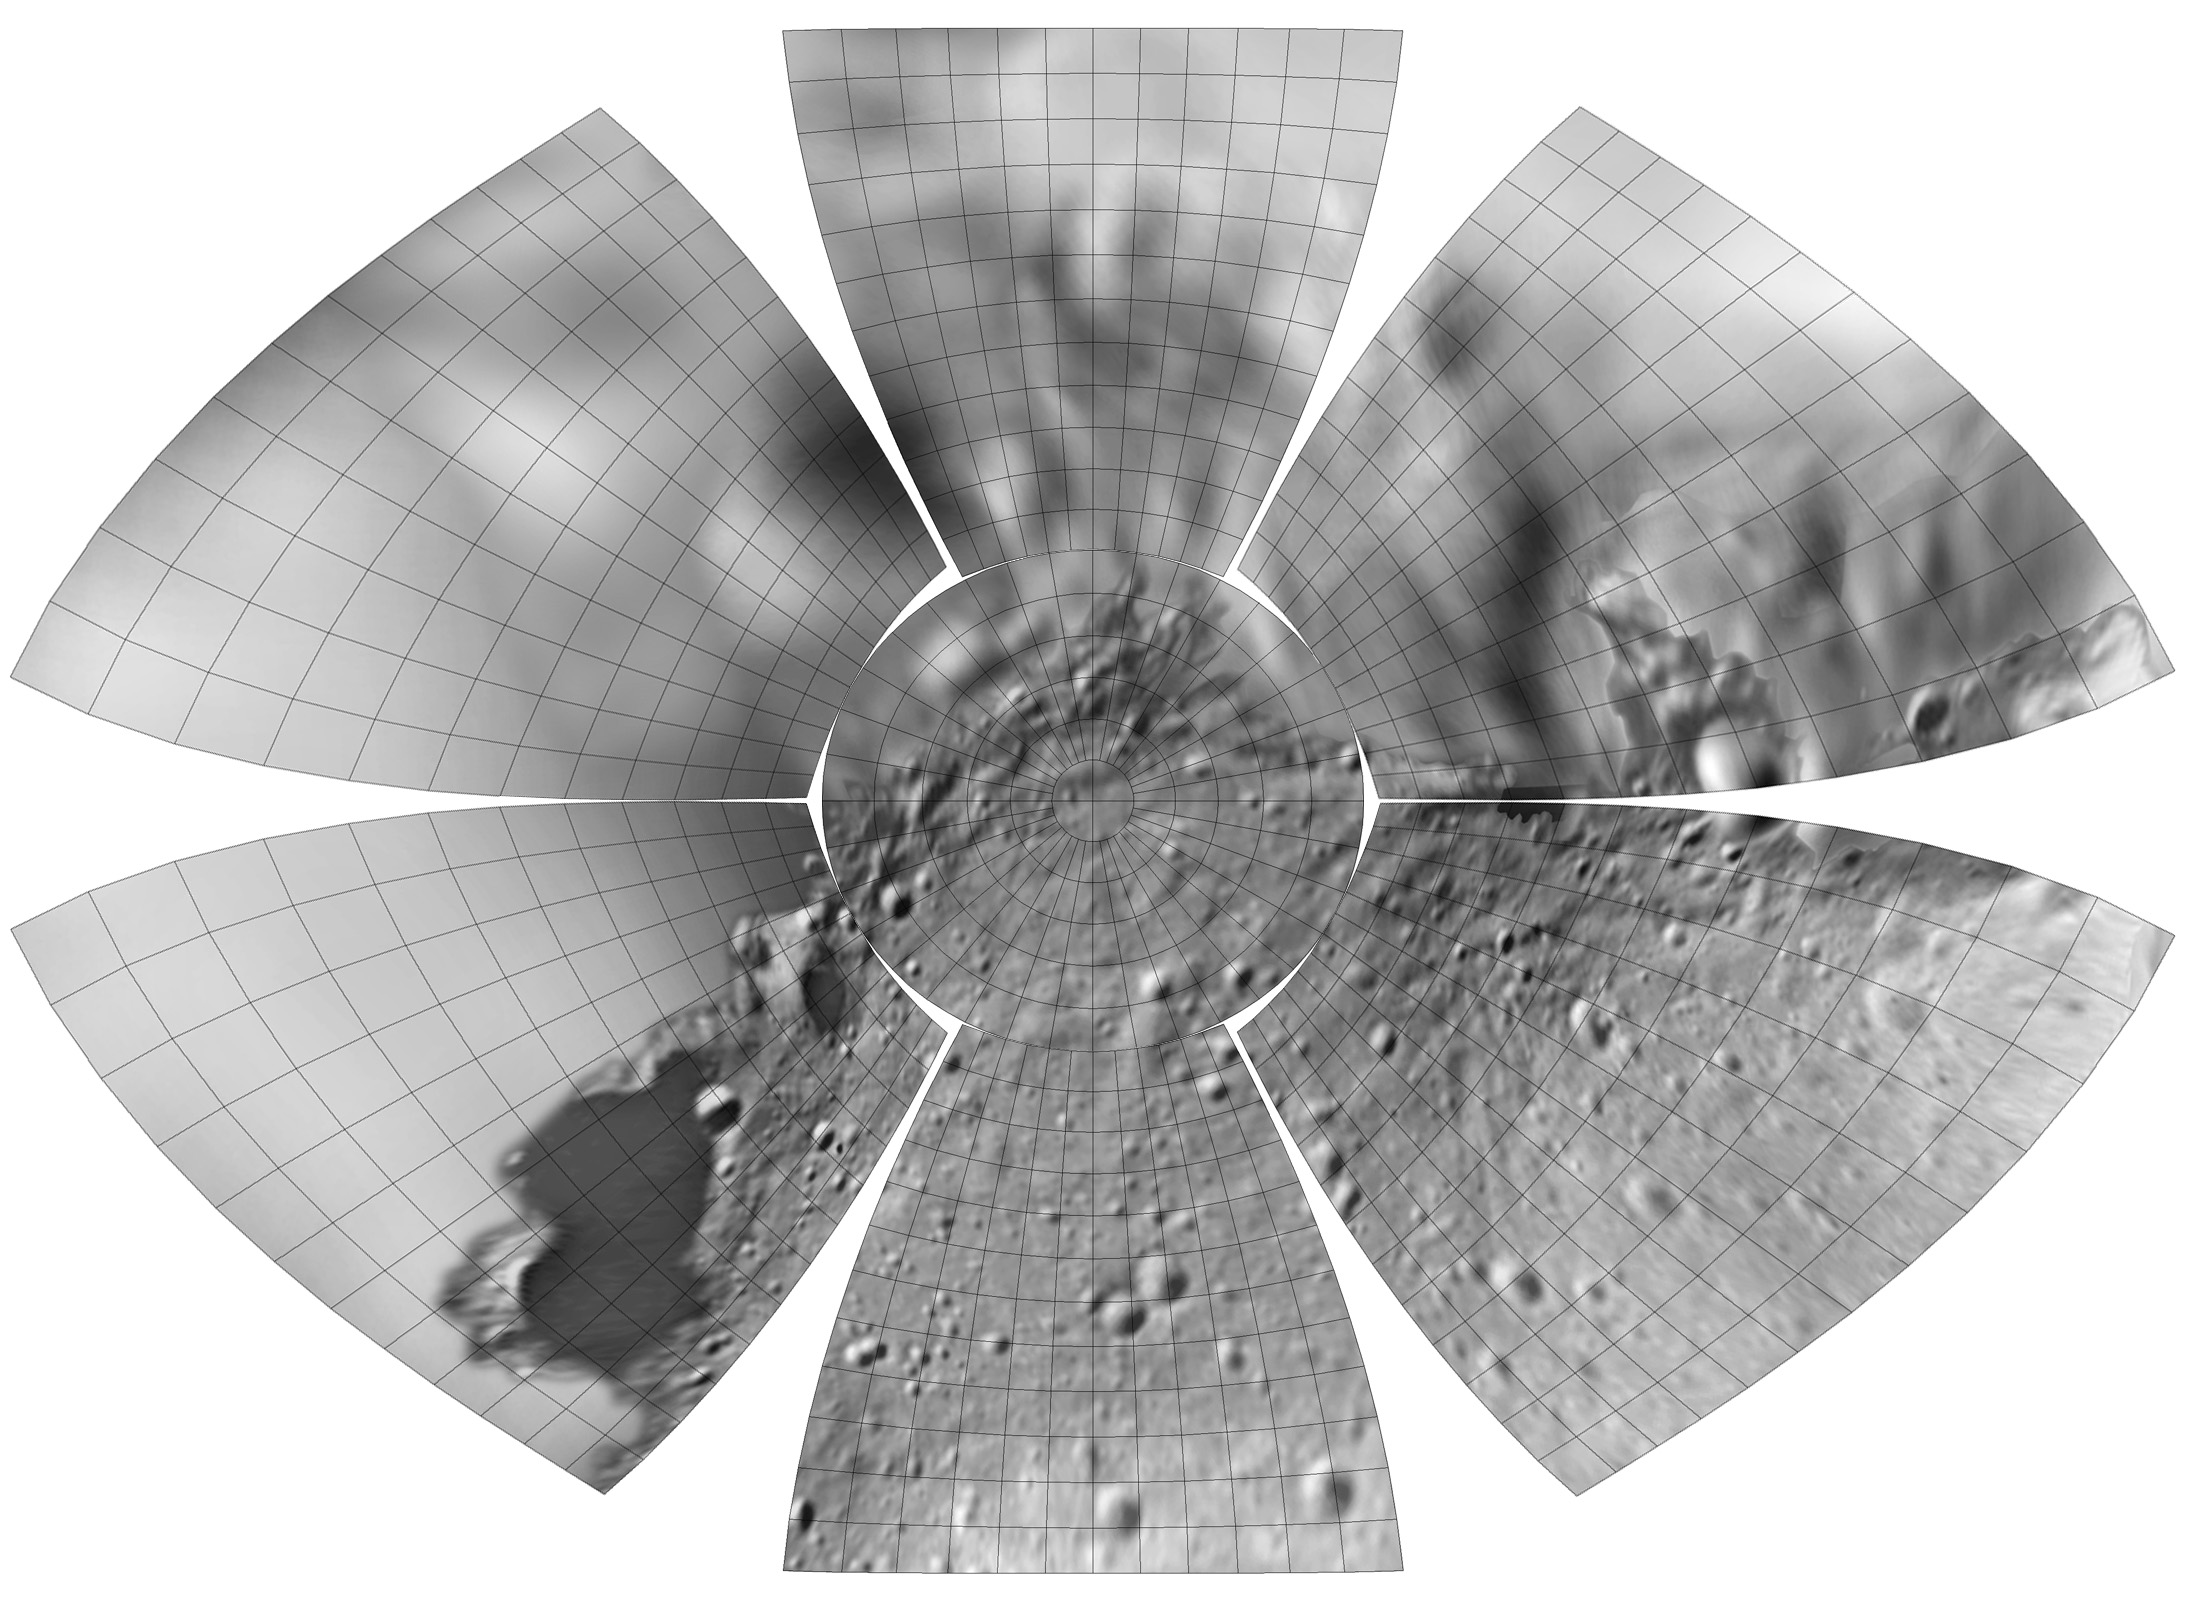
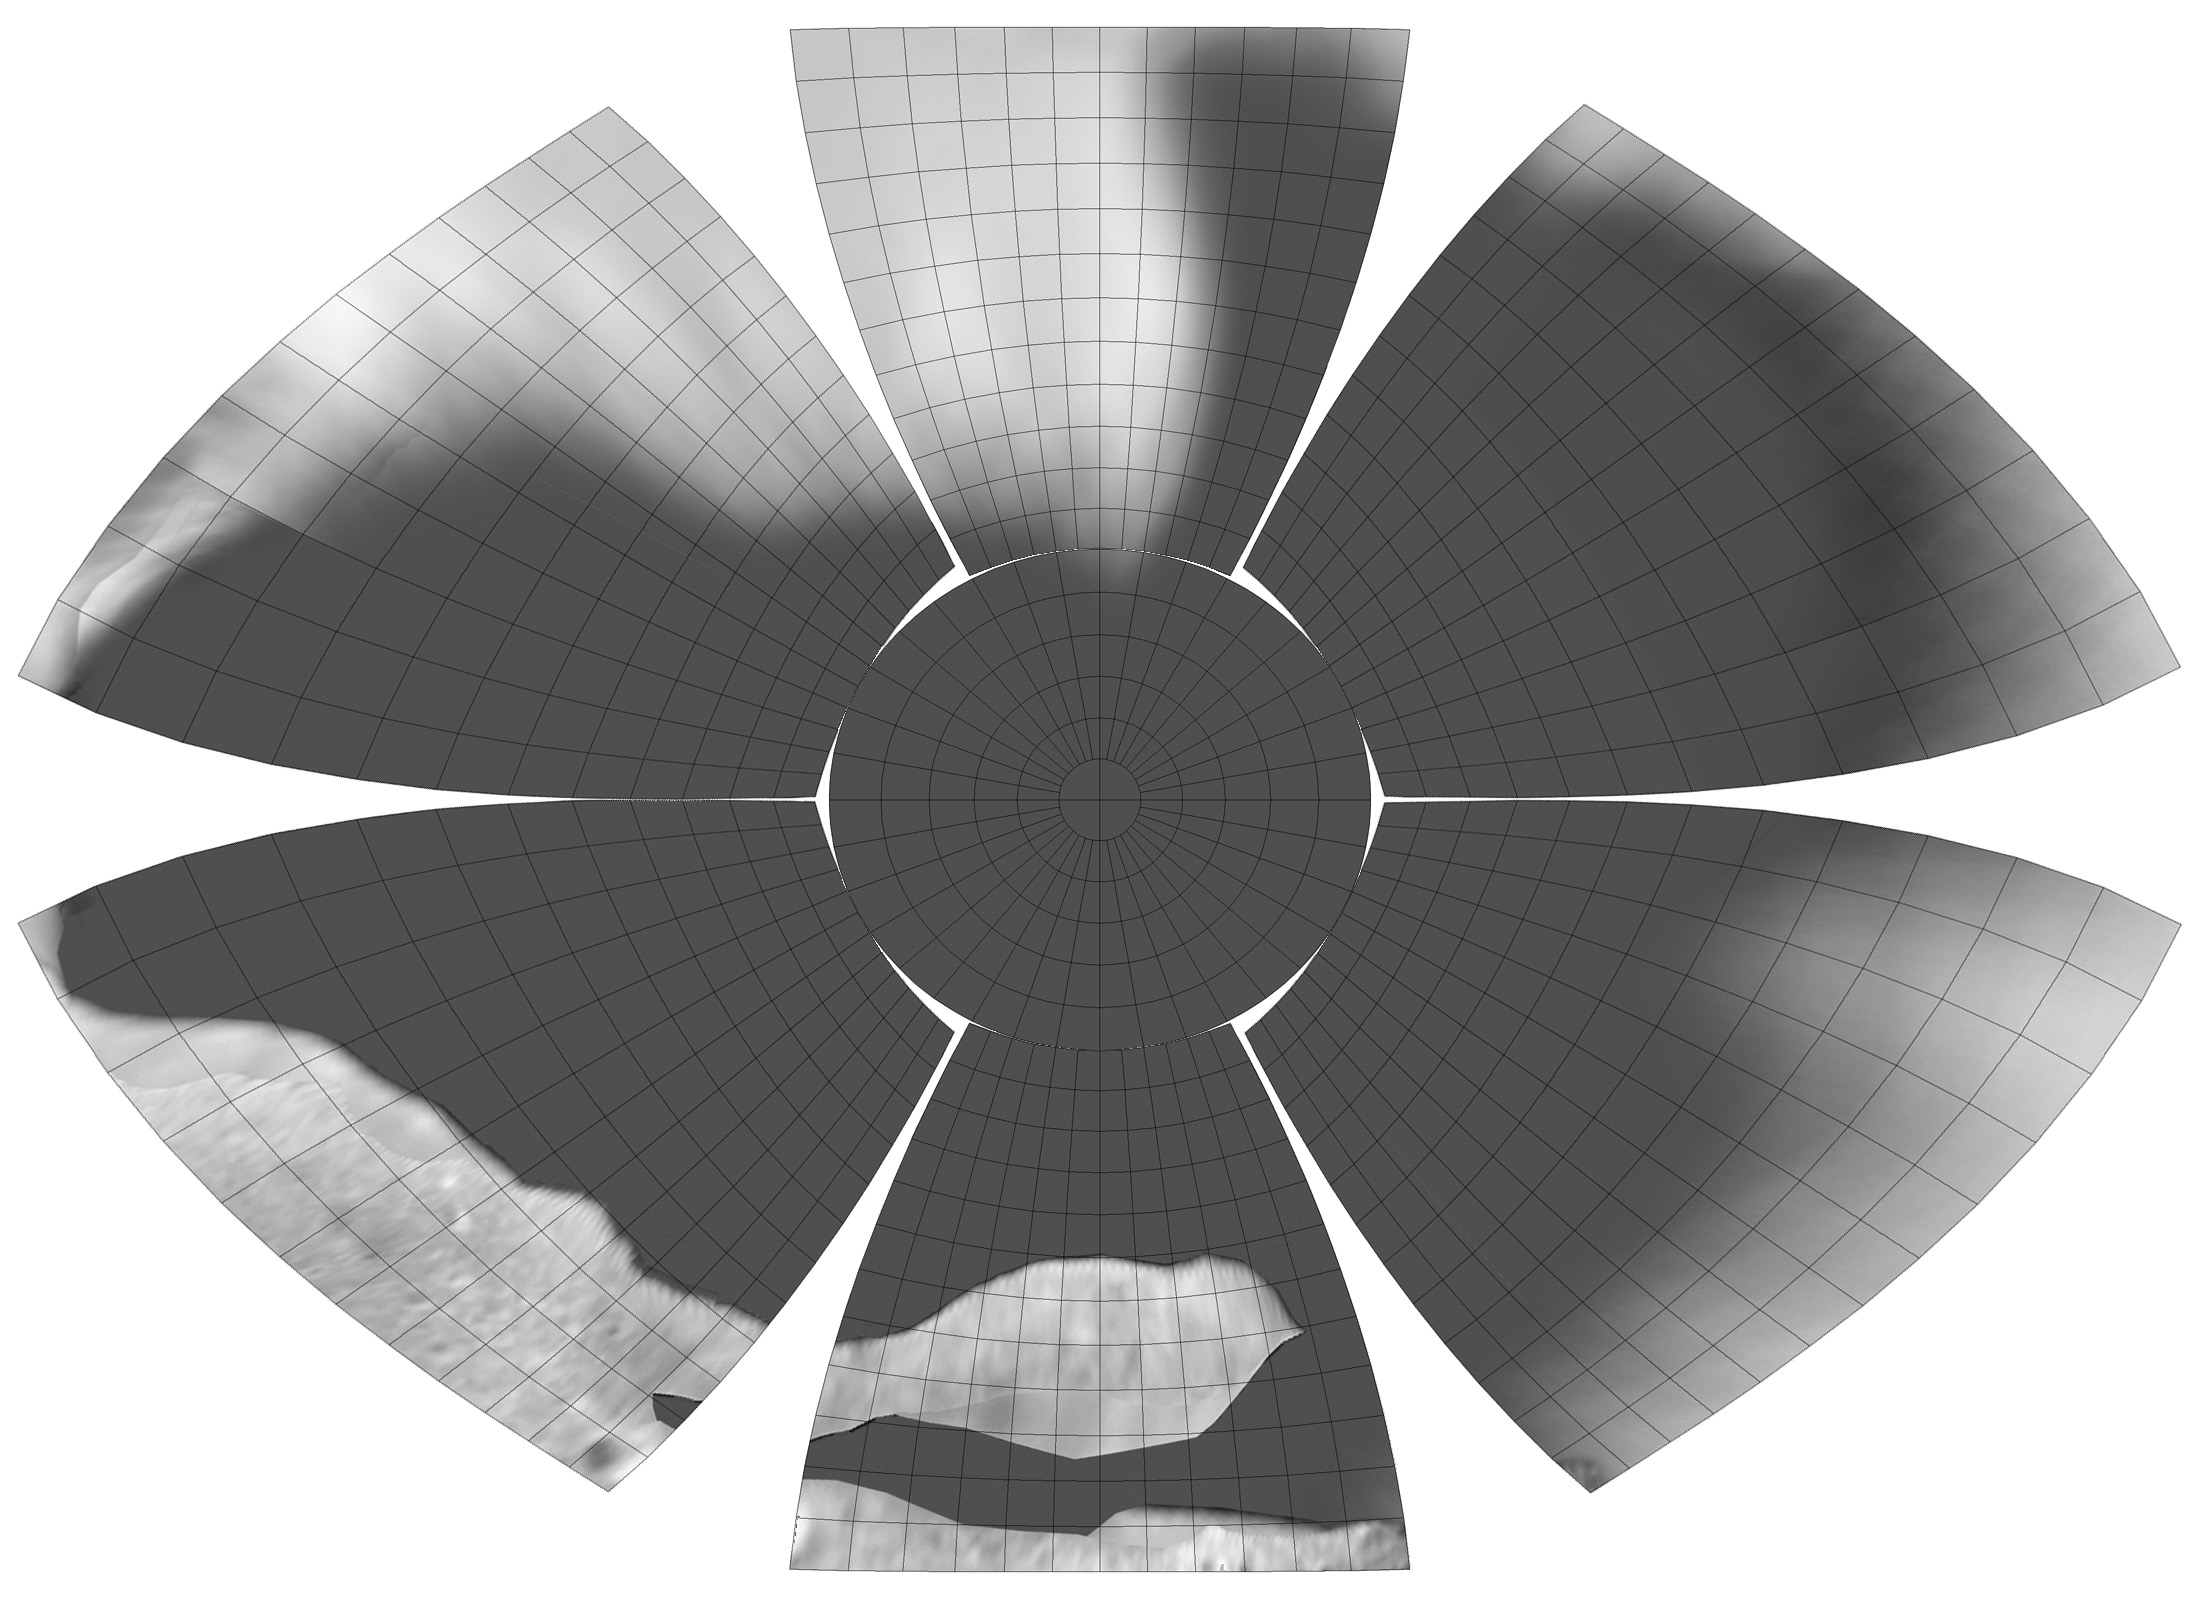
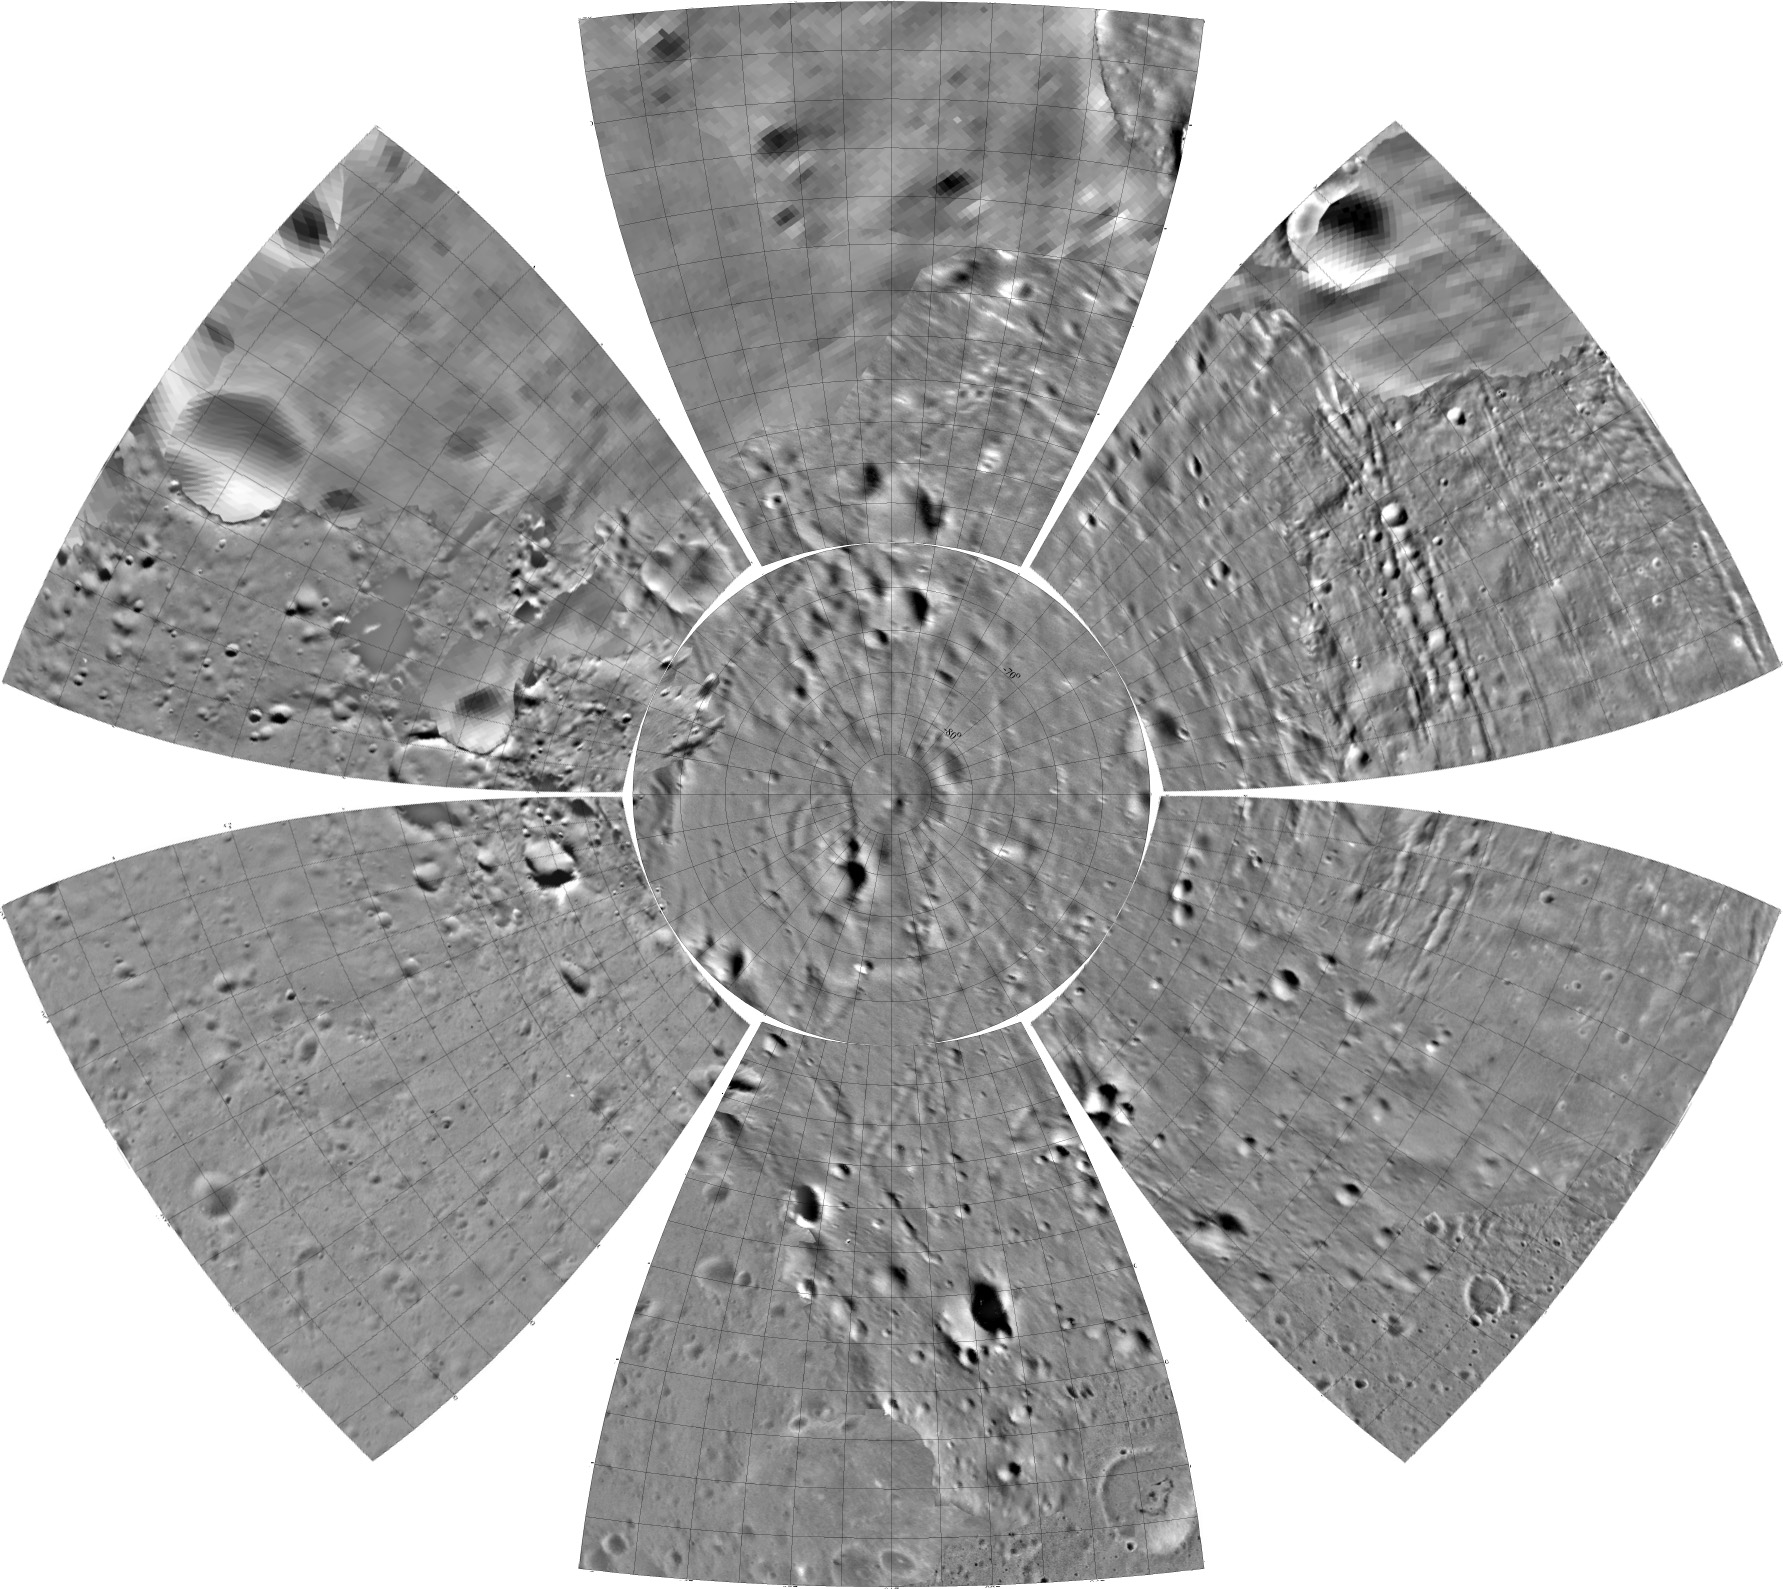
B. Globe gores: Composites of the gridded sheets above arranged around
the polar sheets in separate northern and southern hemispheres. These
may be cut out and assembled to make a globe, not perfectly shaped
but interesting.
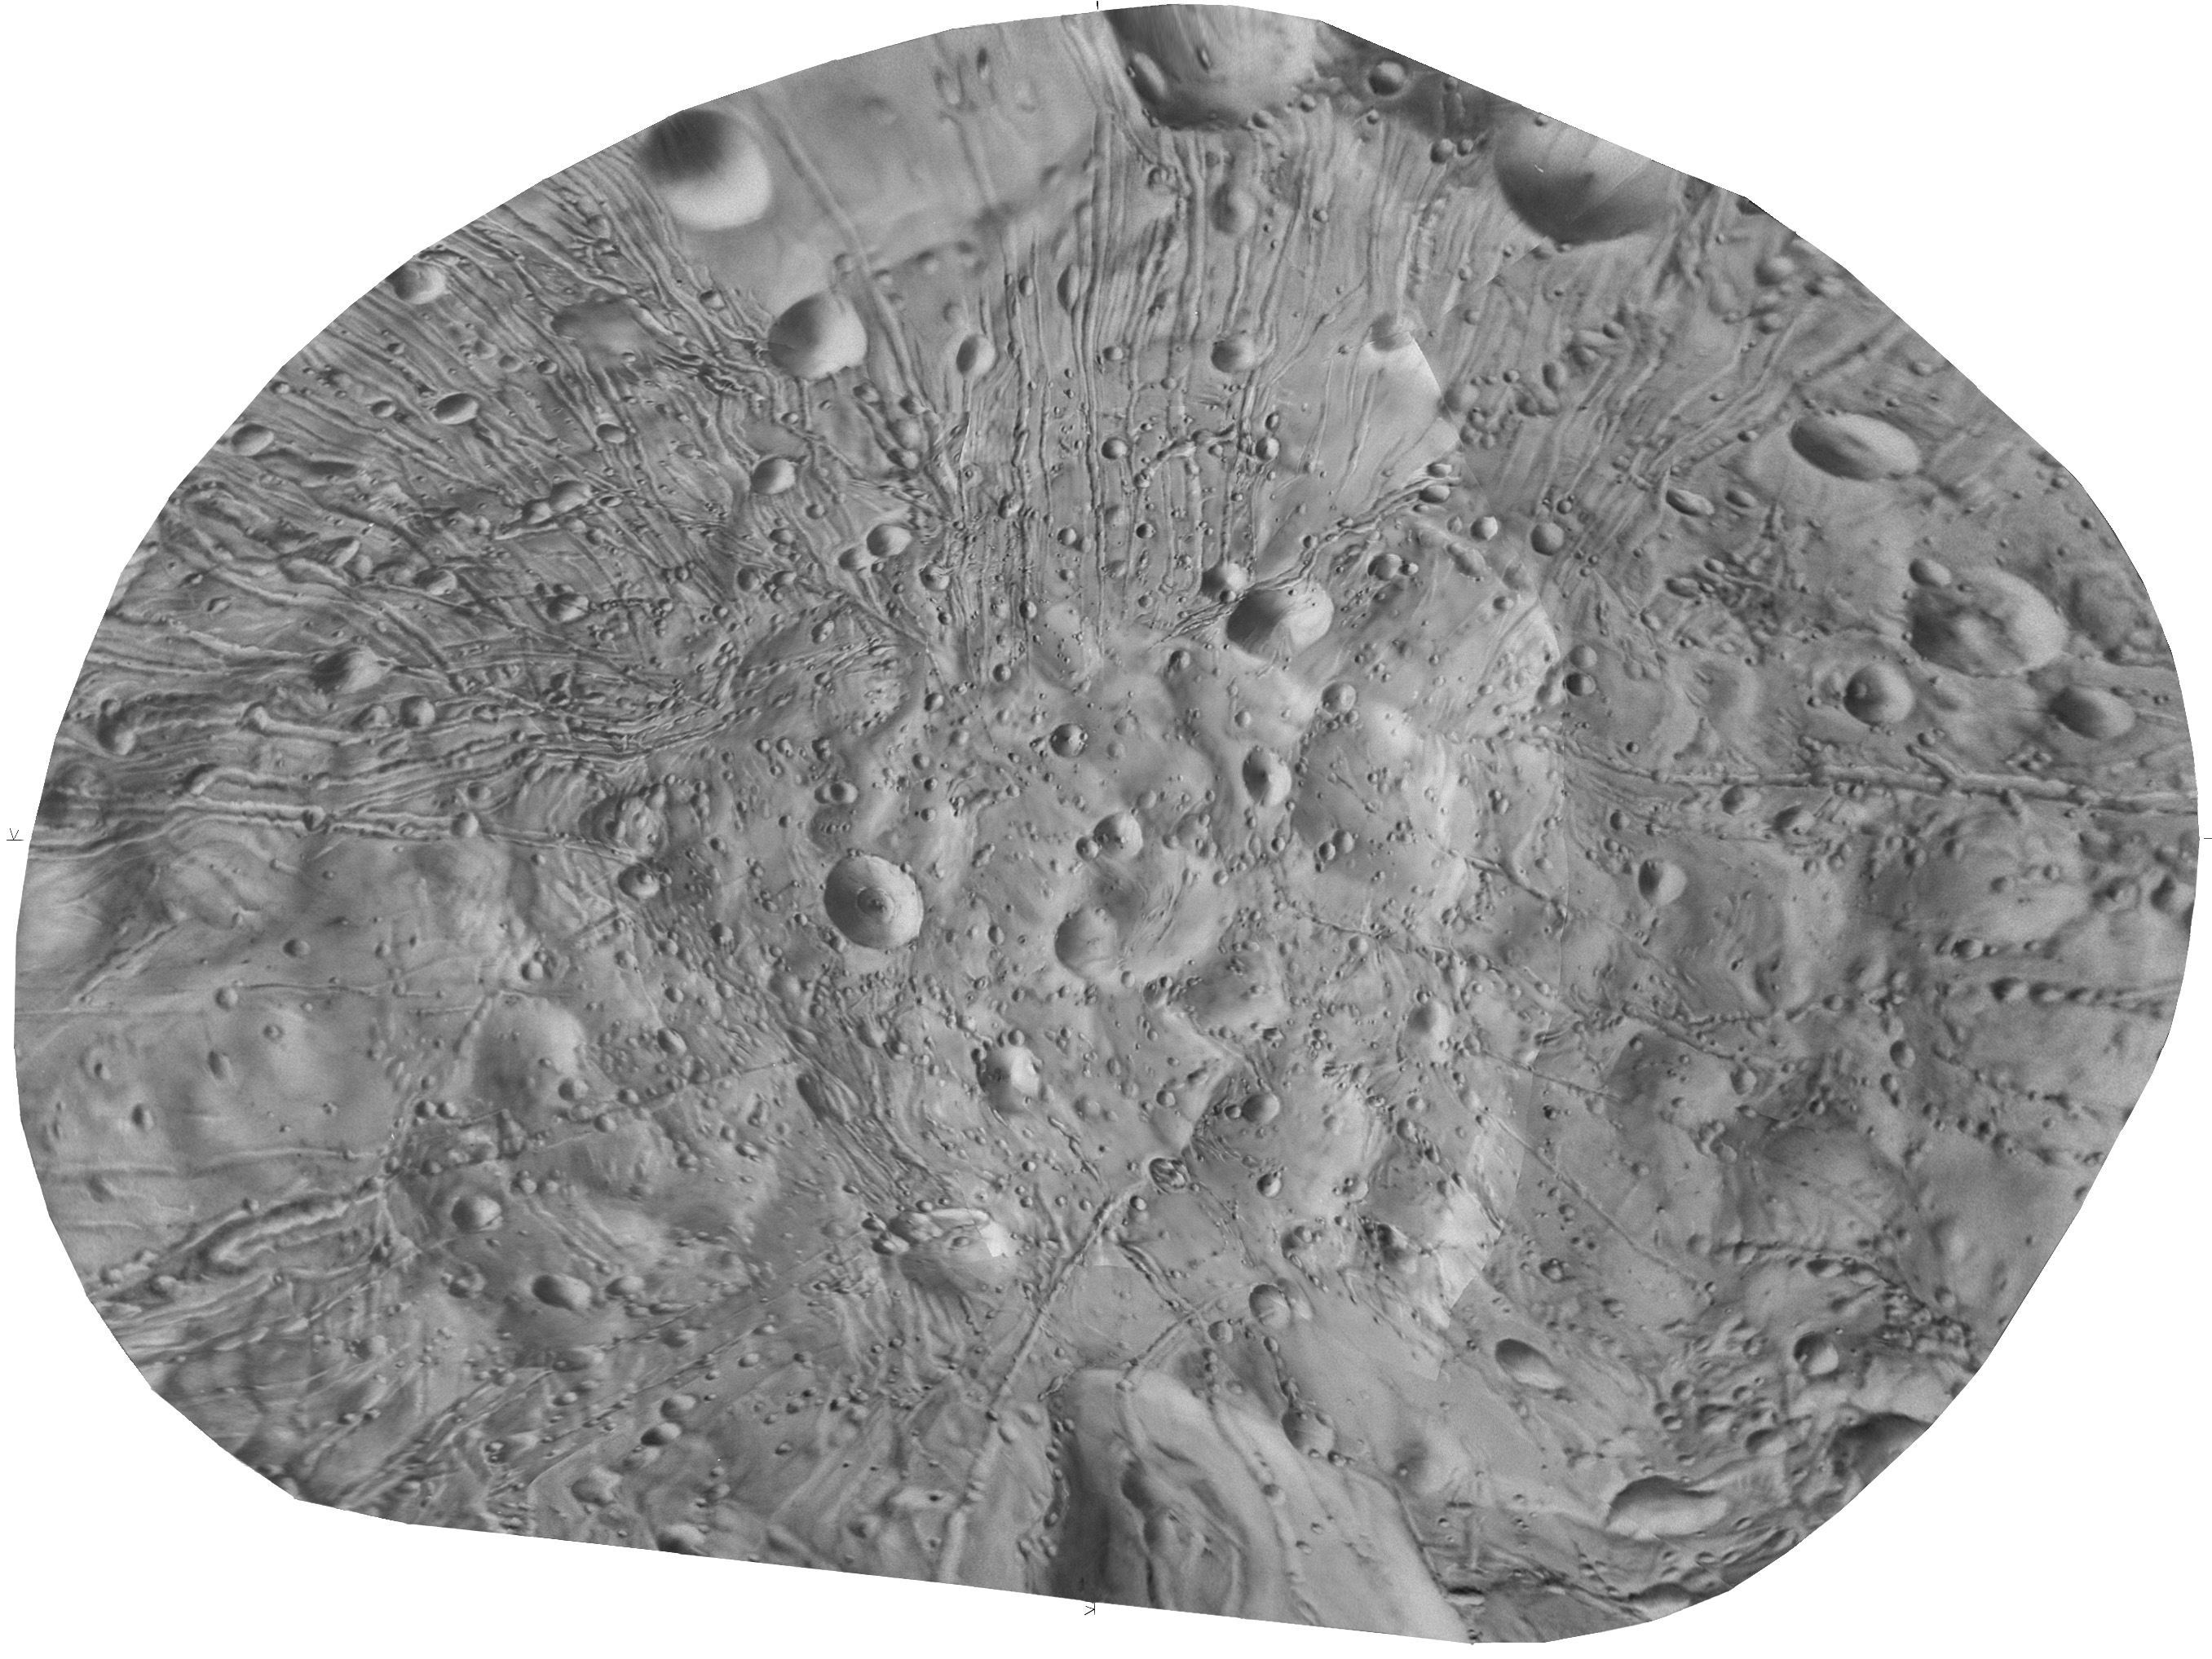
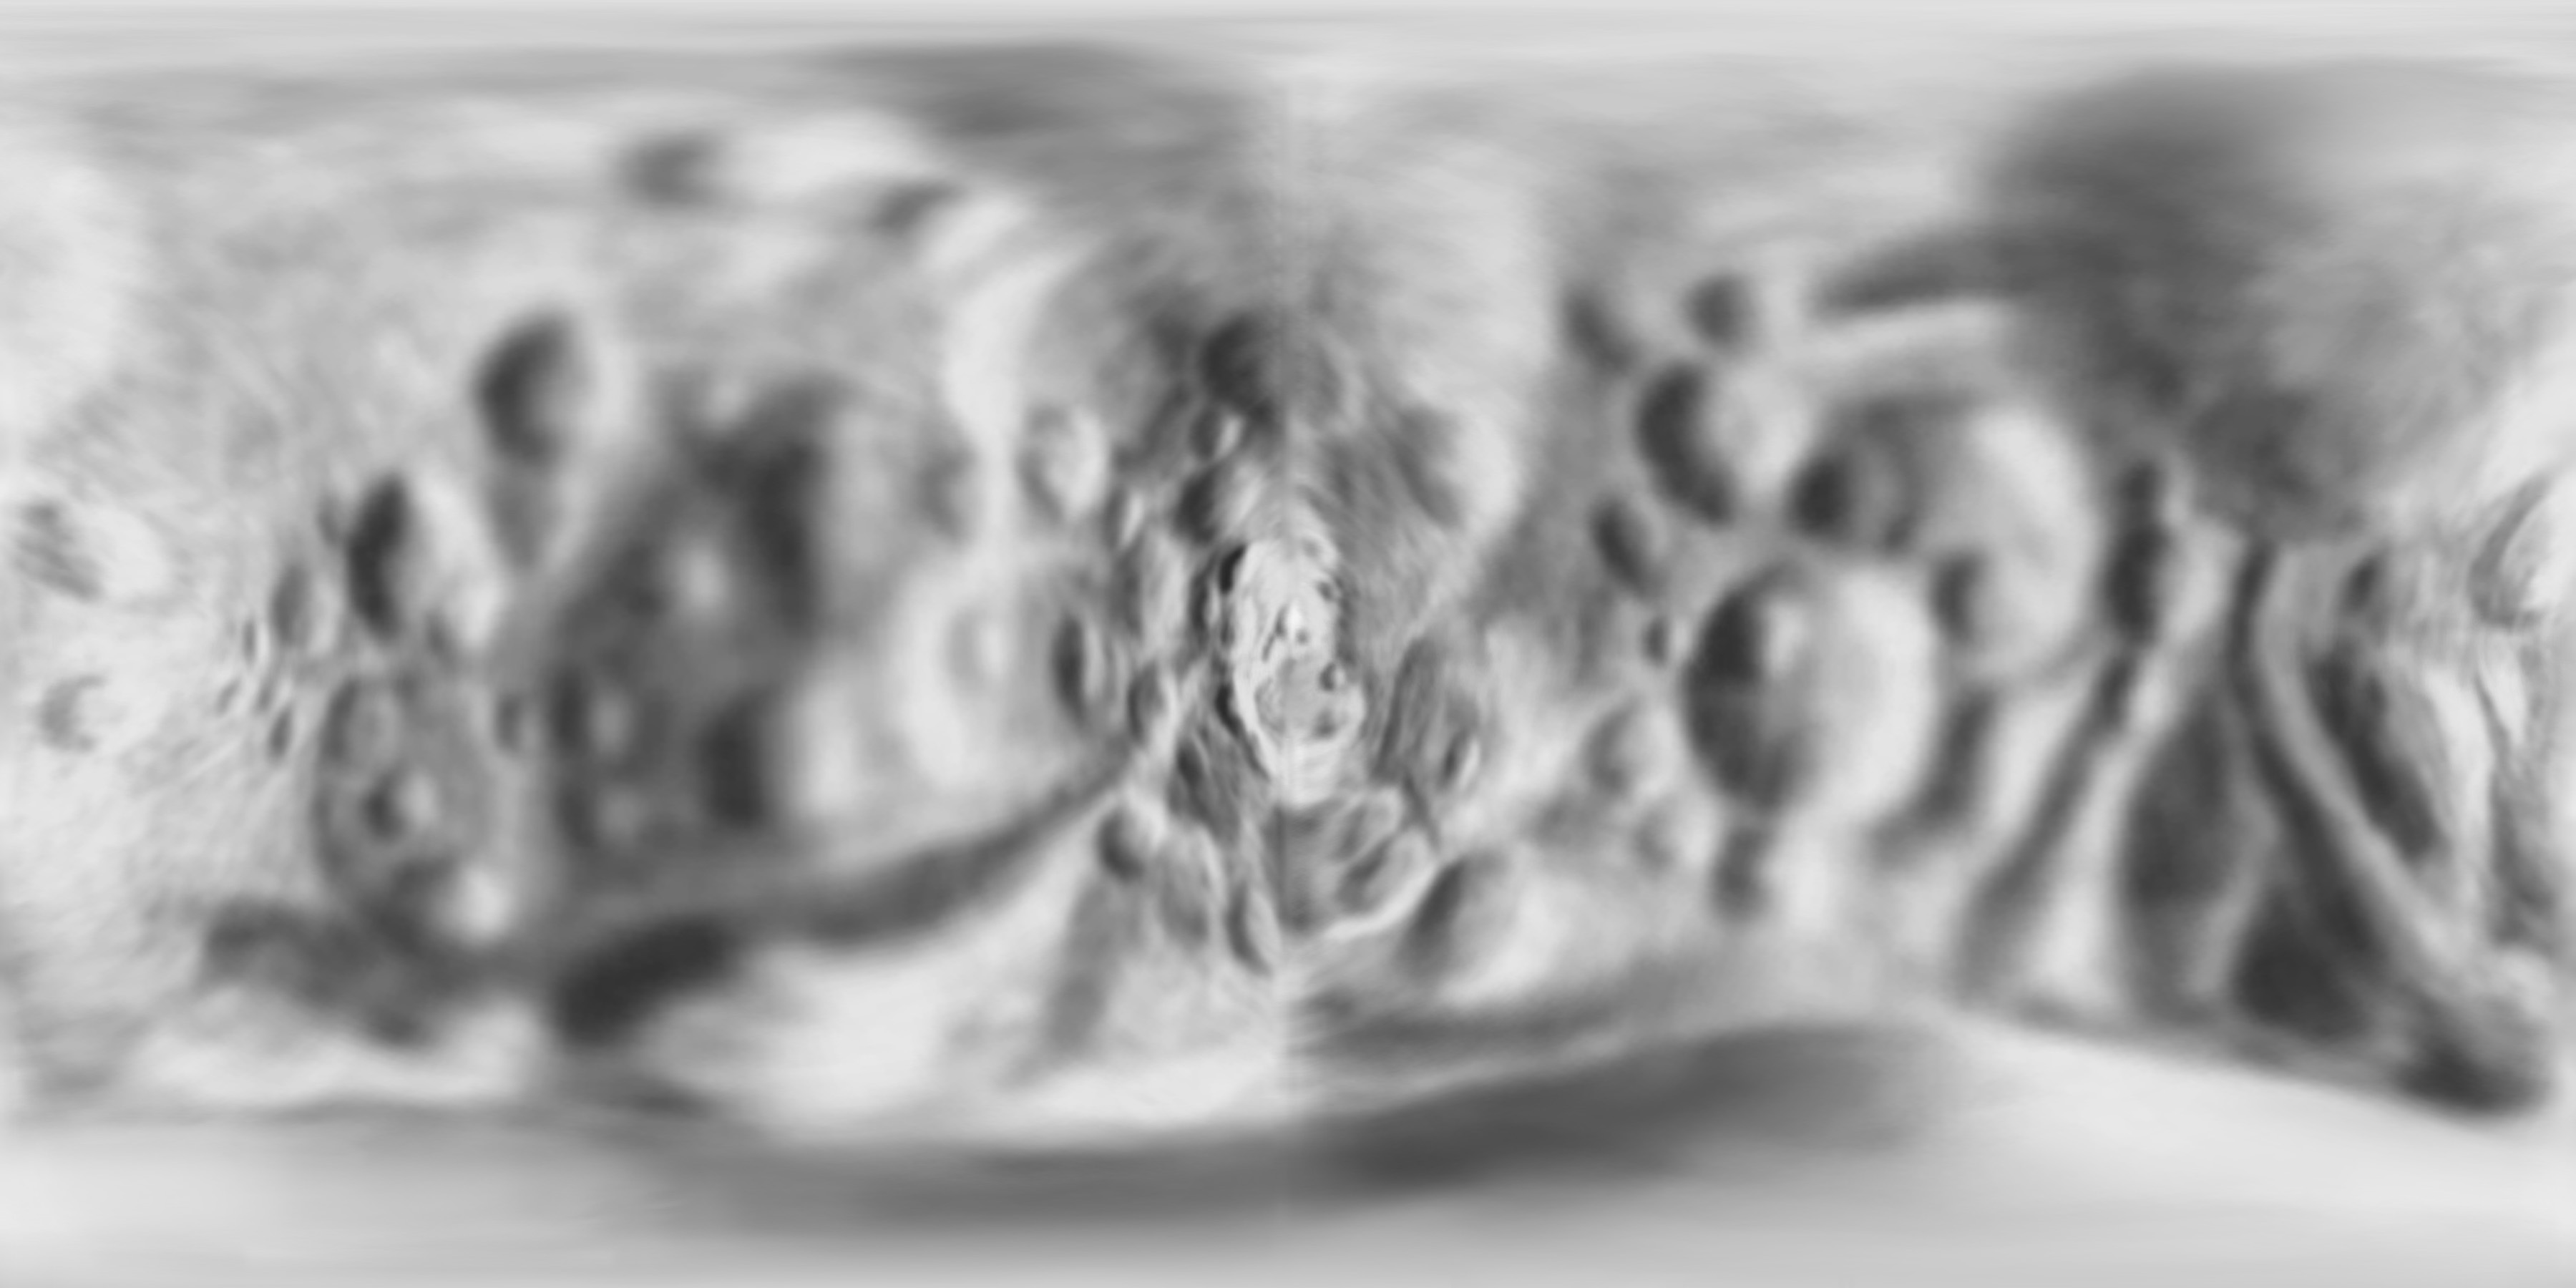
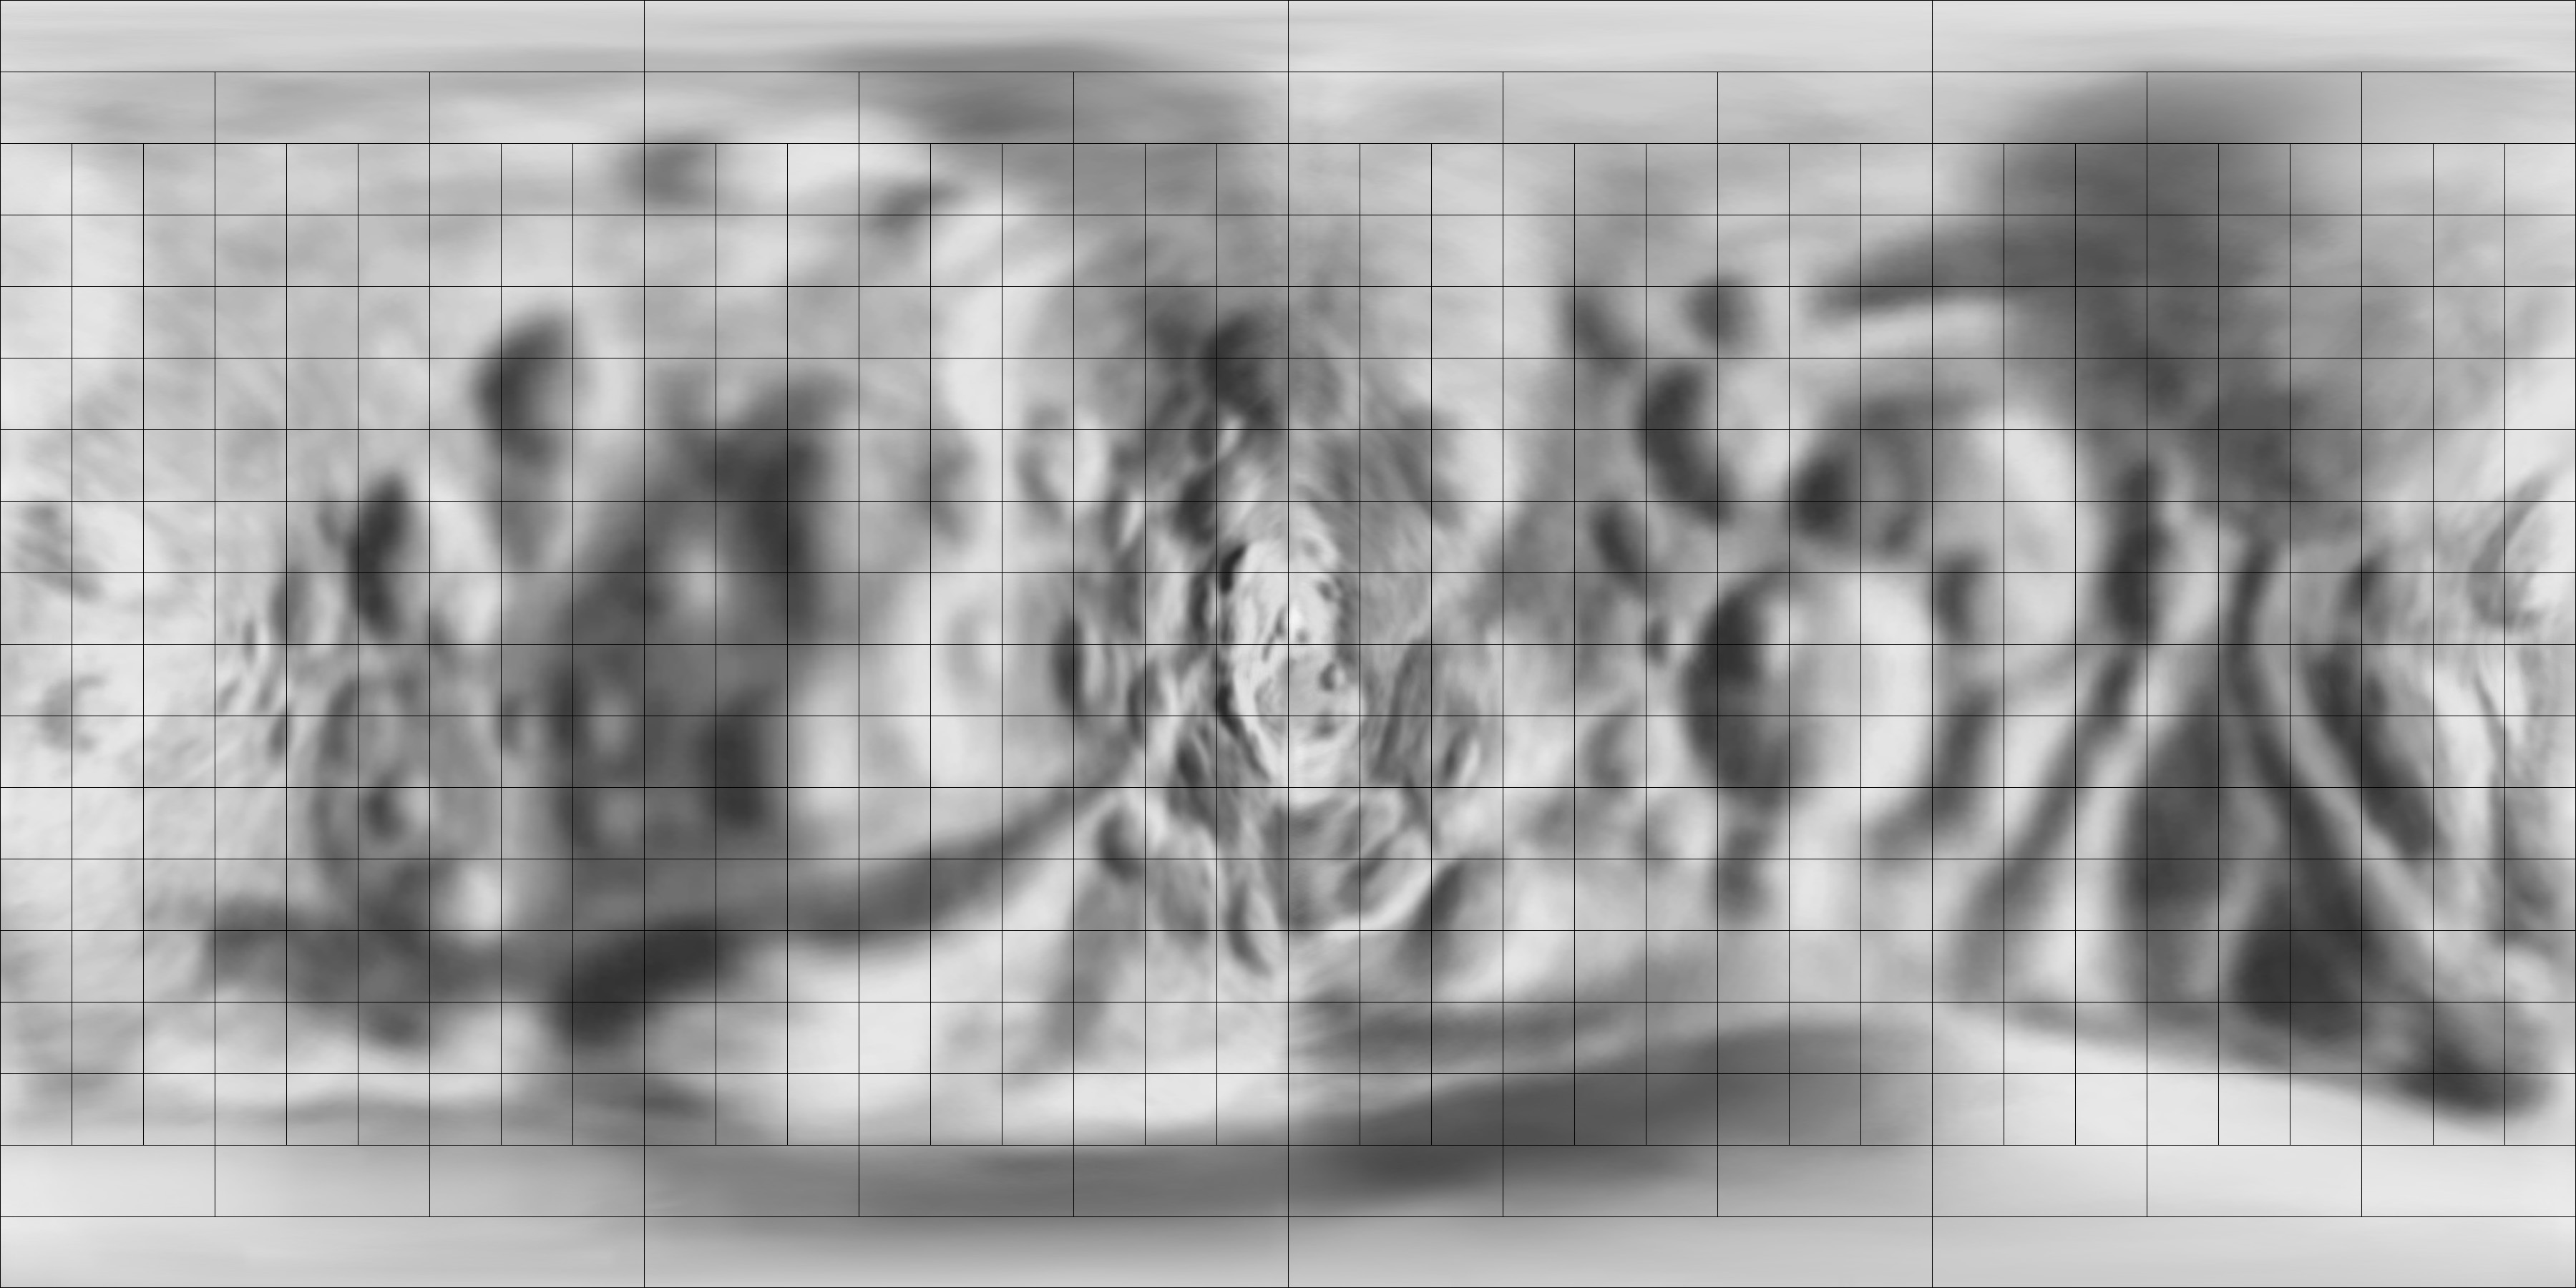
C. Relief maps in various projections.
The relief map was created initially by the U. S. Geological Survey.
It was based on a shape model considered to be less accurate than that
of Thomas and colleagues, and the original contains severe distortions
including positional errors of several km, incorrect pole positions and
two regions in which surface features were shown twice due to errors in
matching images to the shape. For the current version, the relief drawing has
been reprojected to fit the control established by Thomas and
colleagues, though positional errors of up to one degree (several
hundred metres) remain due to limitations of the drawing itself and
the reprojection method. It is given here in simple cylindrical
projection, polar azimuthal equidistant projection, and in two
projections devised specifically for non-spherical worlds:
Bugaevsky's conformal cylindrical projection for the triaxial
ellipsoid and the Morphographic conformal projection.
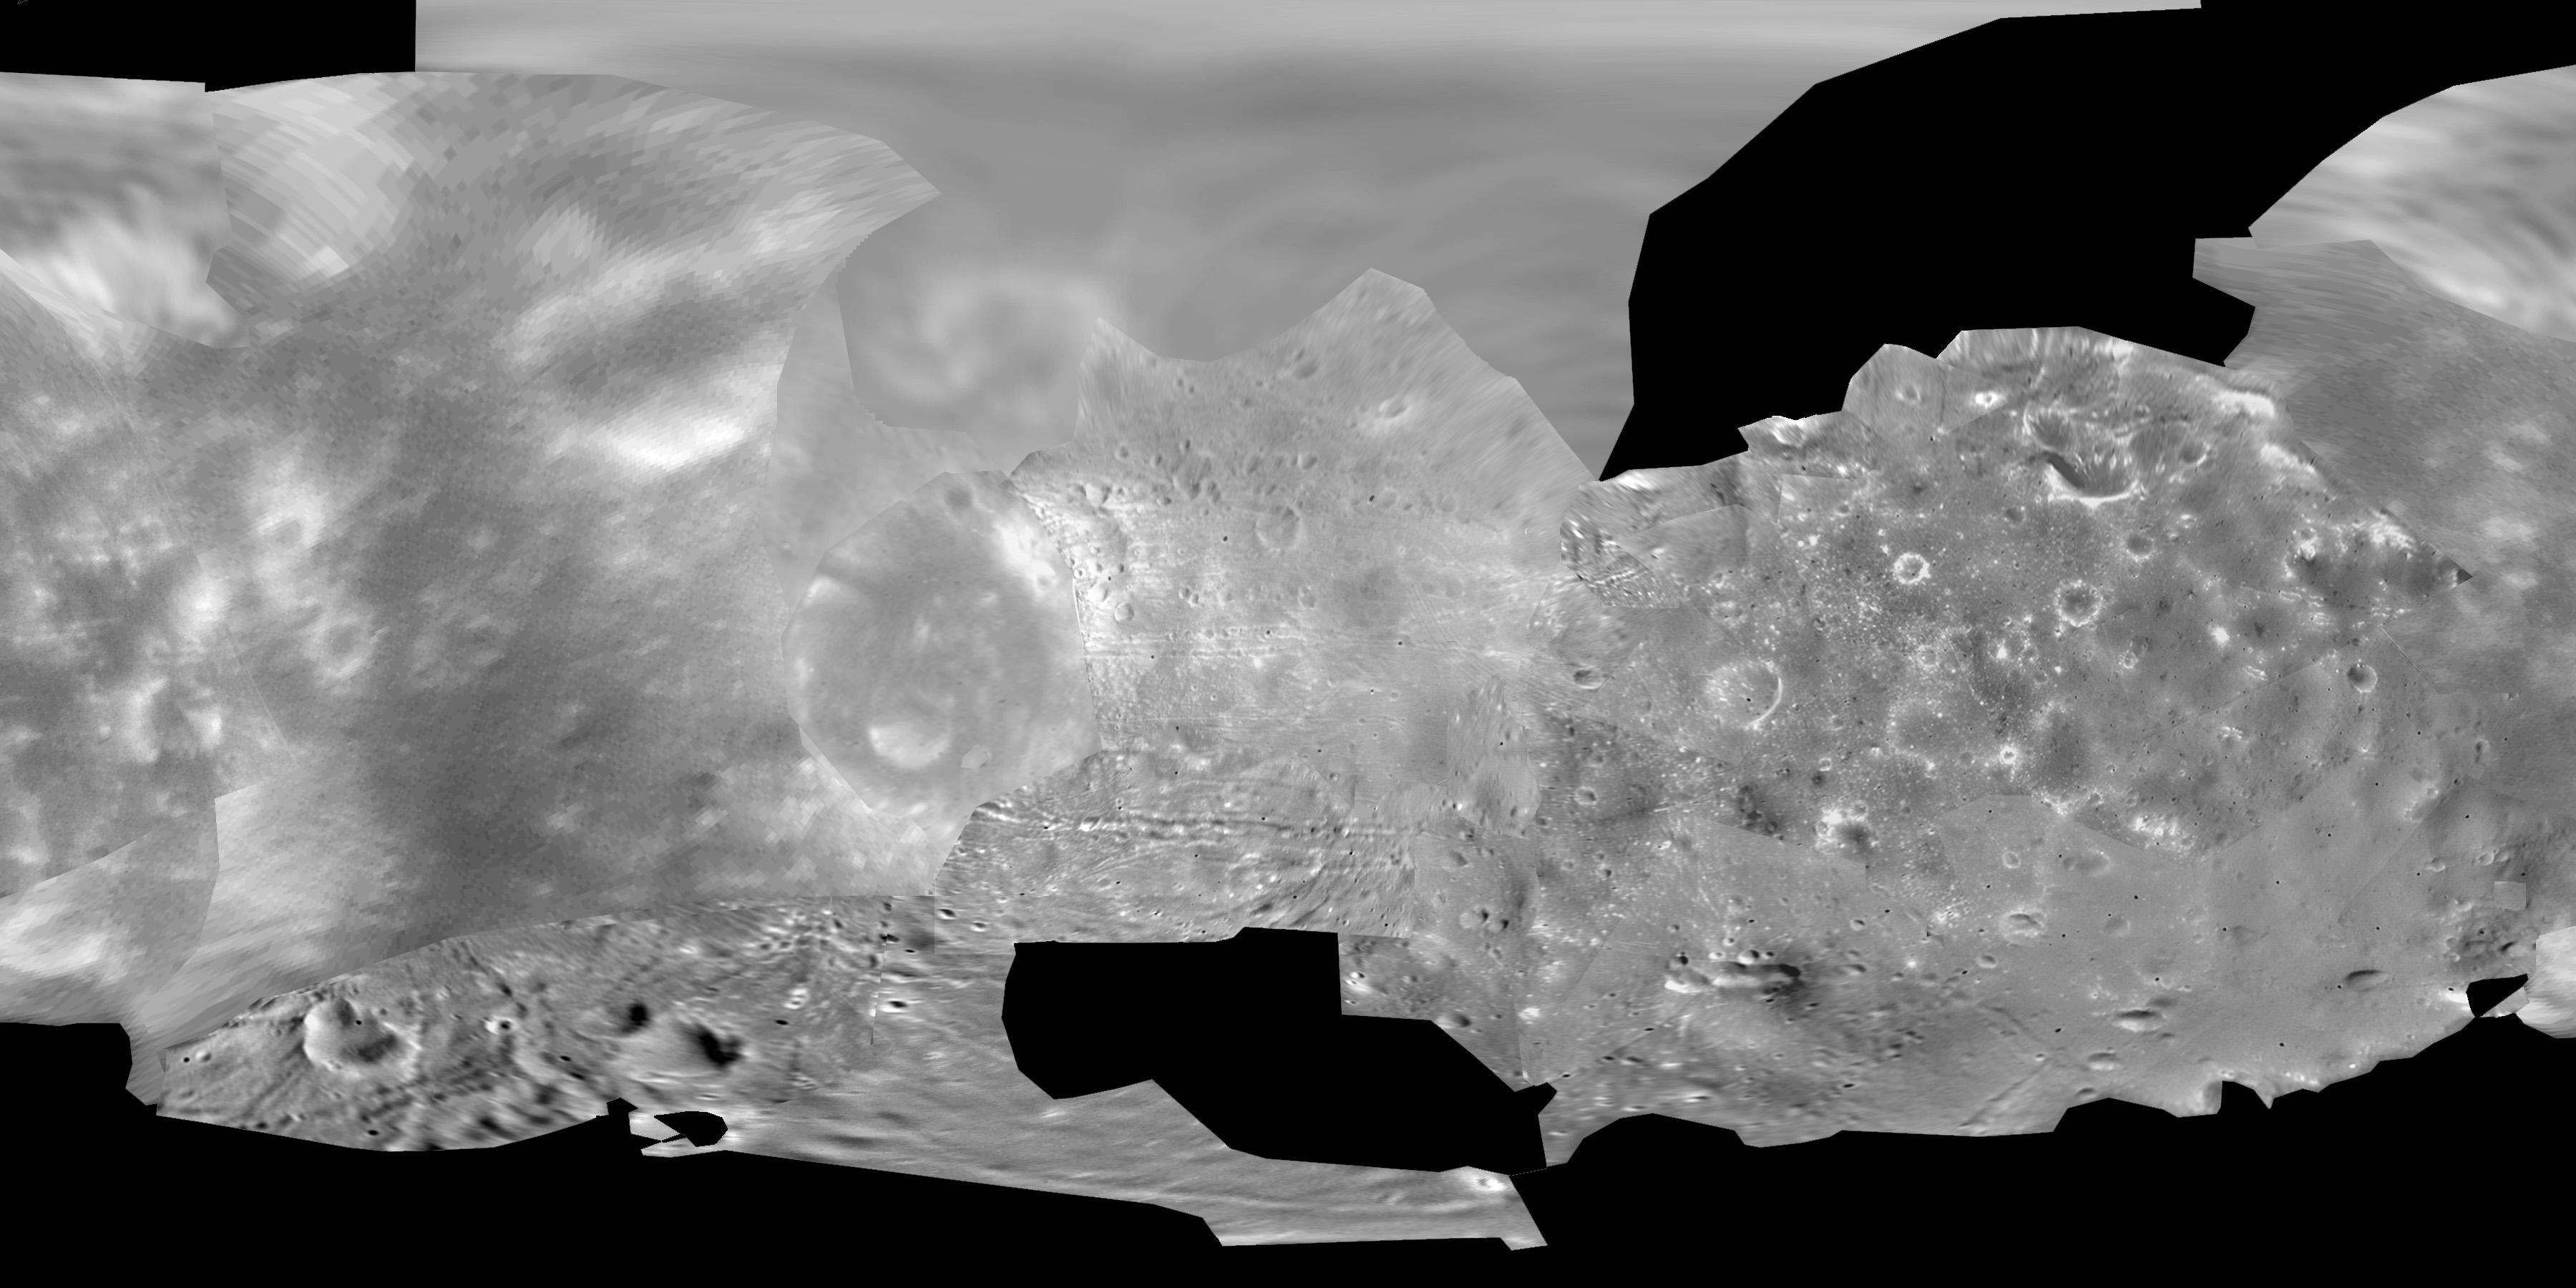
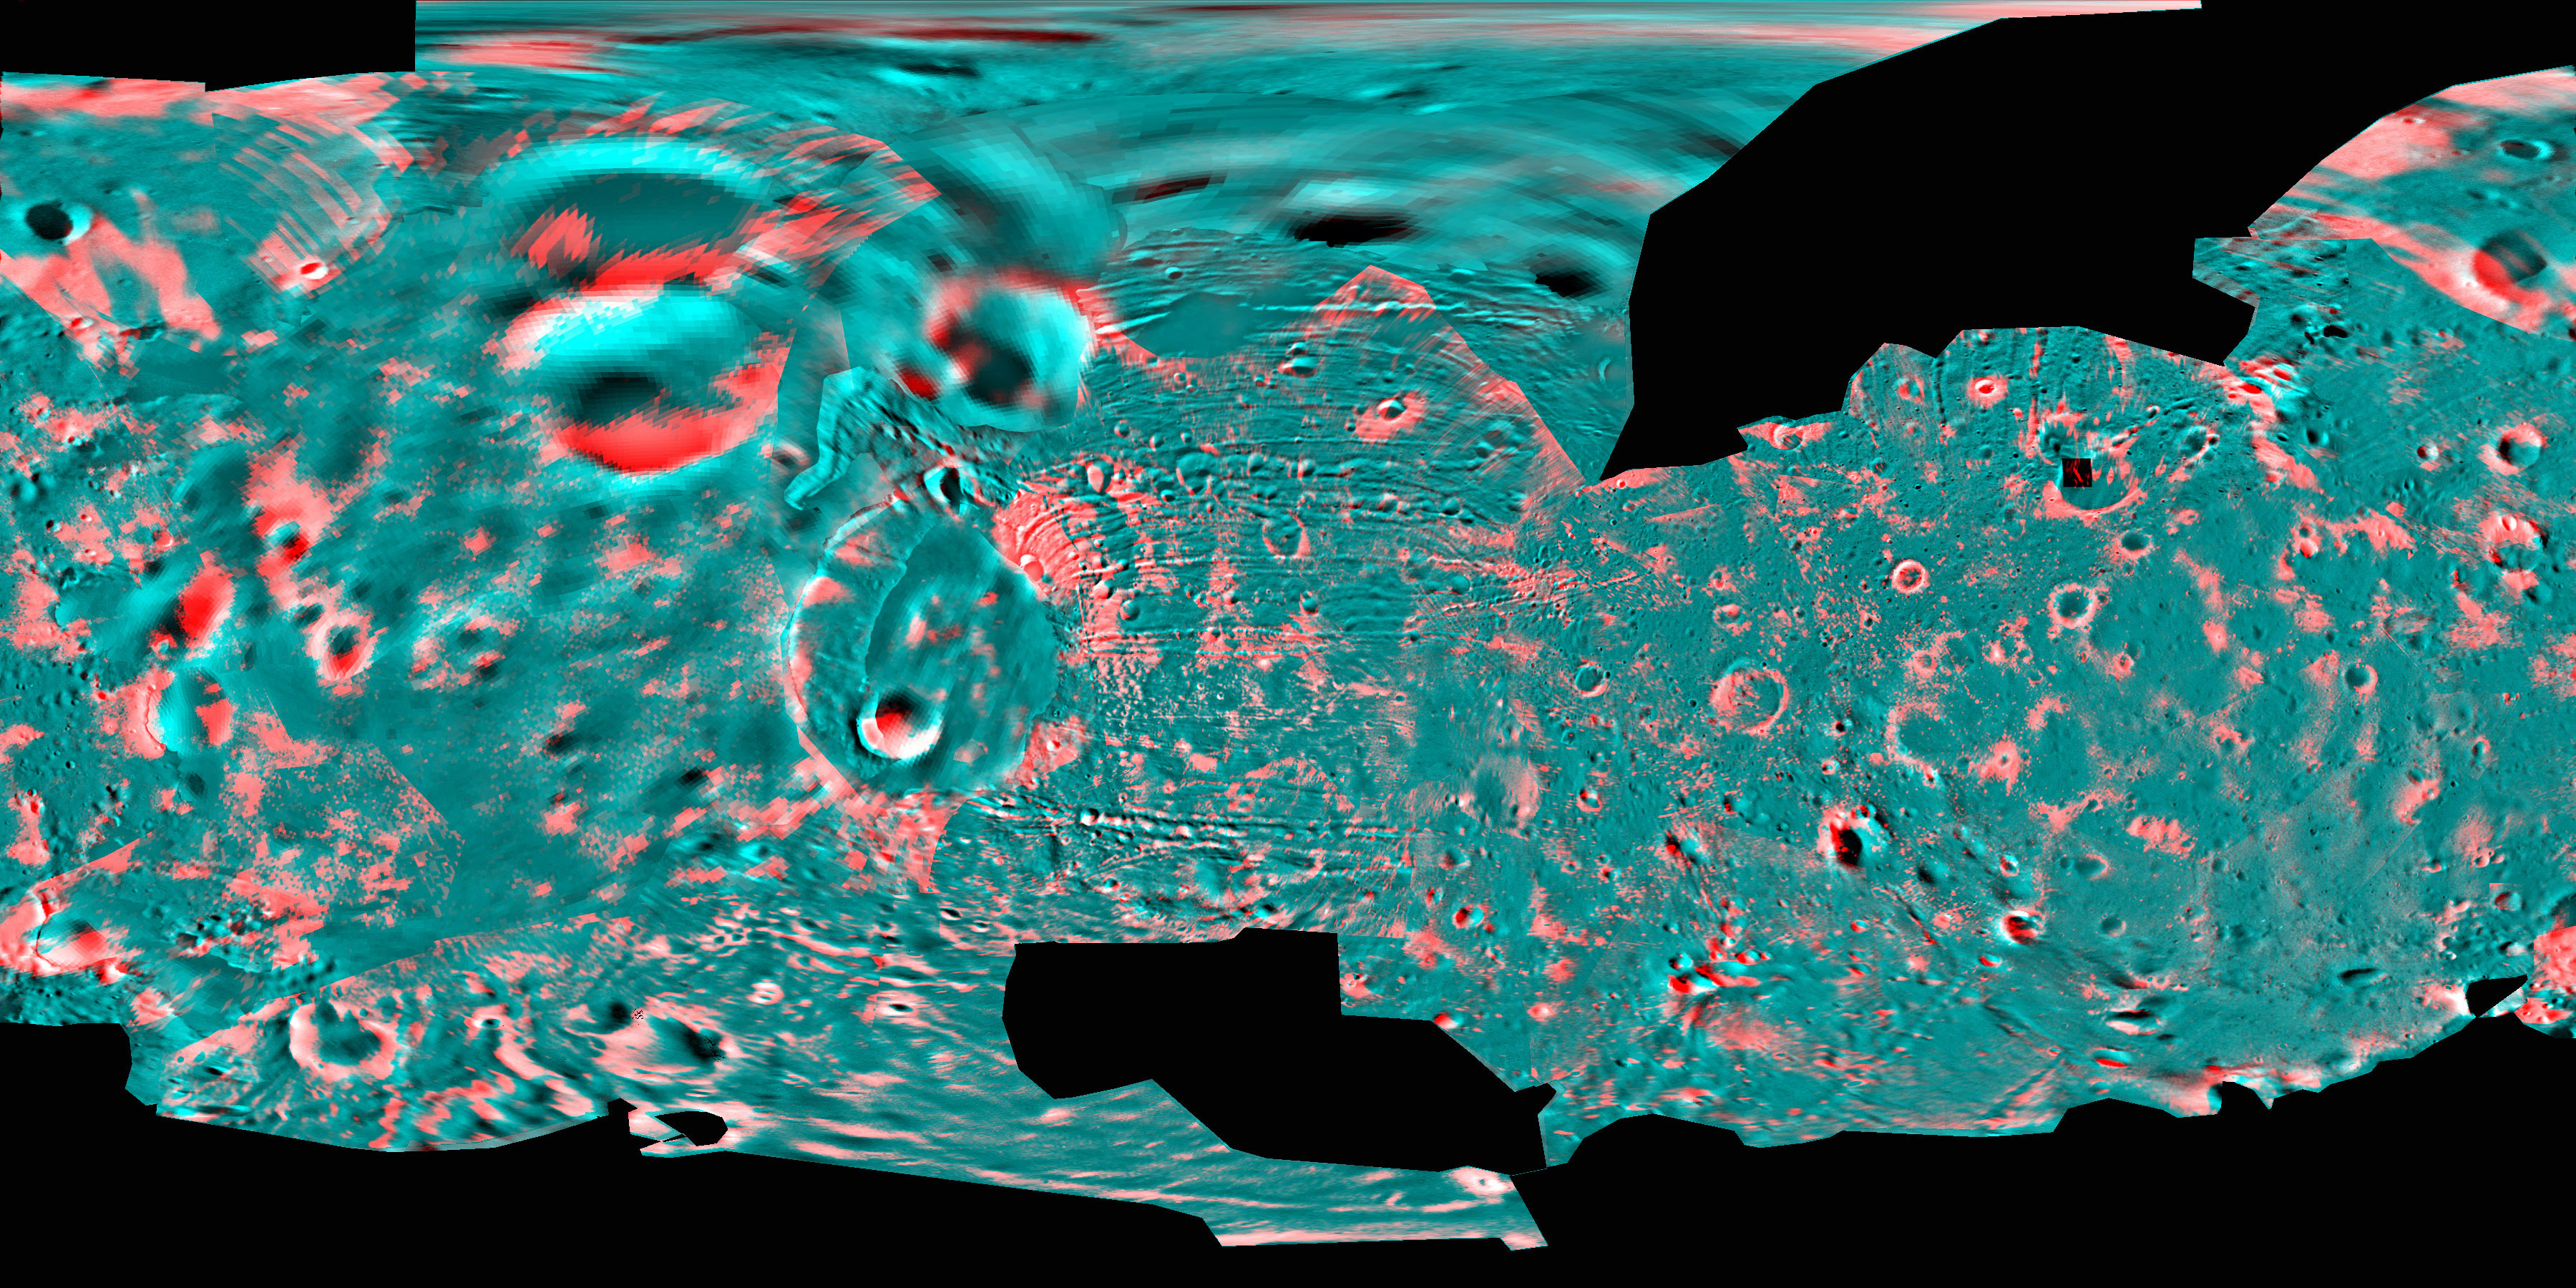
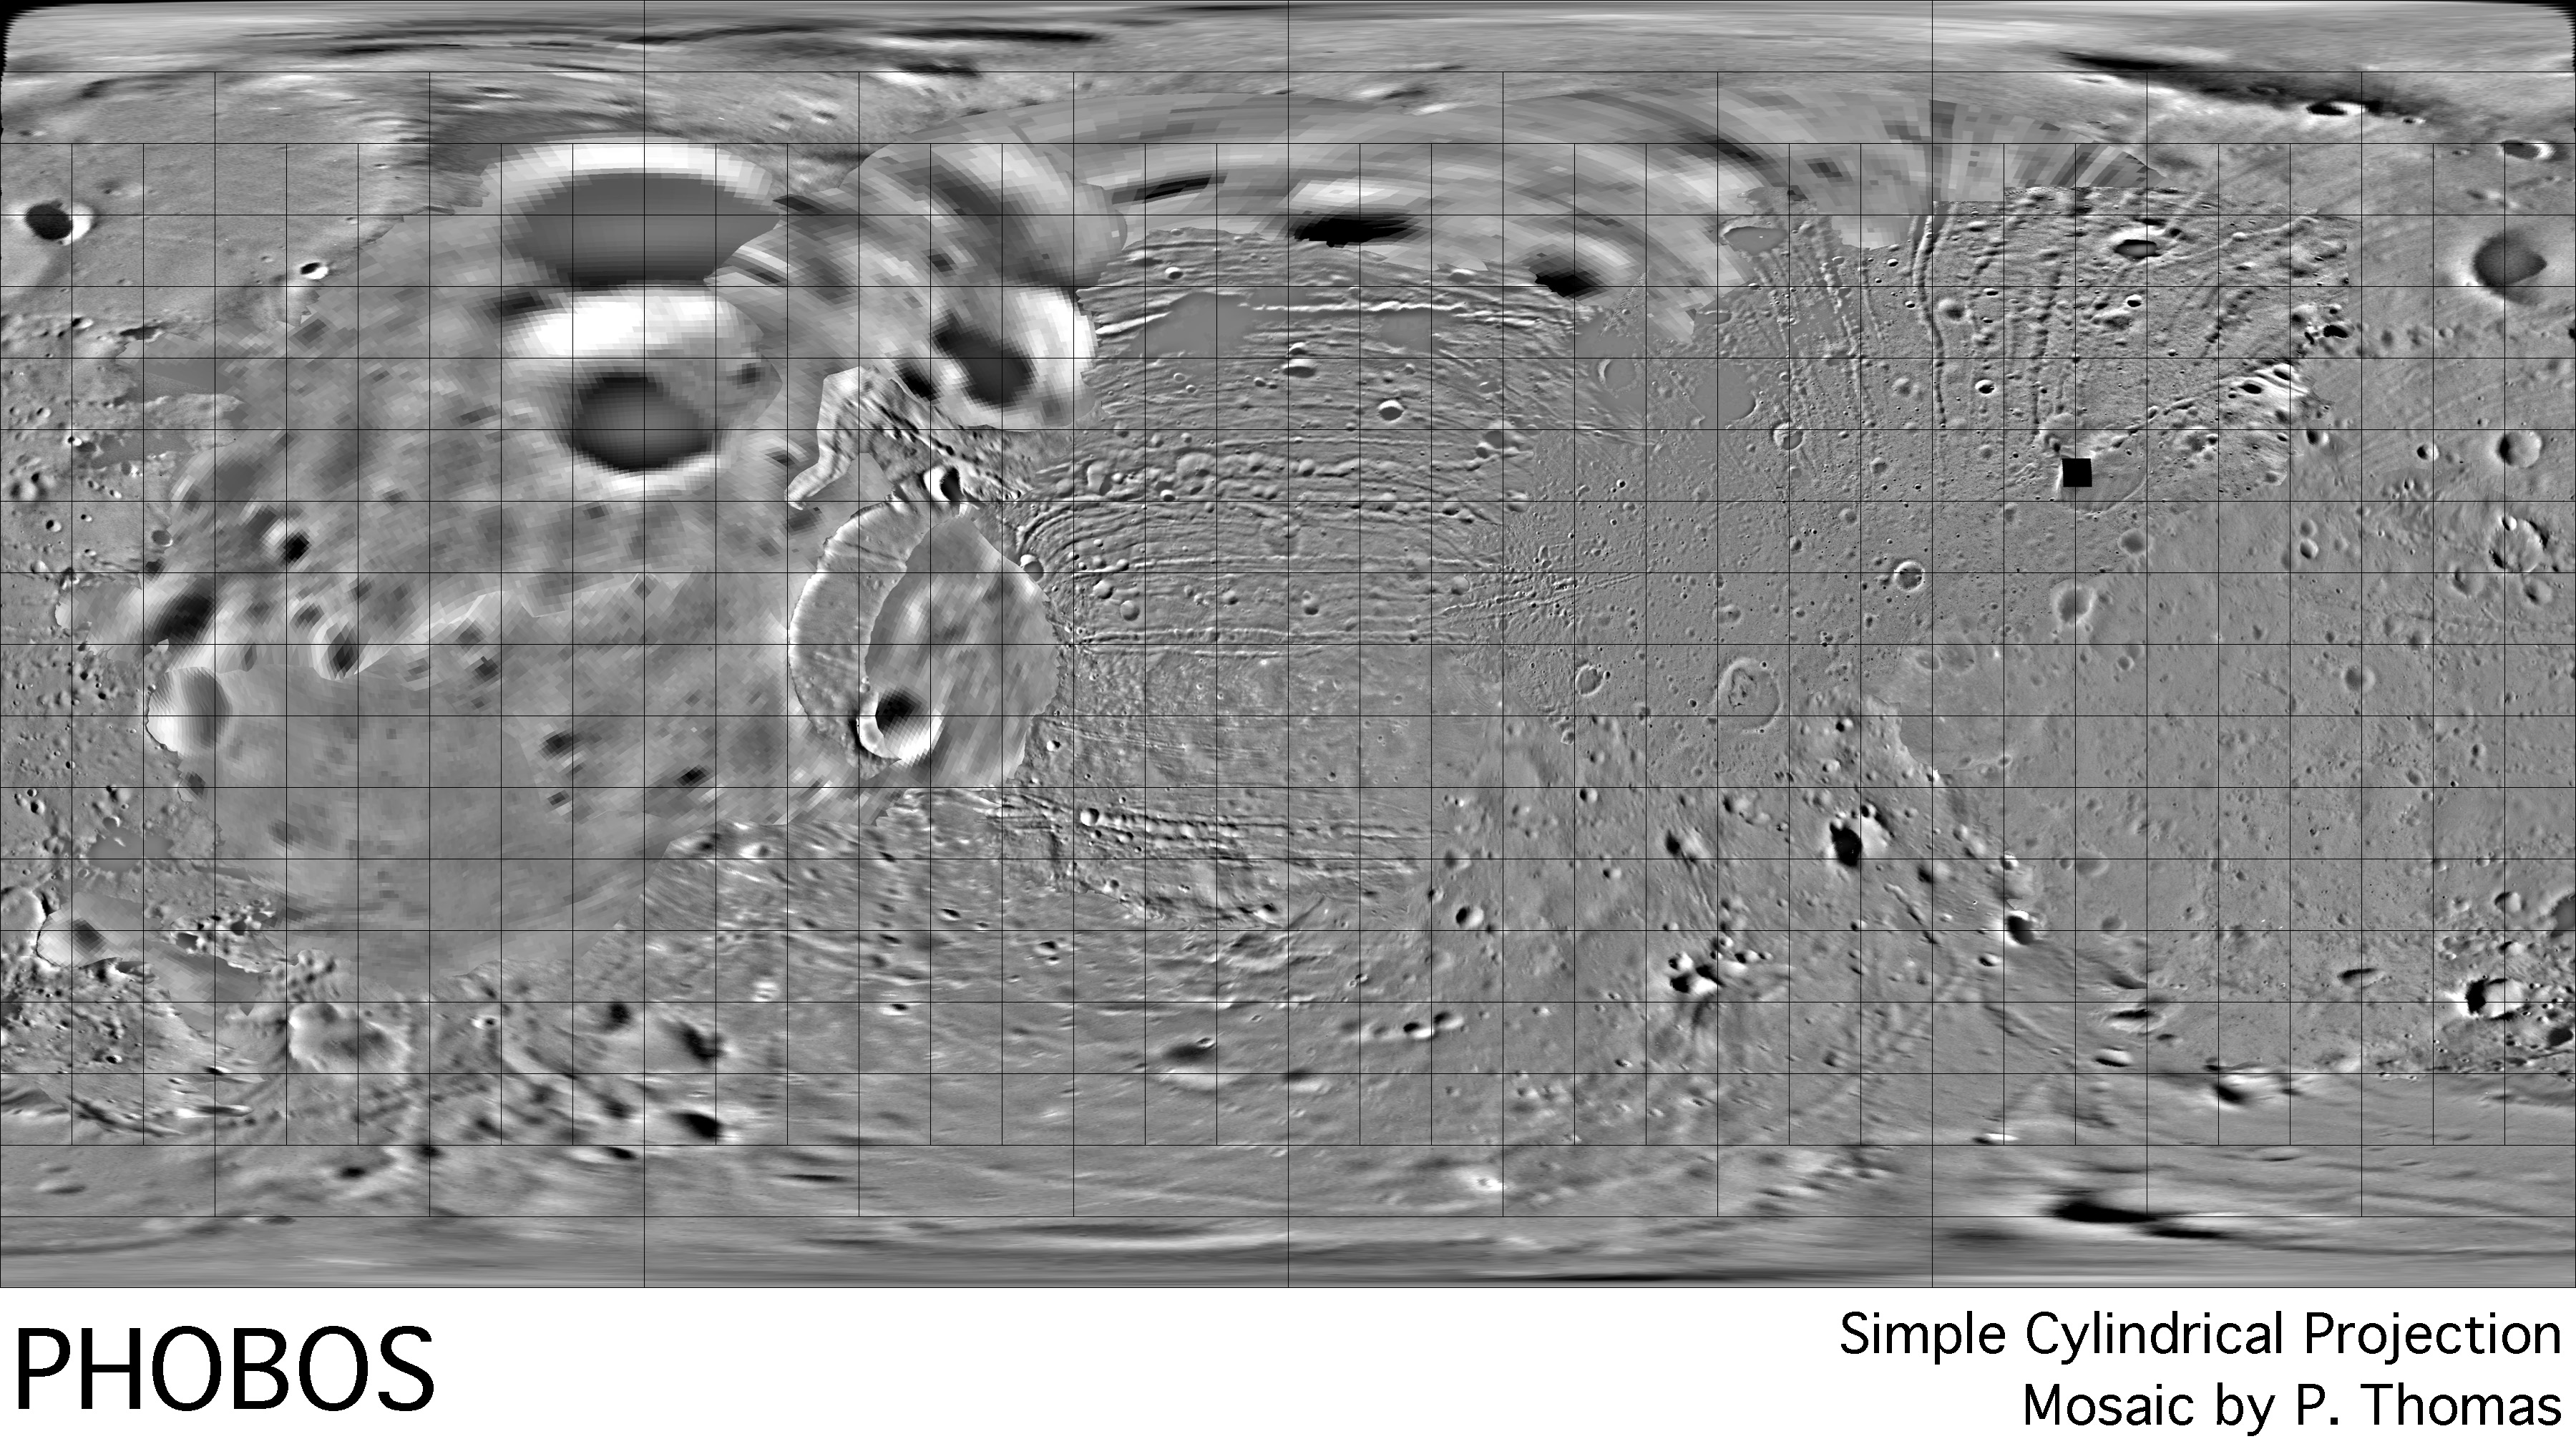
D. Global Simple Cylindrical projection mosaics at 10 pixels/degree
of several additional data sets:
Phobos bright markings.
This mosaic by P. Stooke and S. Berry, based on positional control by
P. Thomas, is constructed from low phase angle images by the Viking
Orbiters and Phobos 2. It is designed to show only the locations of local
bright markings on Phobos, not the true albedo. Some bright markings may
be caused by local photometric function variations (caused by variations
in grains size, etc.) rather than true albedo variations. Photometric
validity was intentionally sacrificed during image processing.
Bright markings superimposed
on Viking photomosaic. The previous file superimposed on the
Viking Orbiter mosaic of Peter Thomas, intended to show the relationship
between bright markings and local topography.
Viking image mosaic with
lat/lon grid. Mosaic by Peter Thomas, overlaid with an unlabelled
grid at ten degree spacing.
Mariner 9 photomosaic
by P. Stooke and J. Pfau, University of Western Ontario.
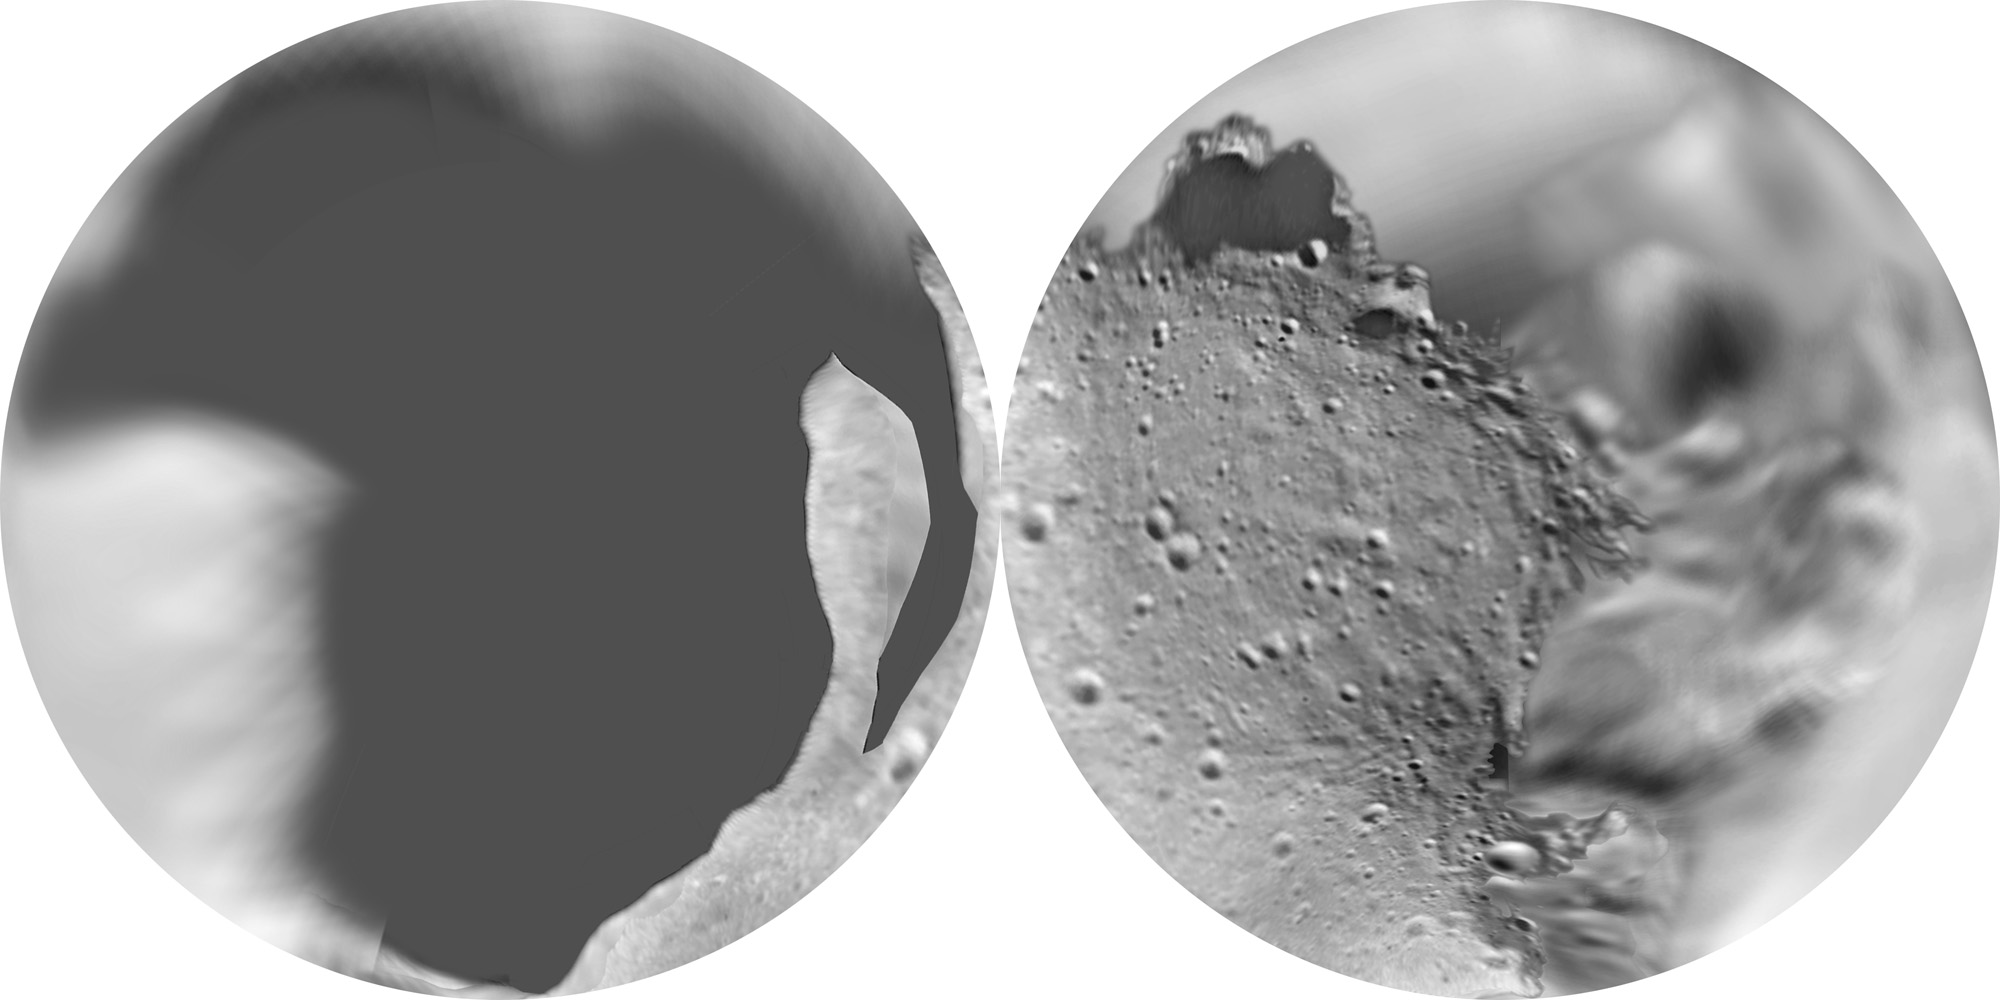
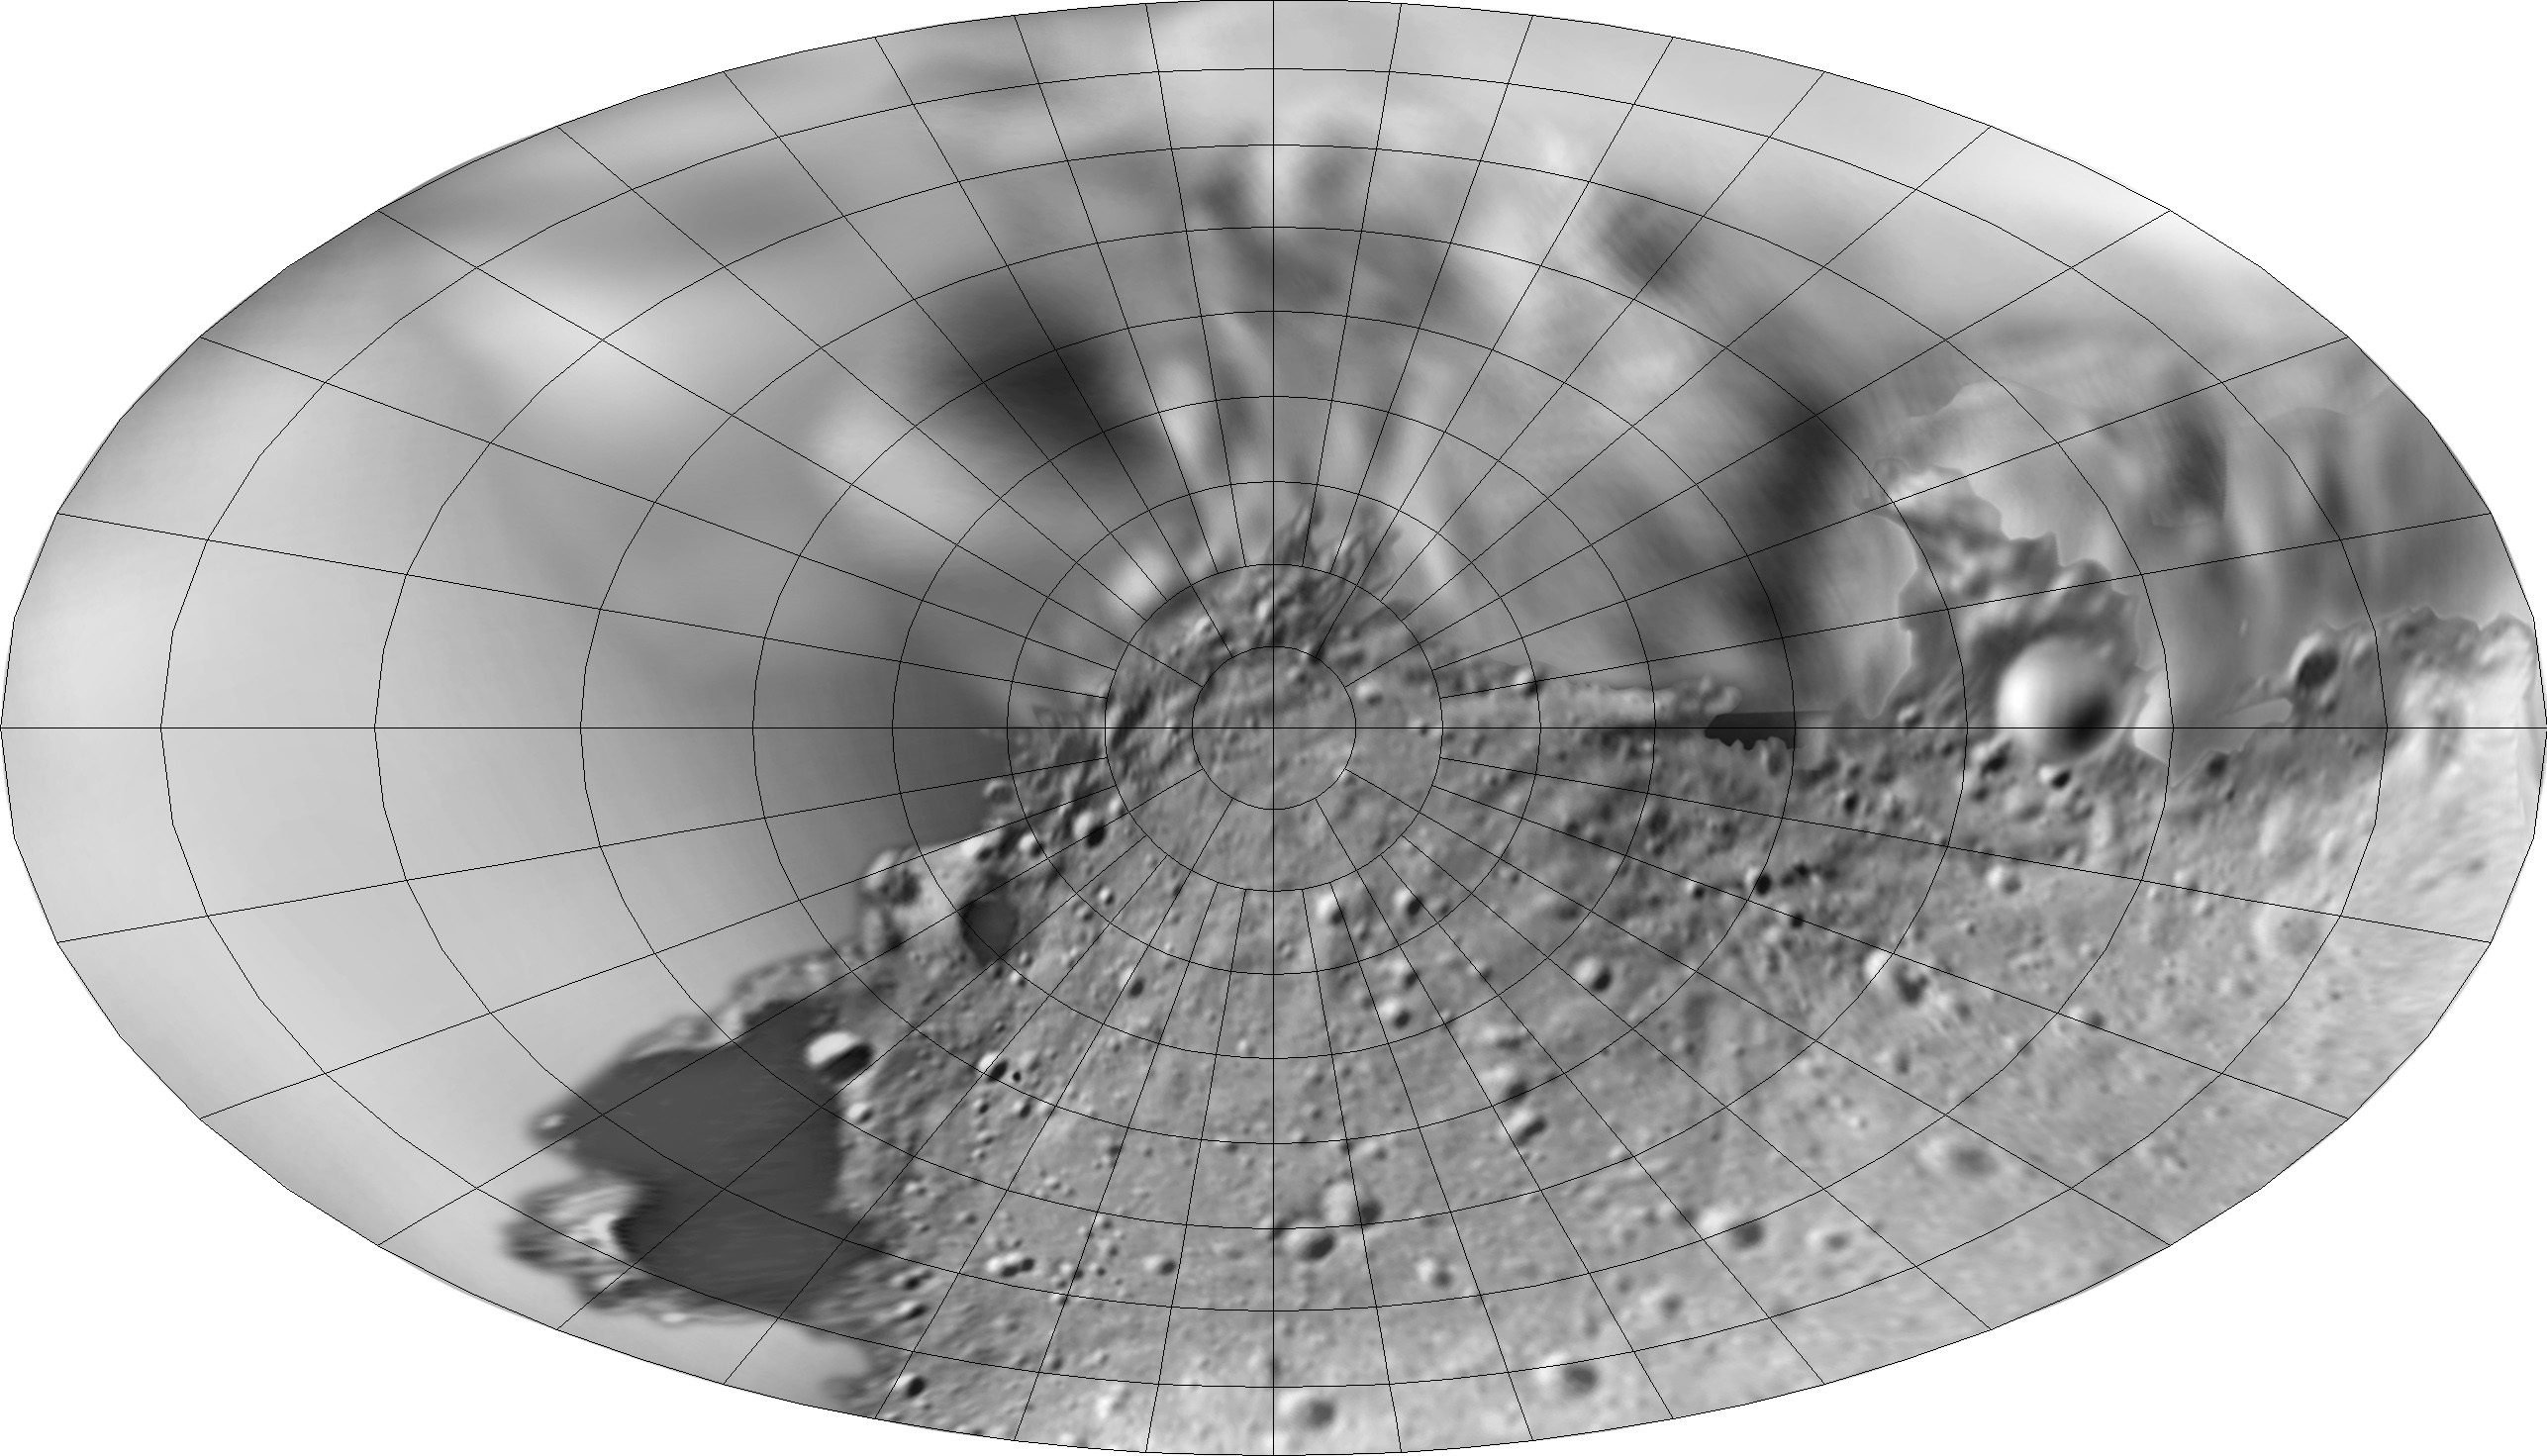
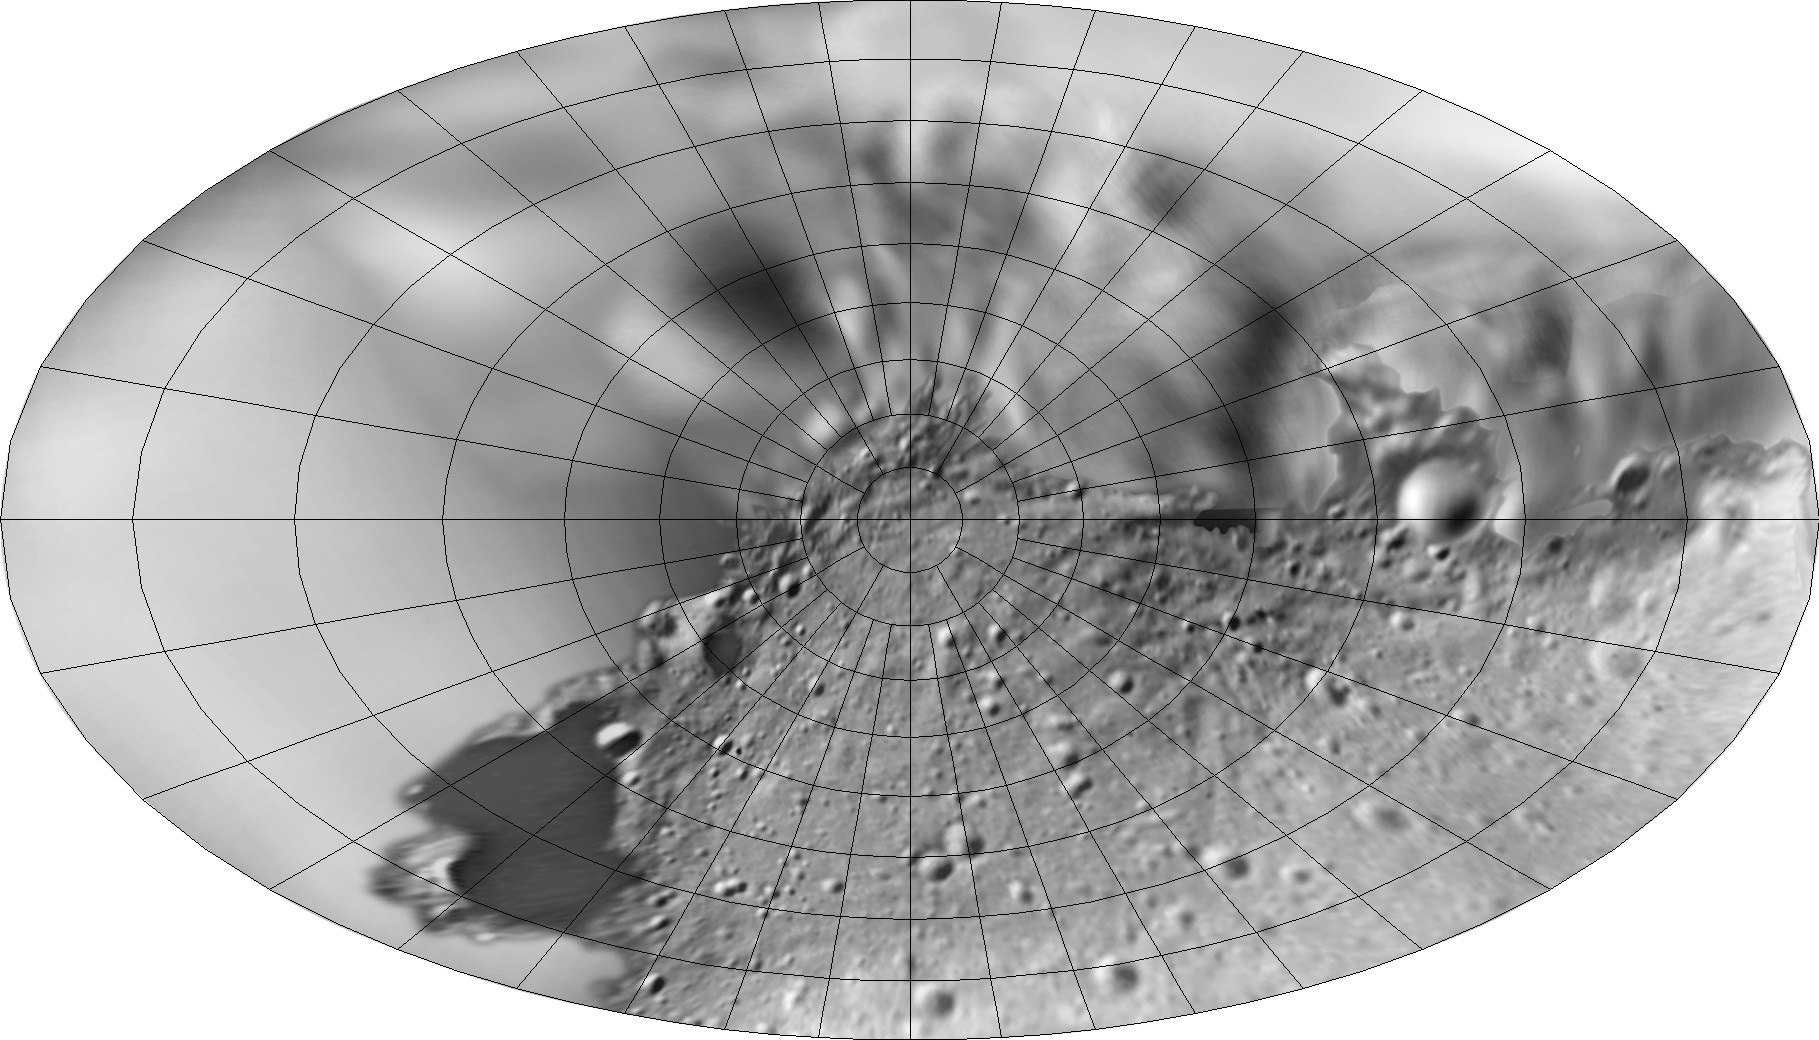
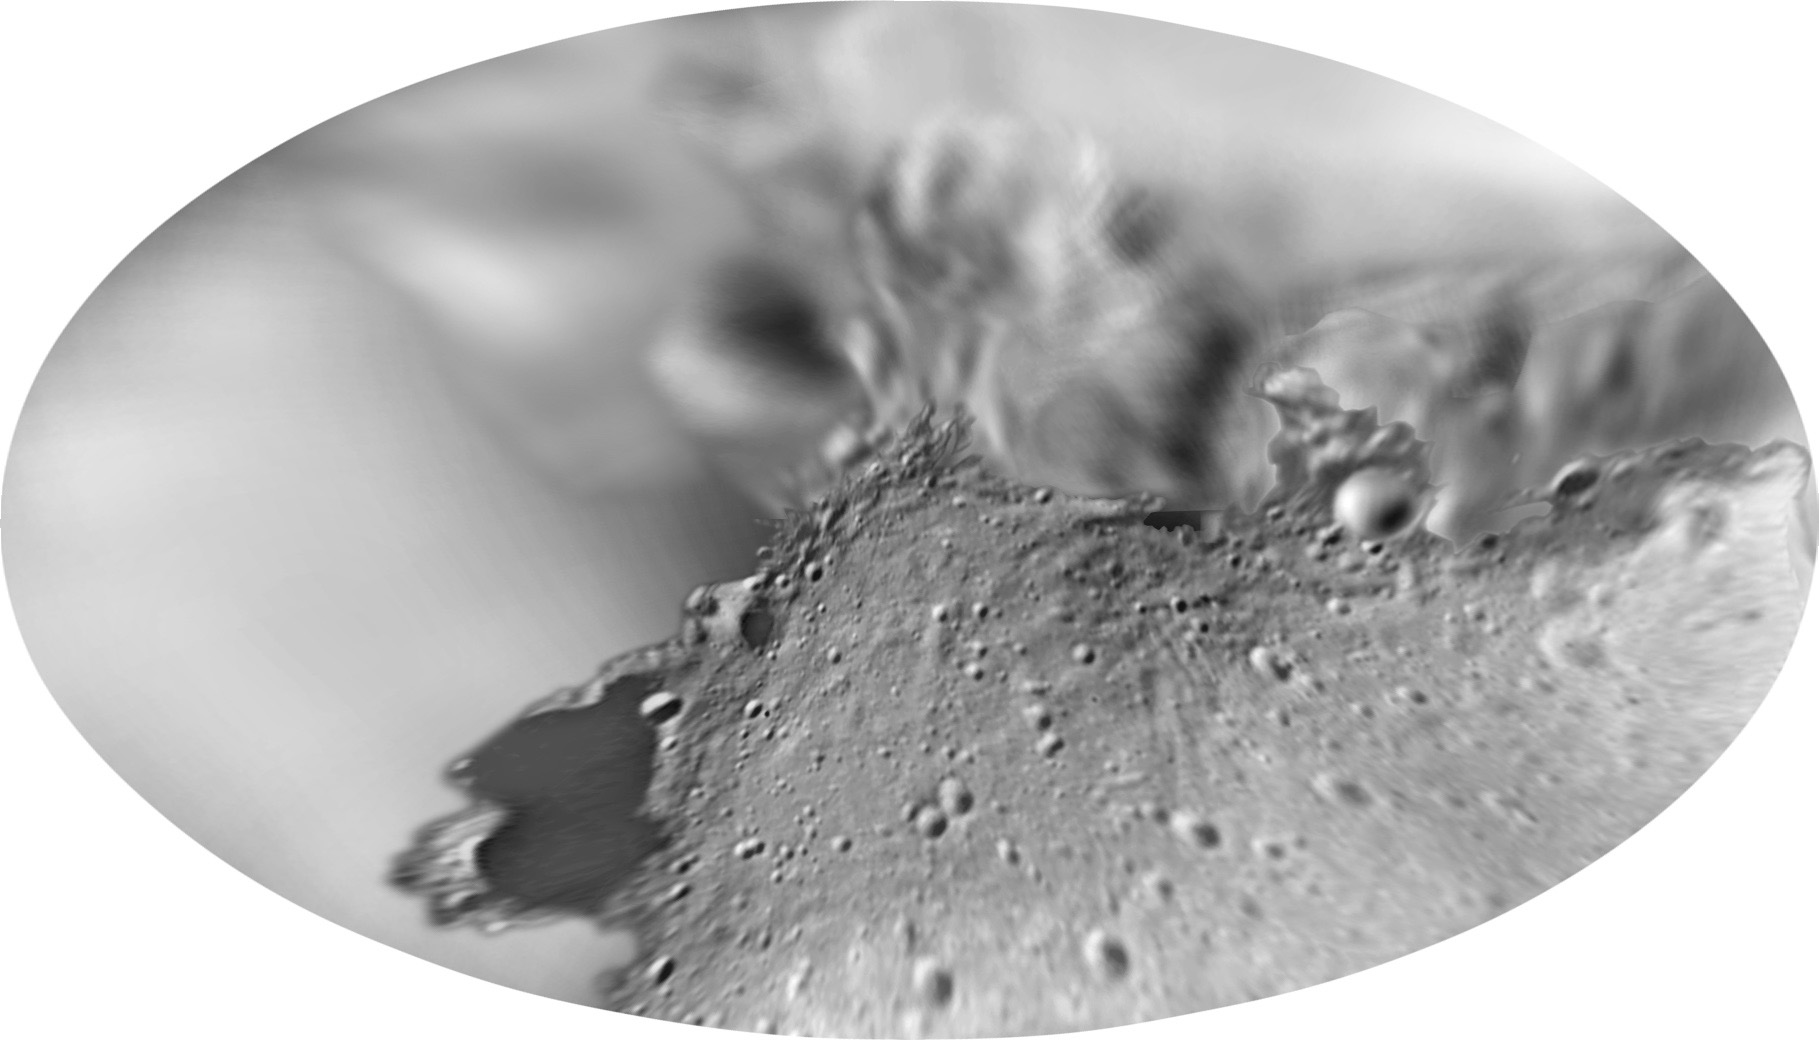
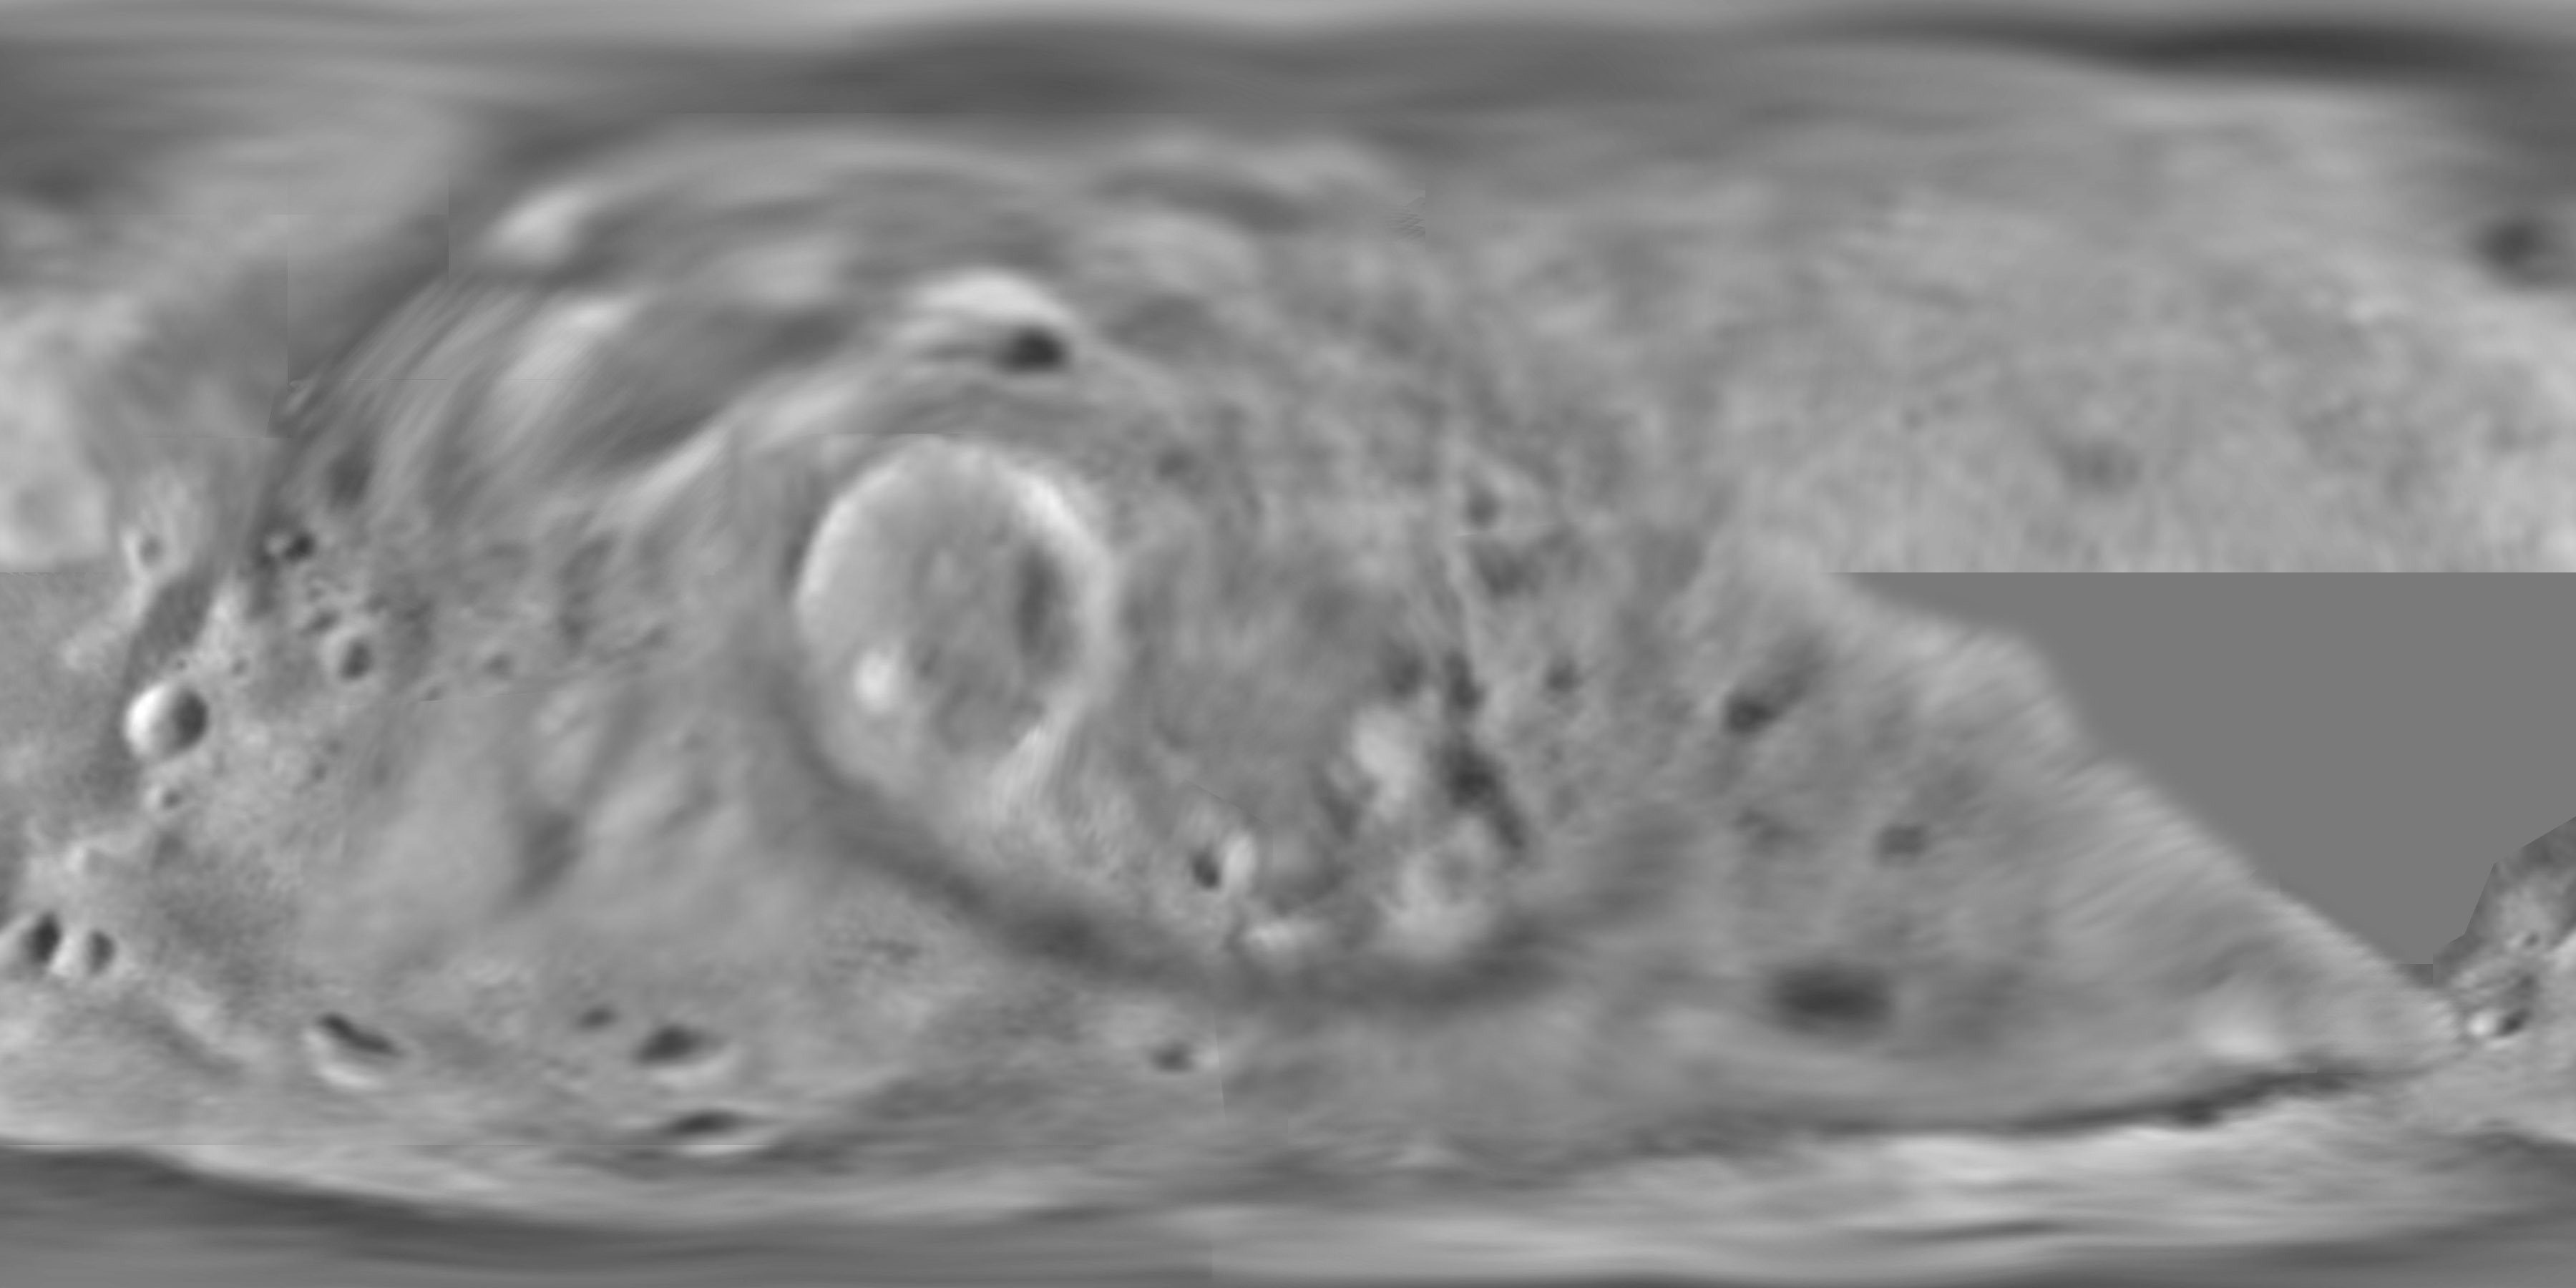
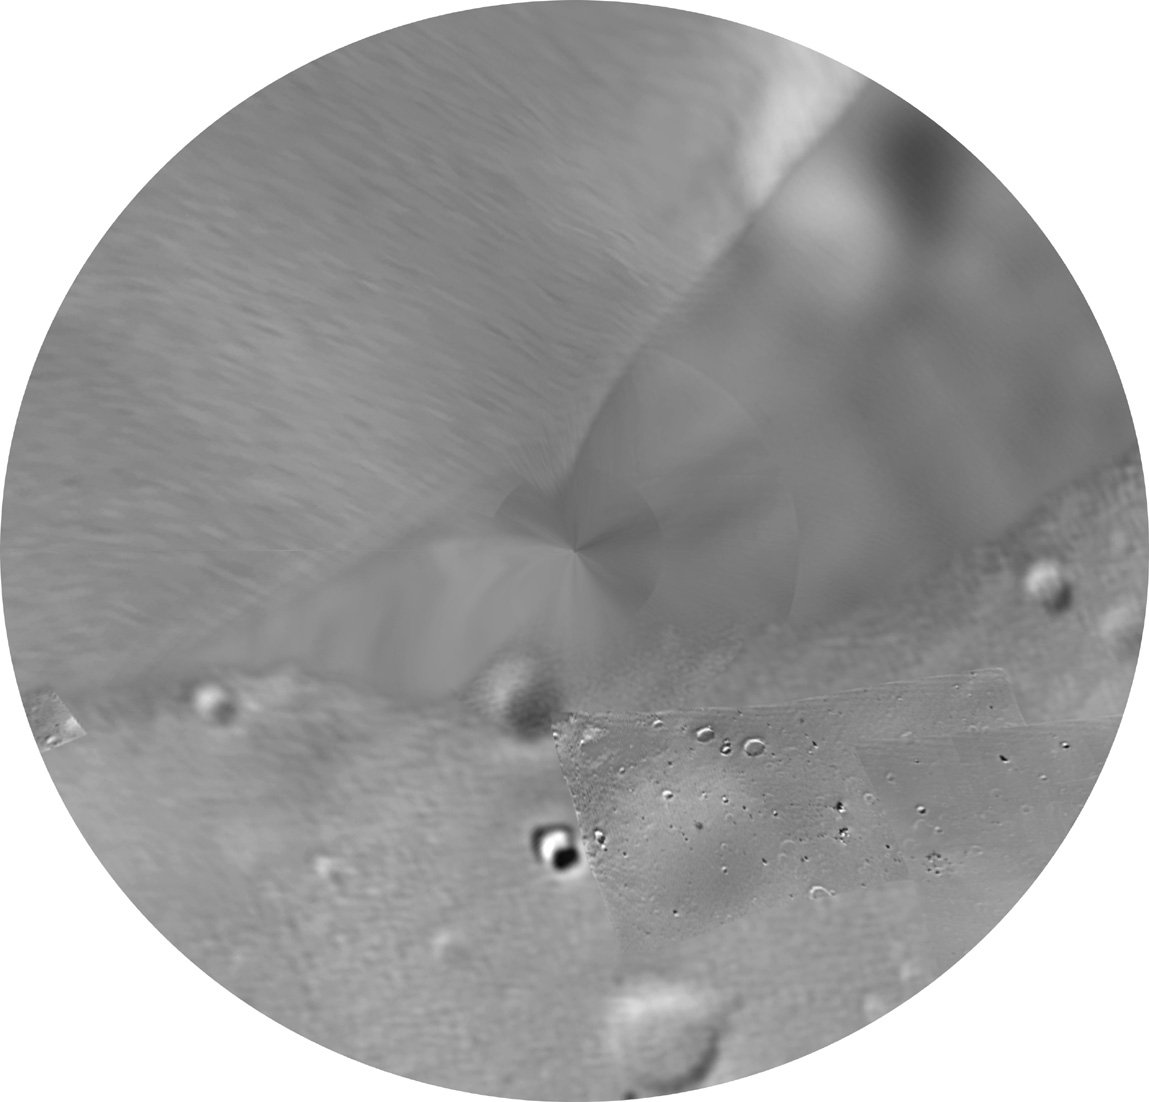
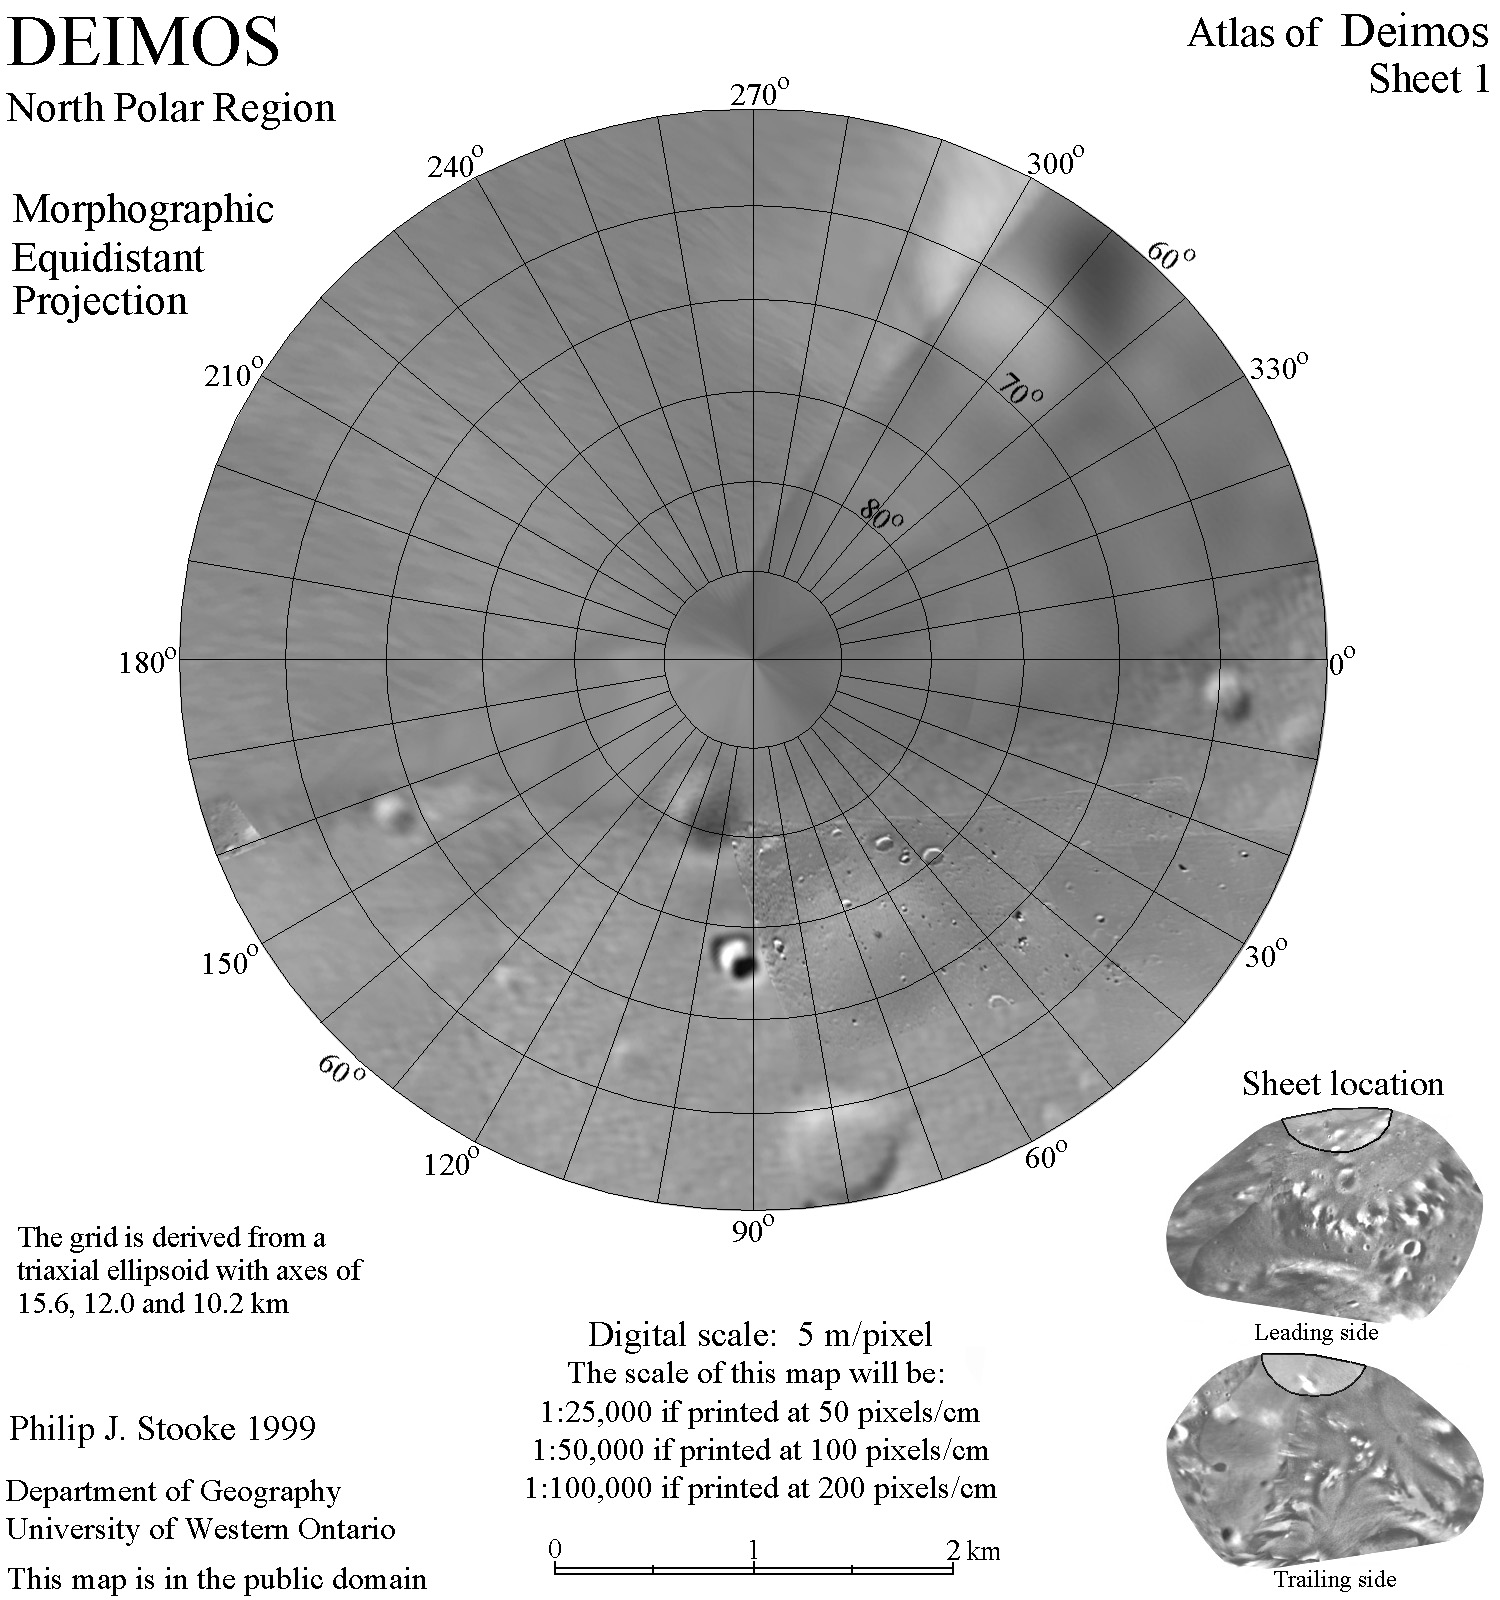
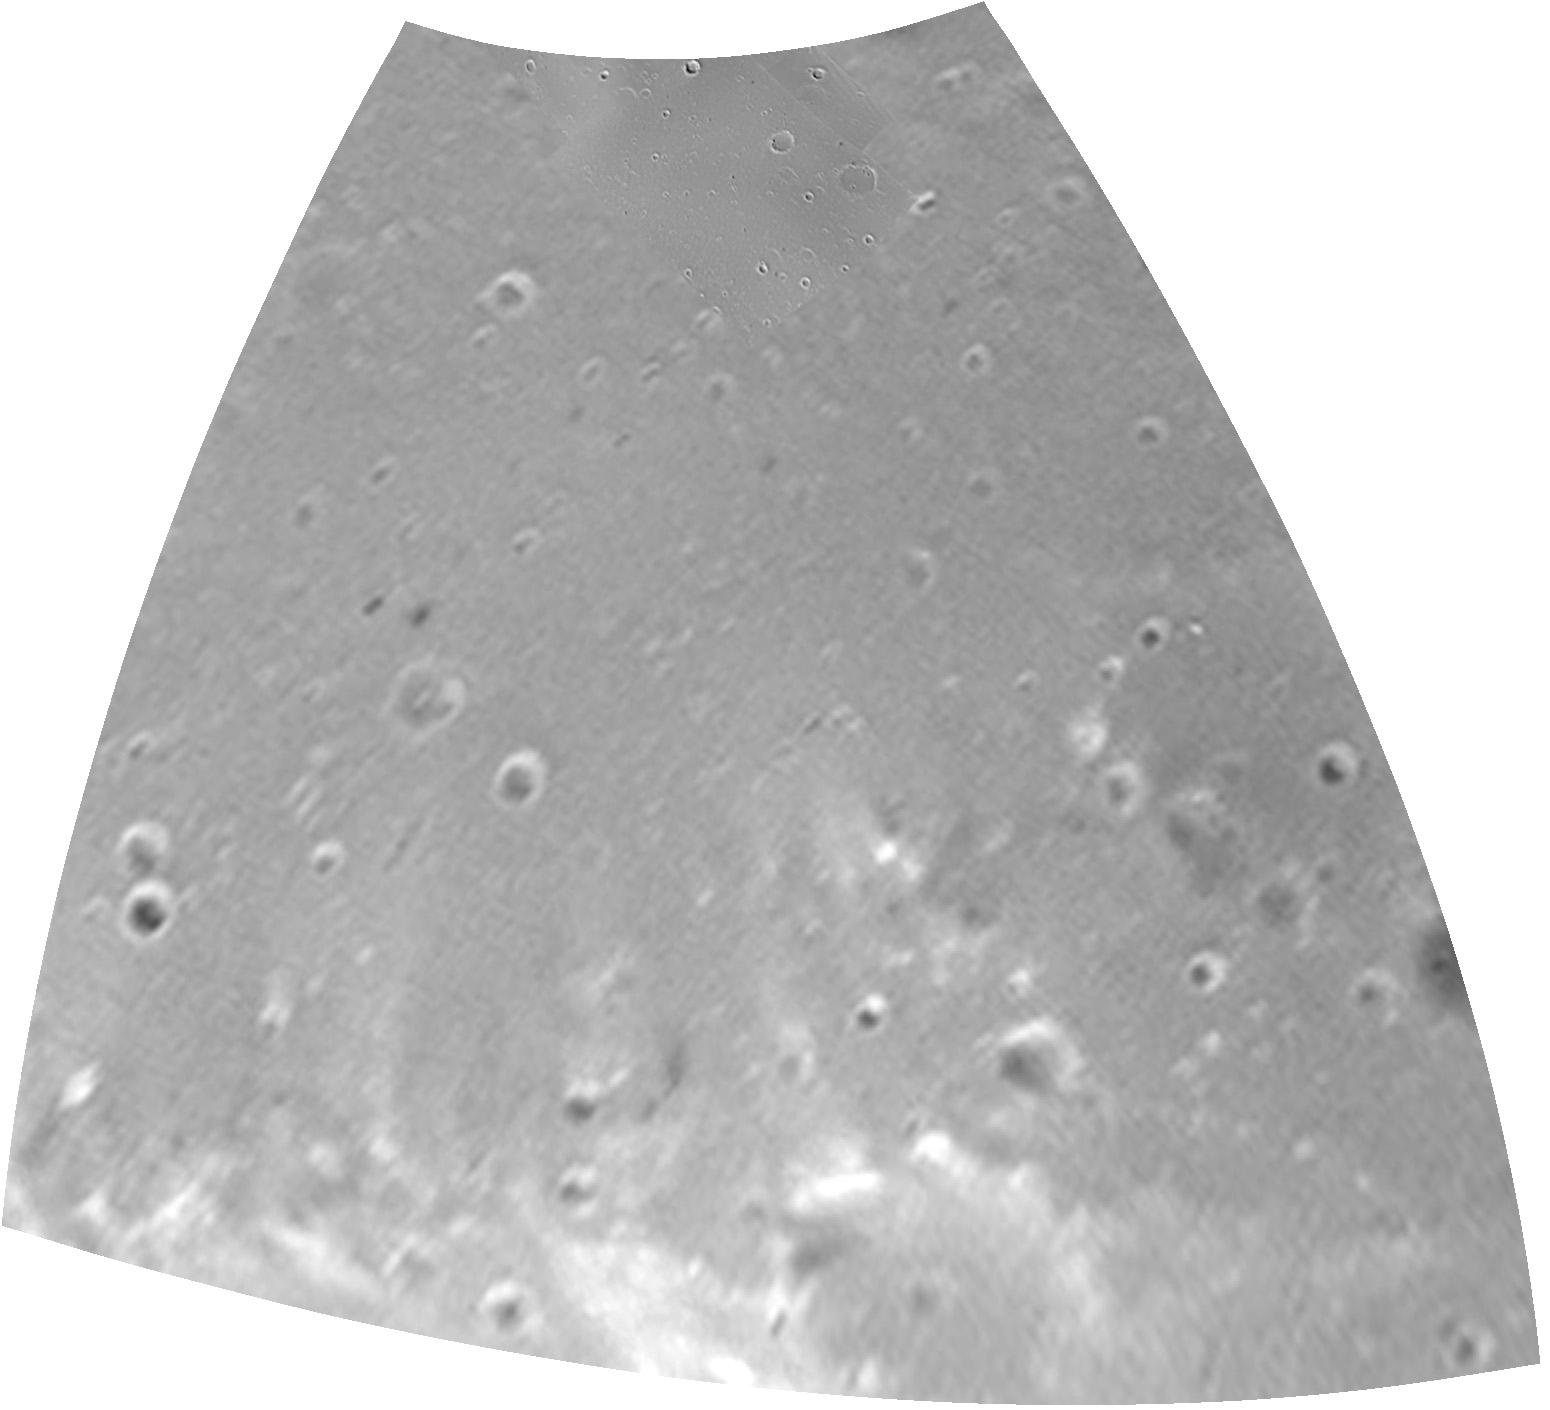
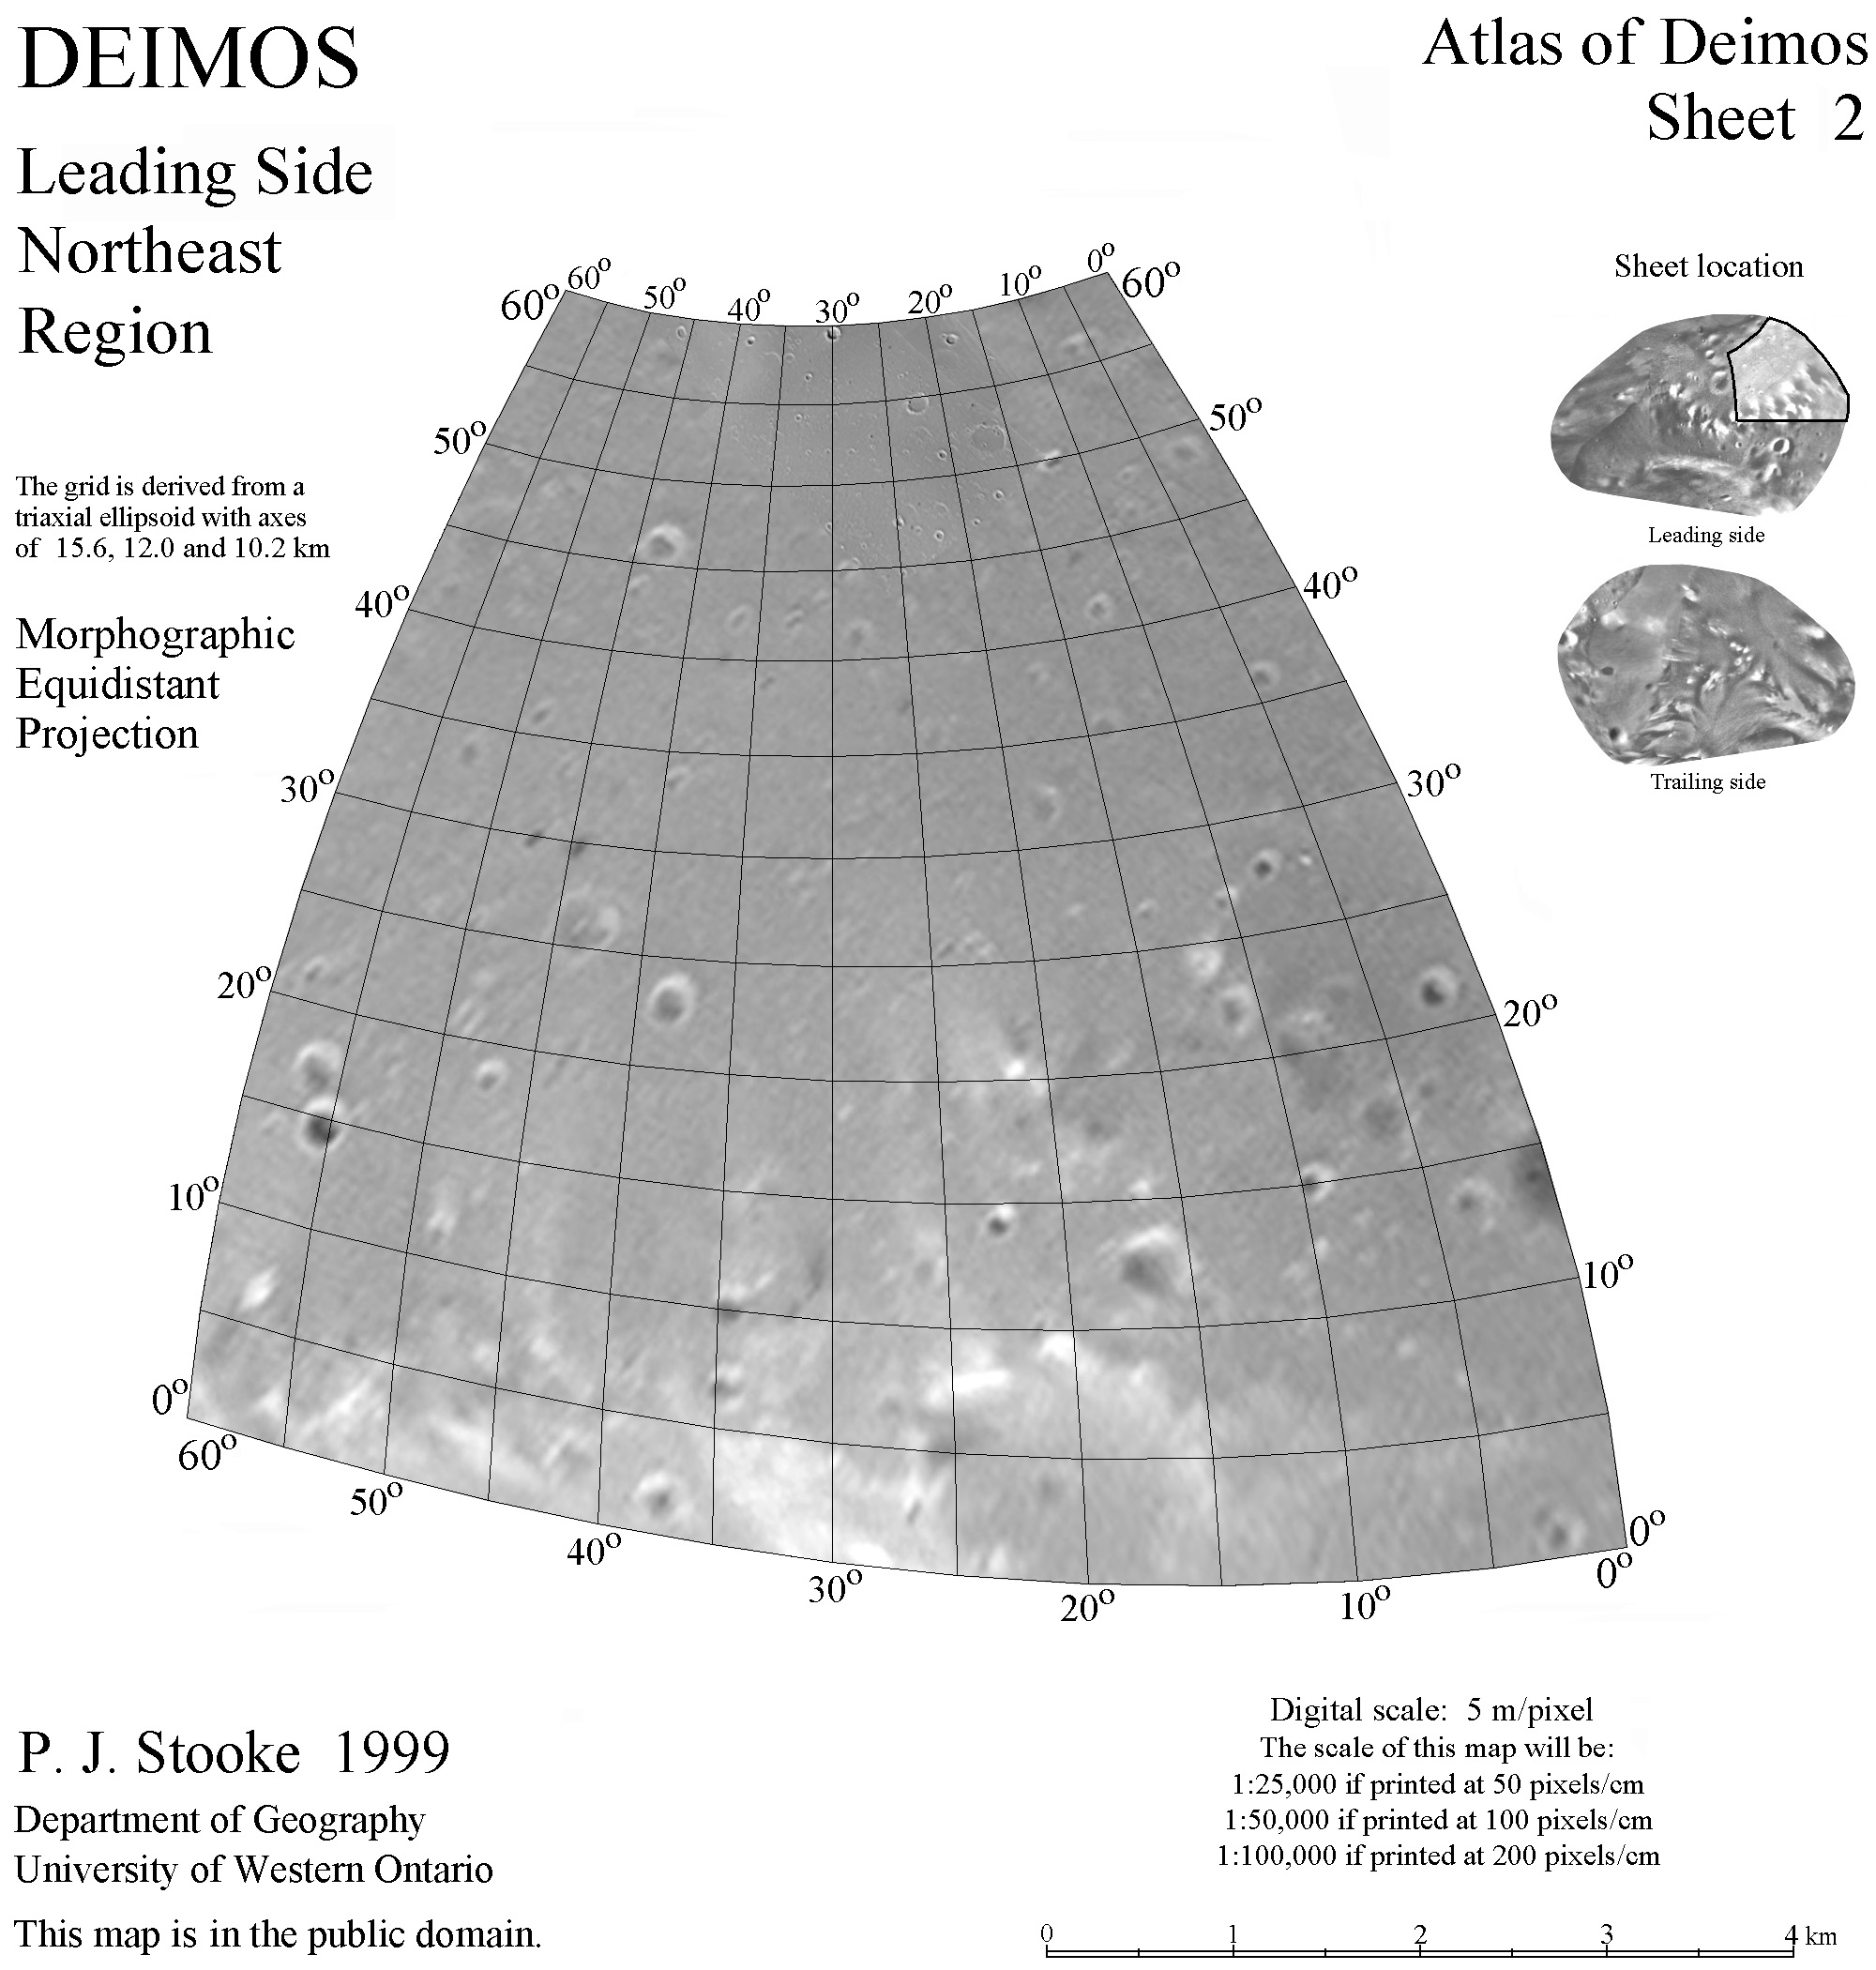
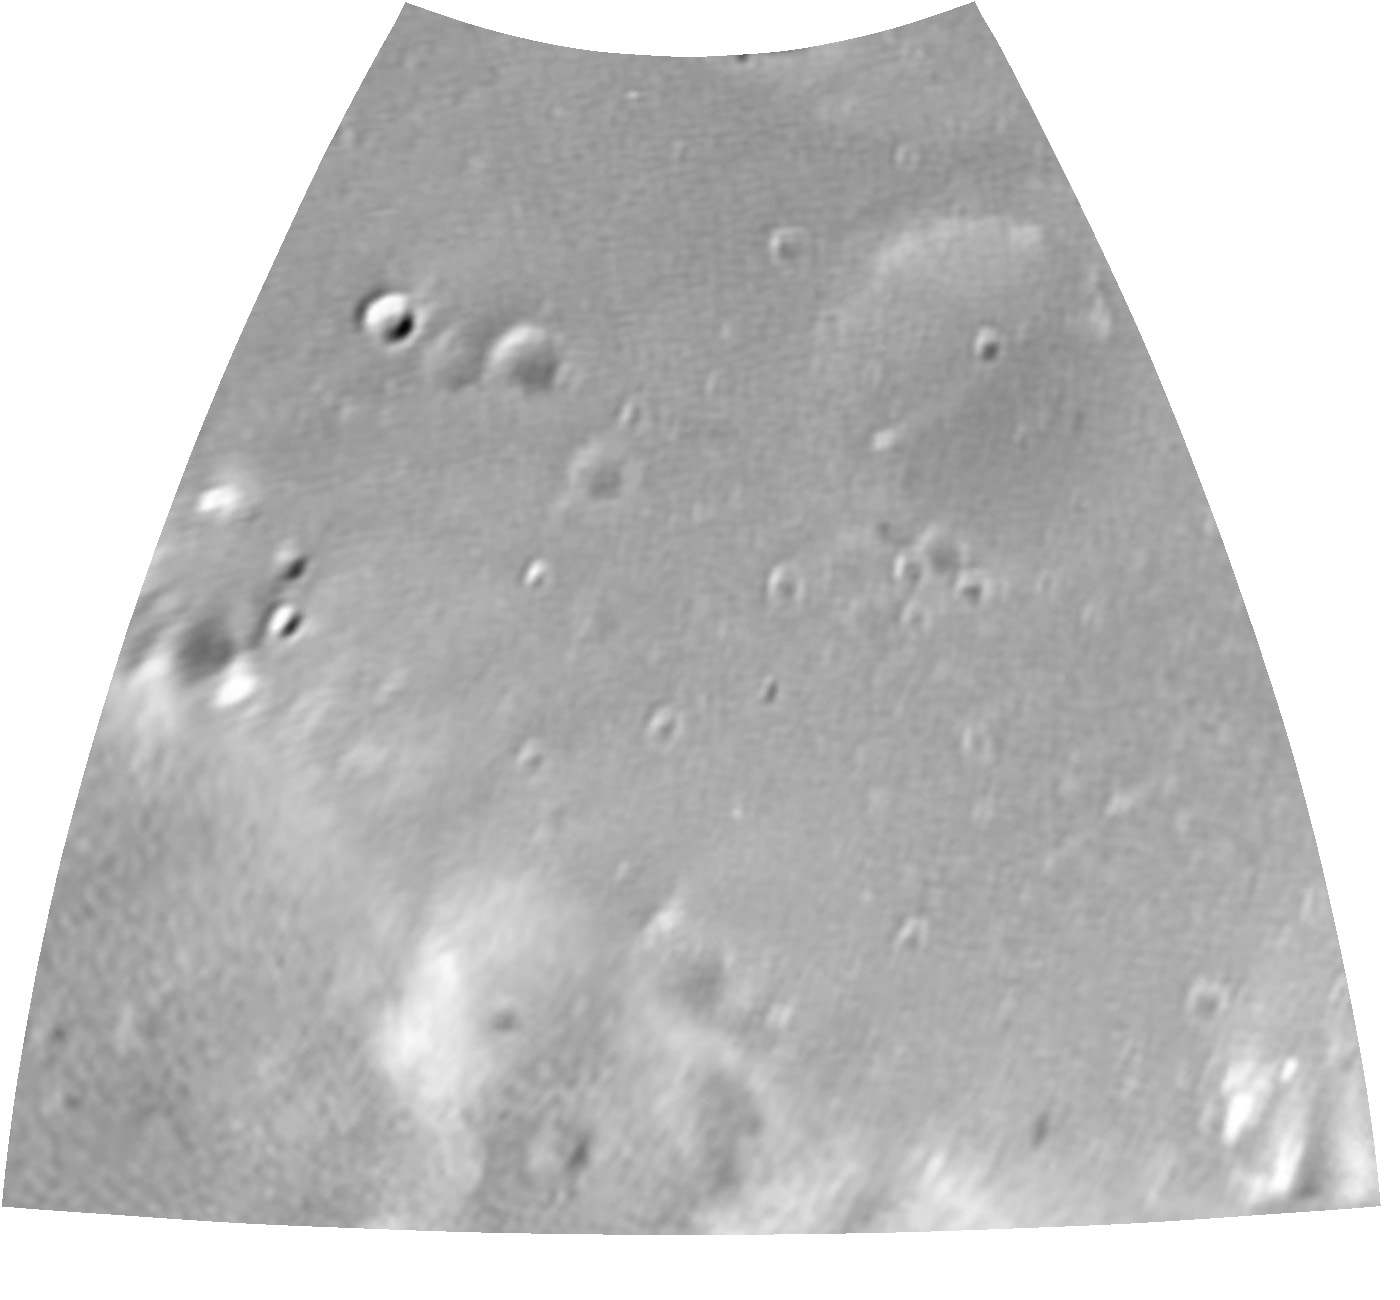
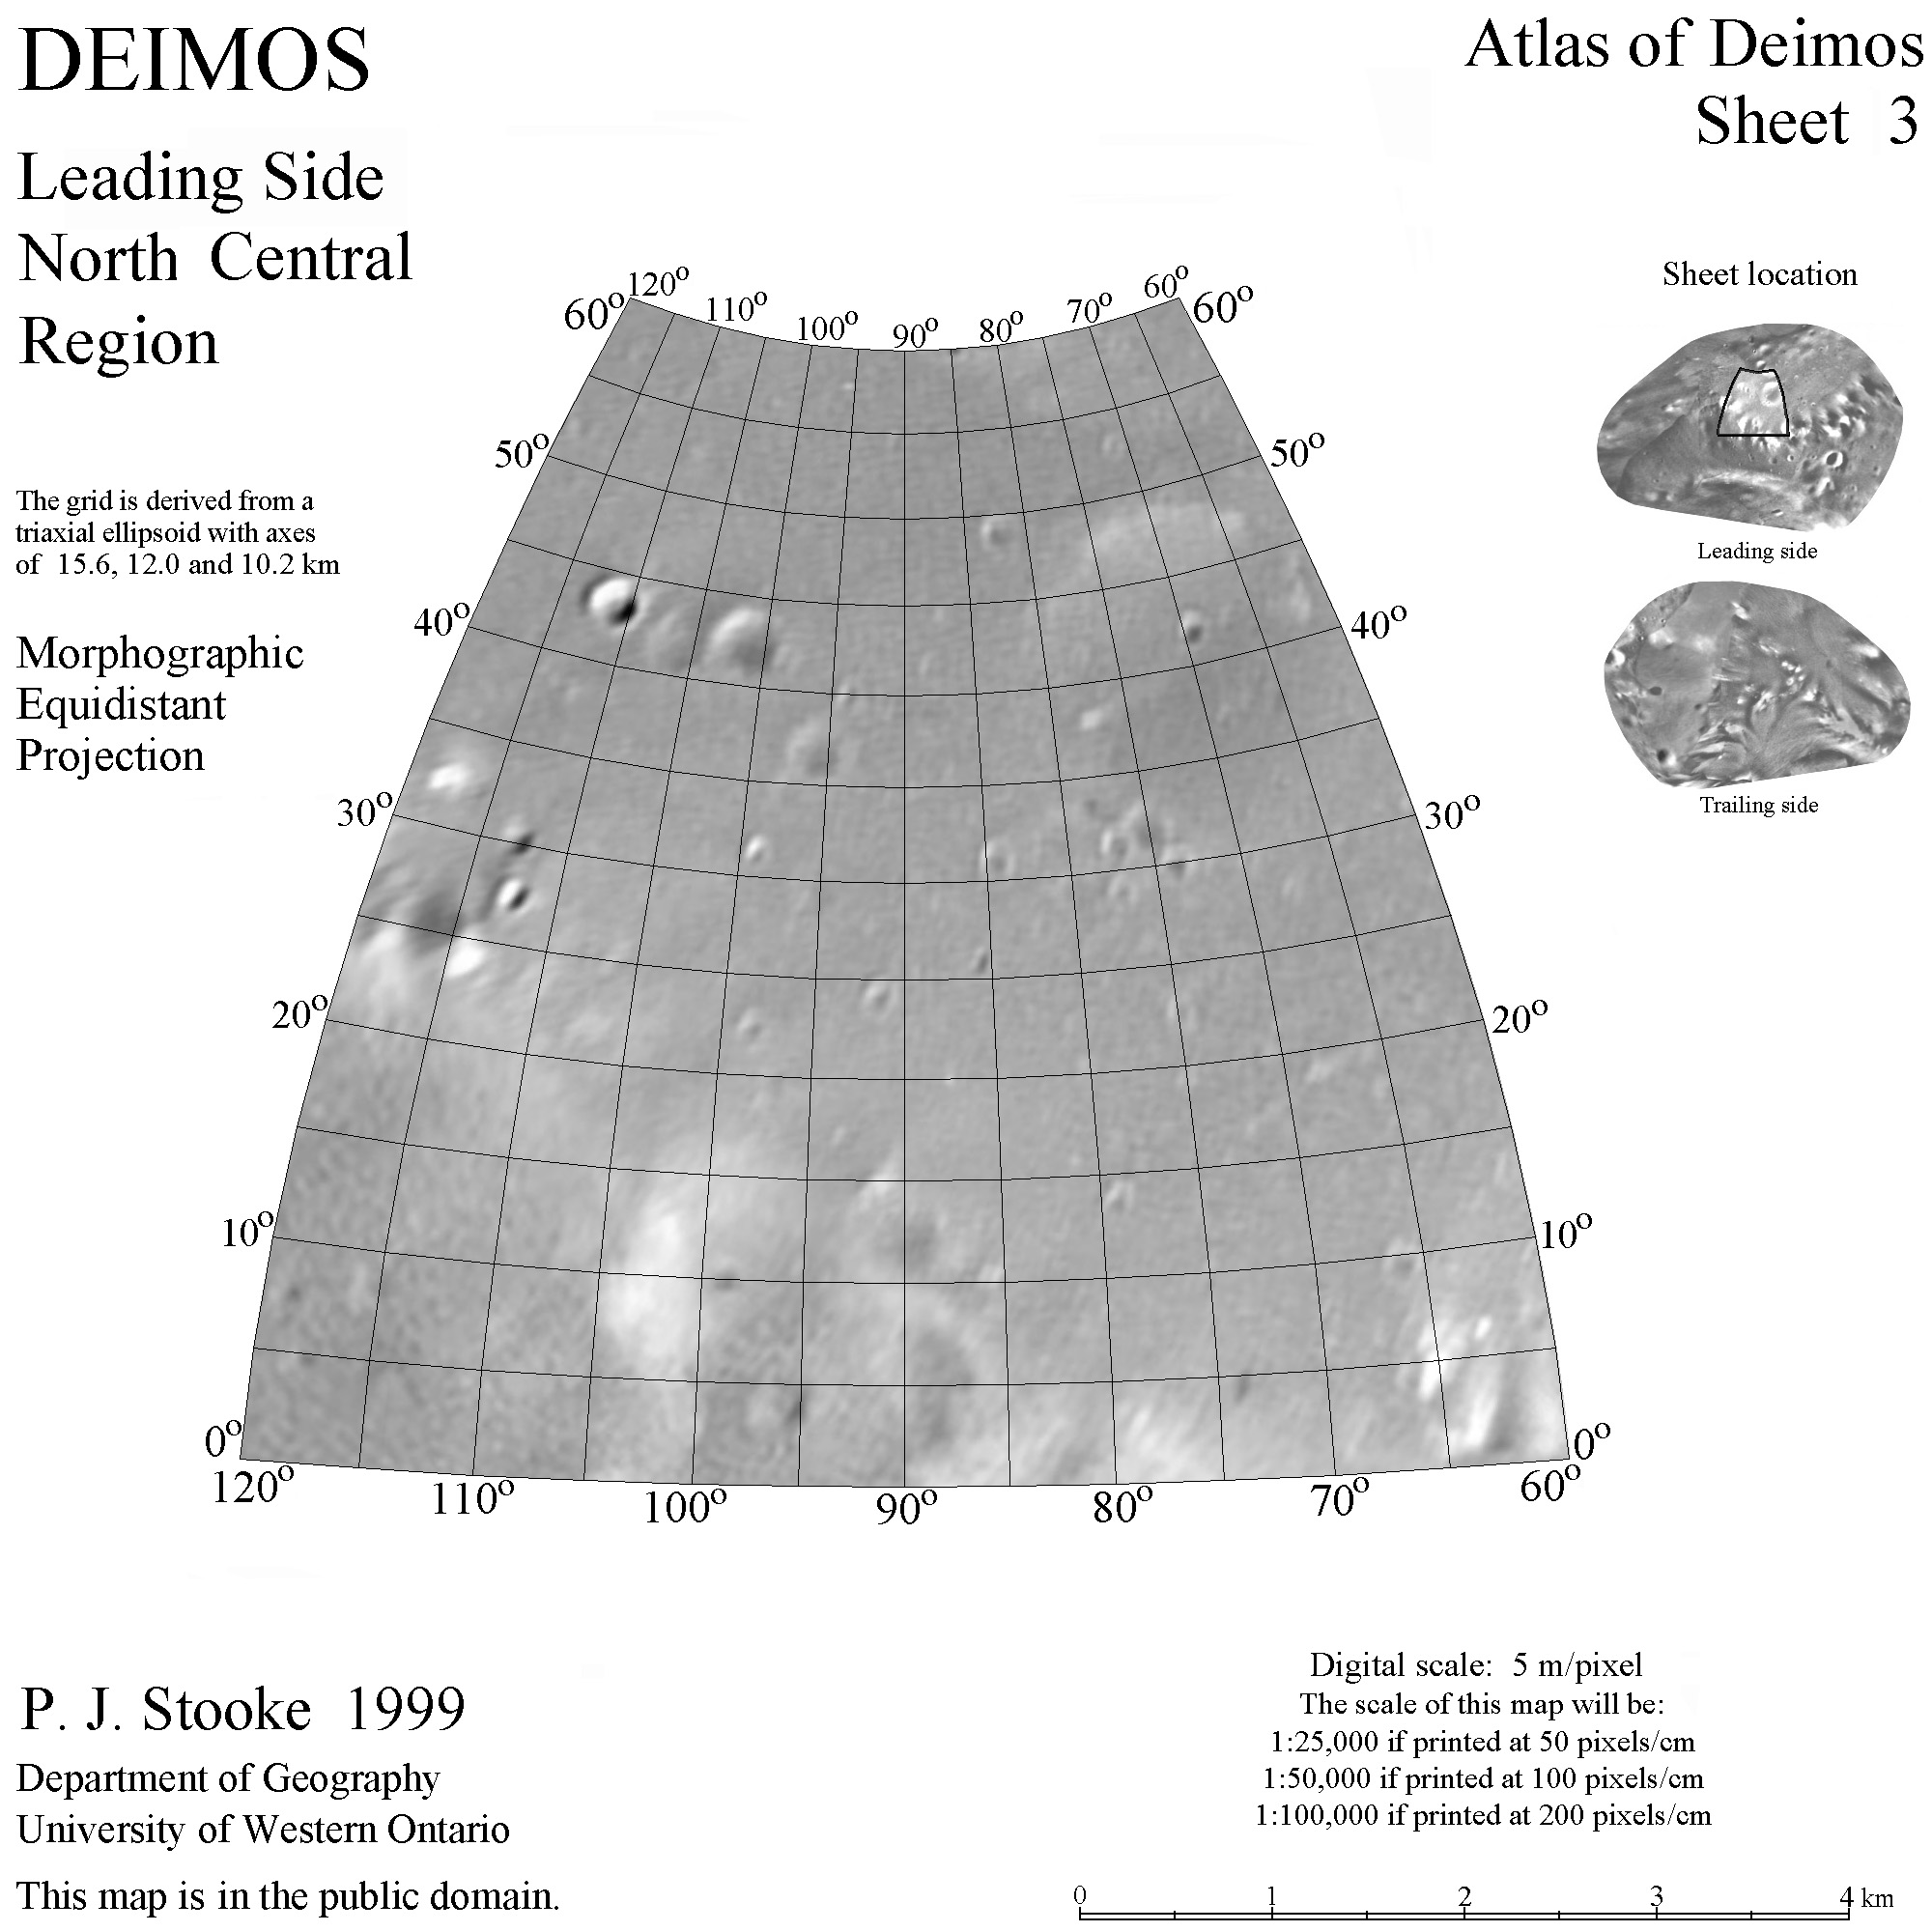
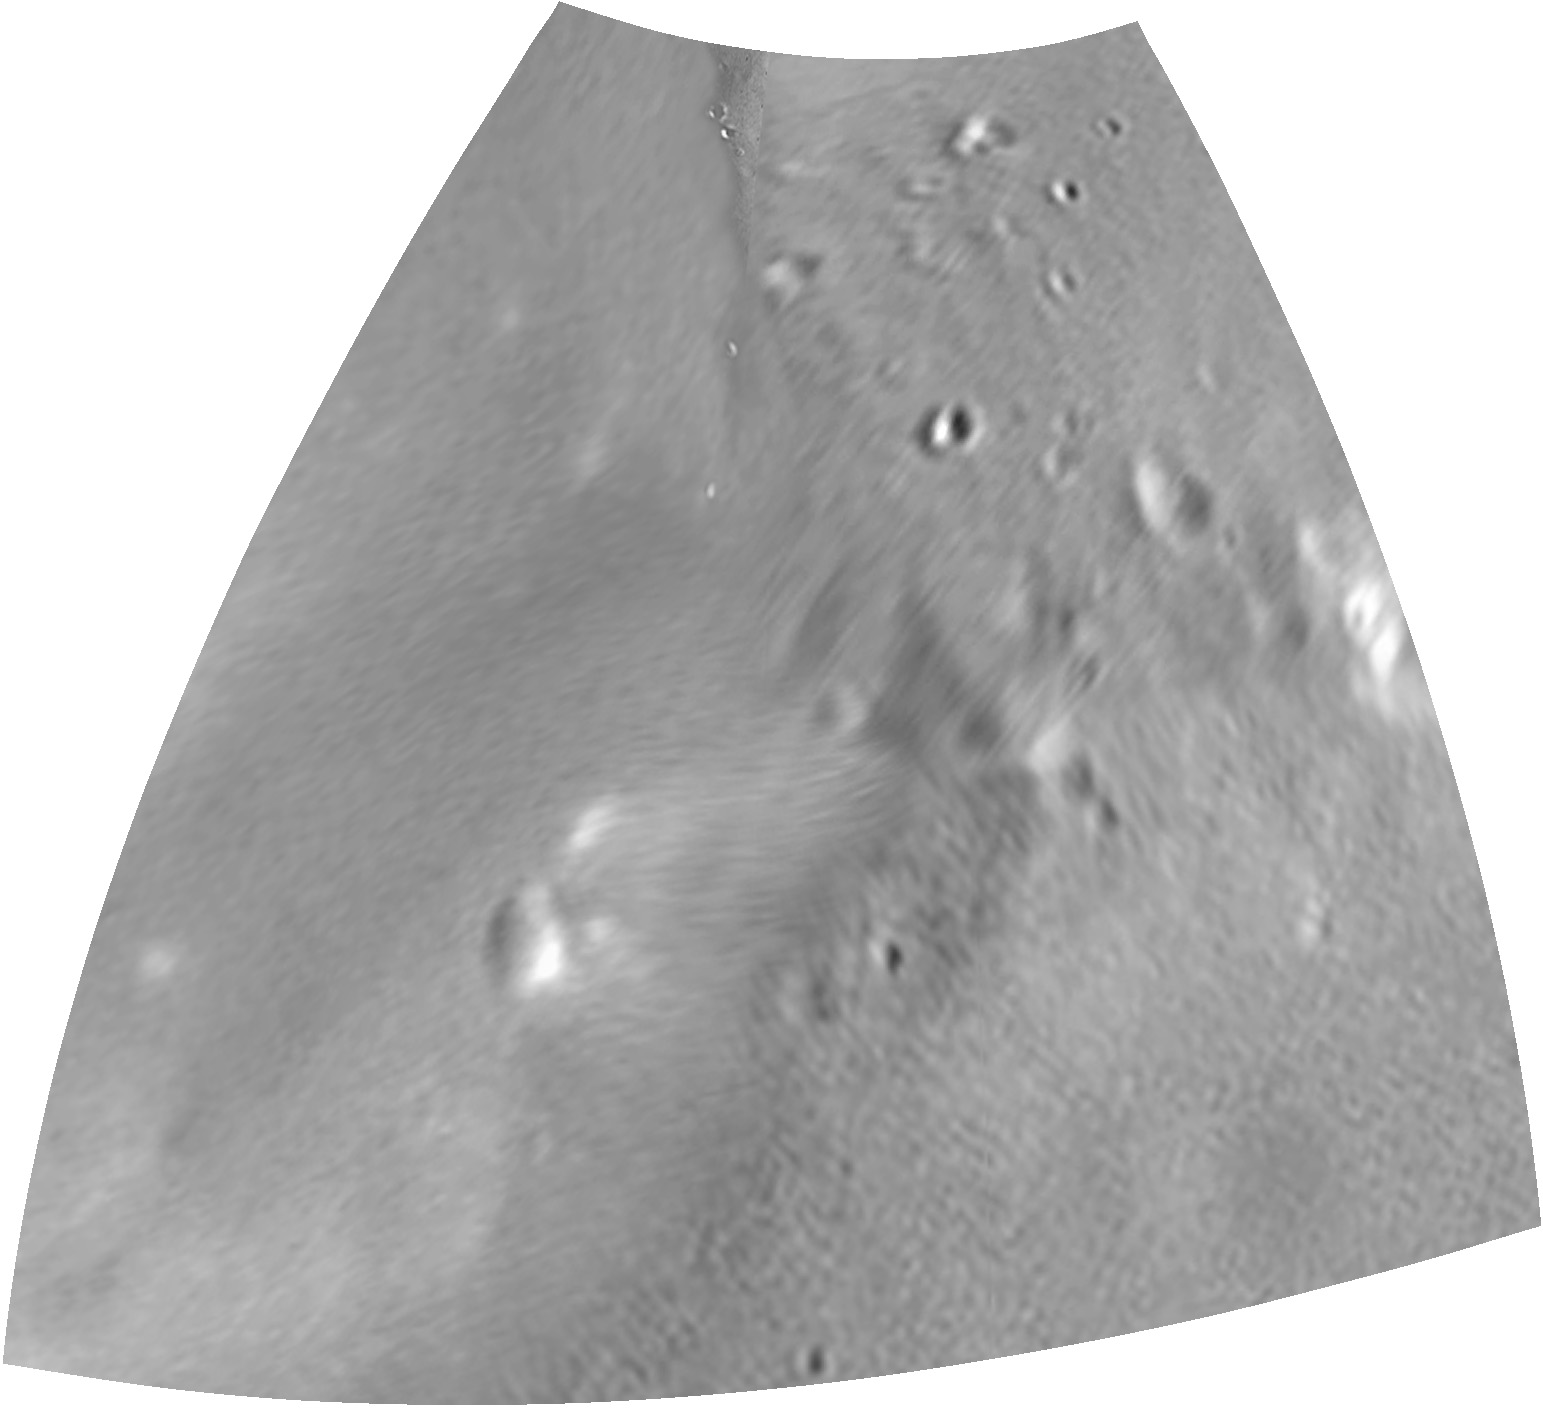
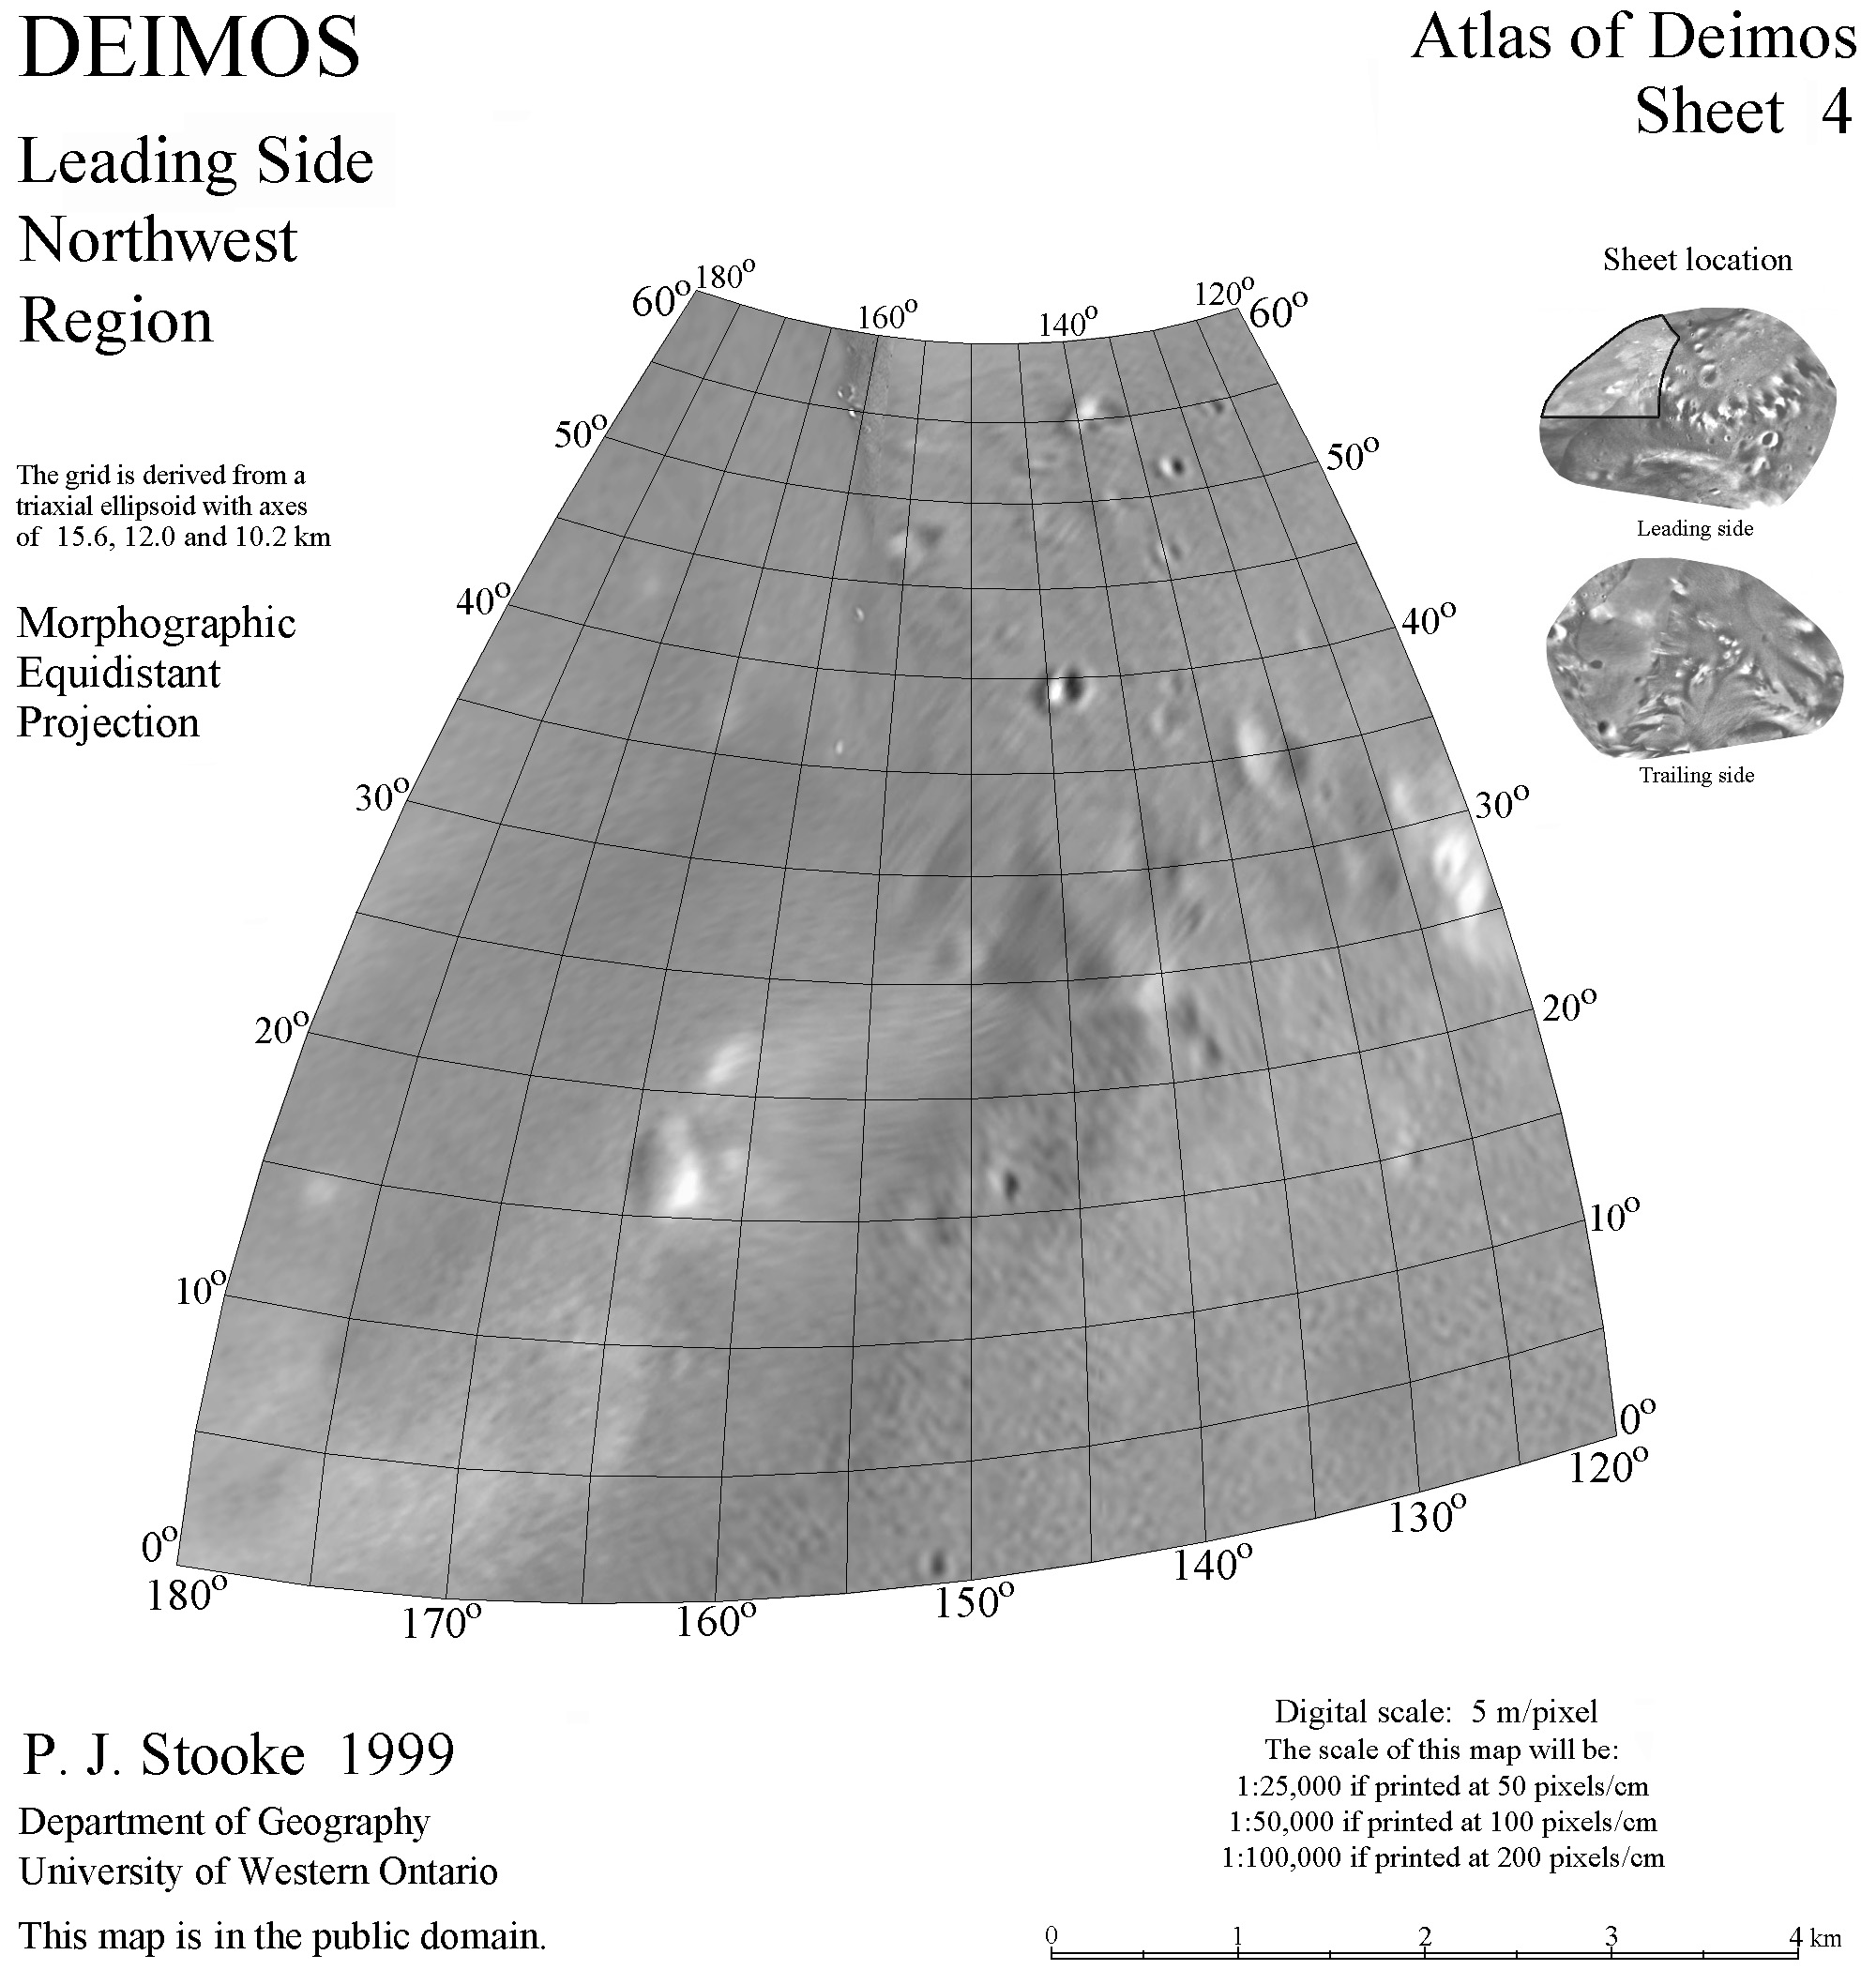
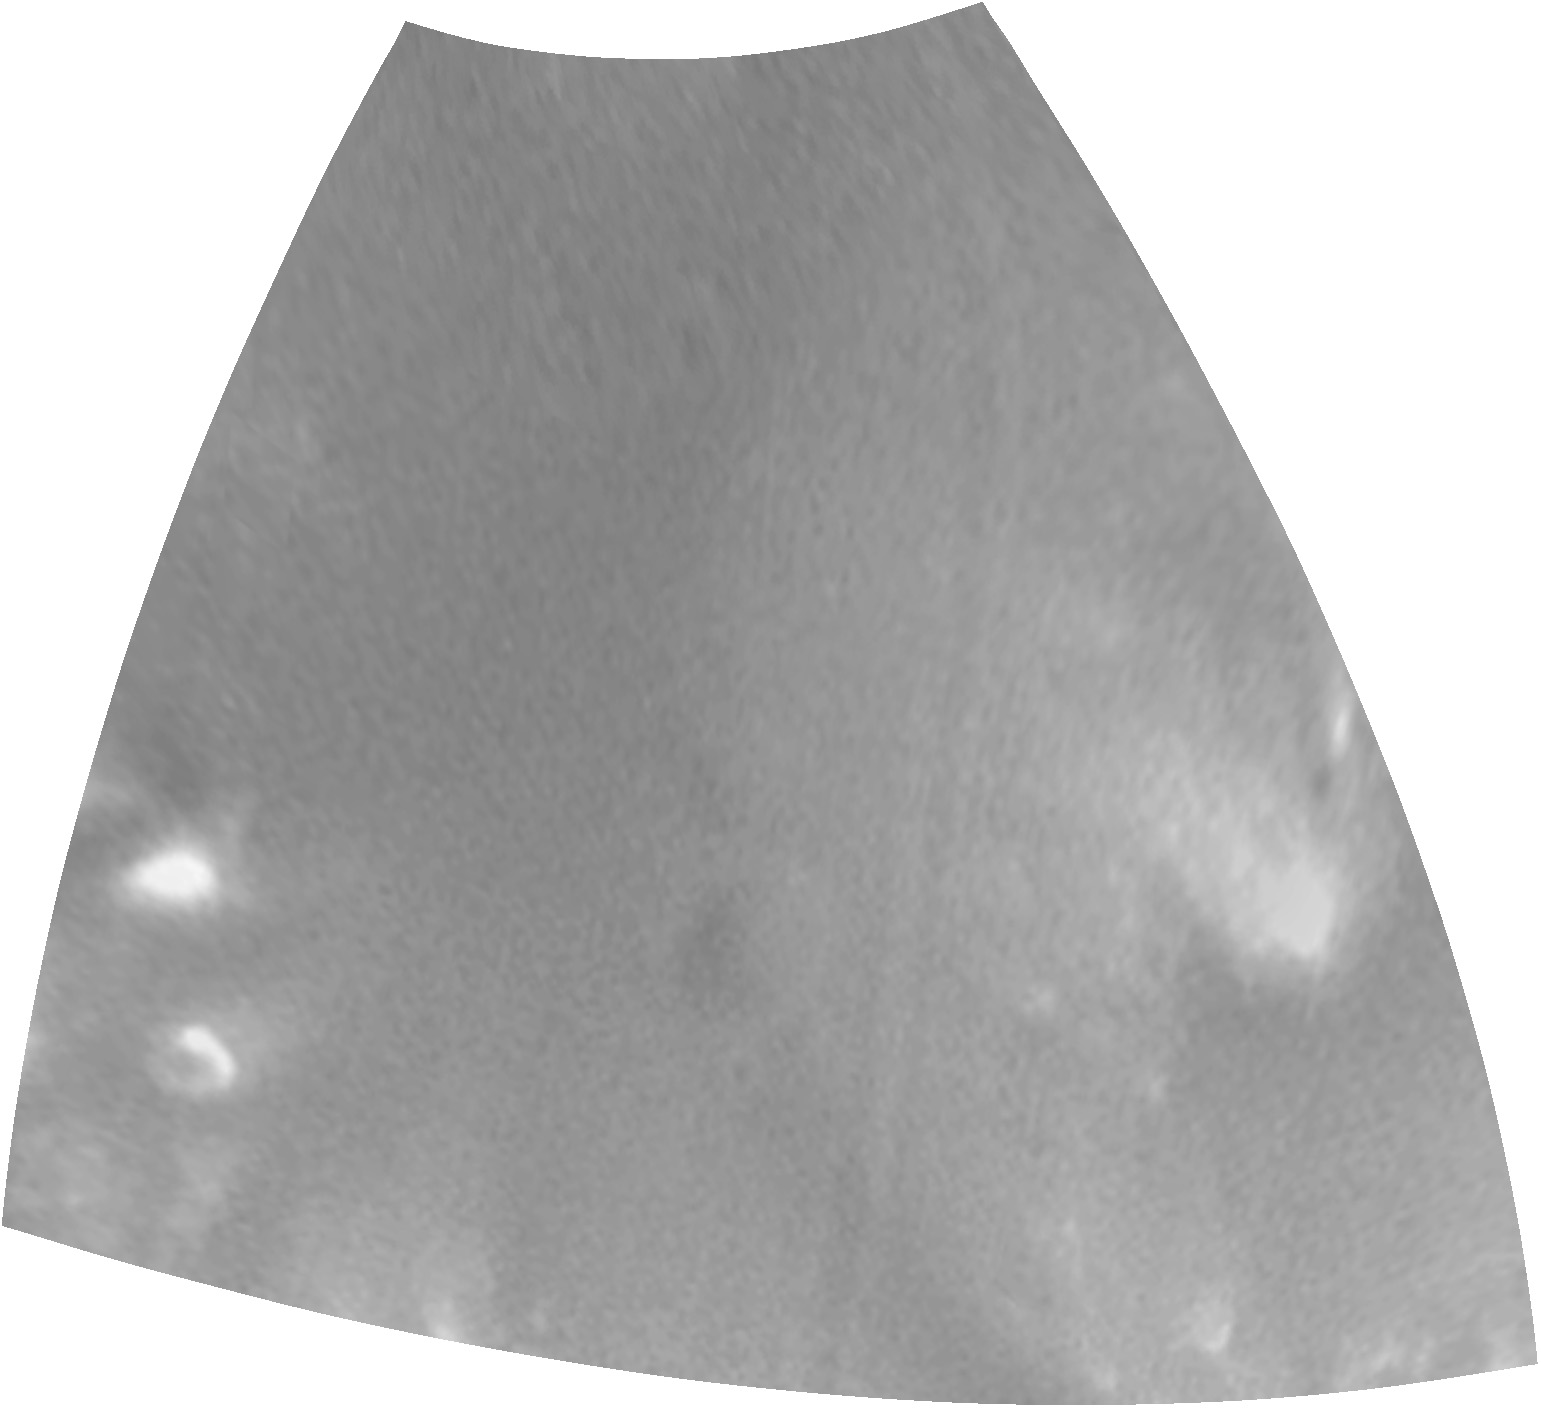
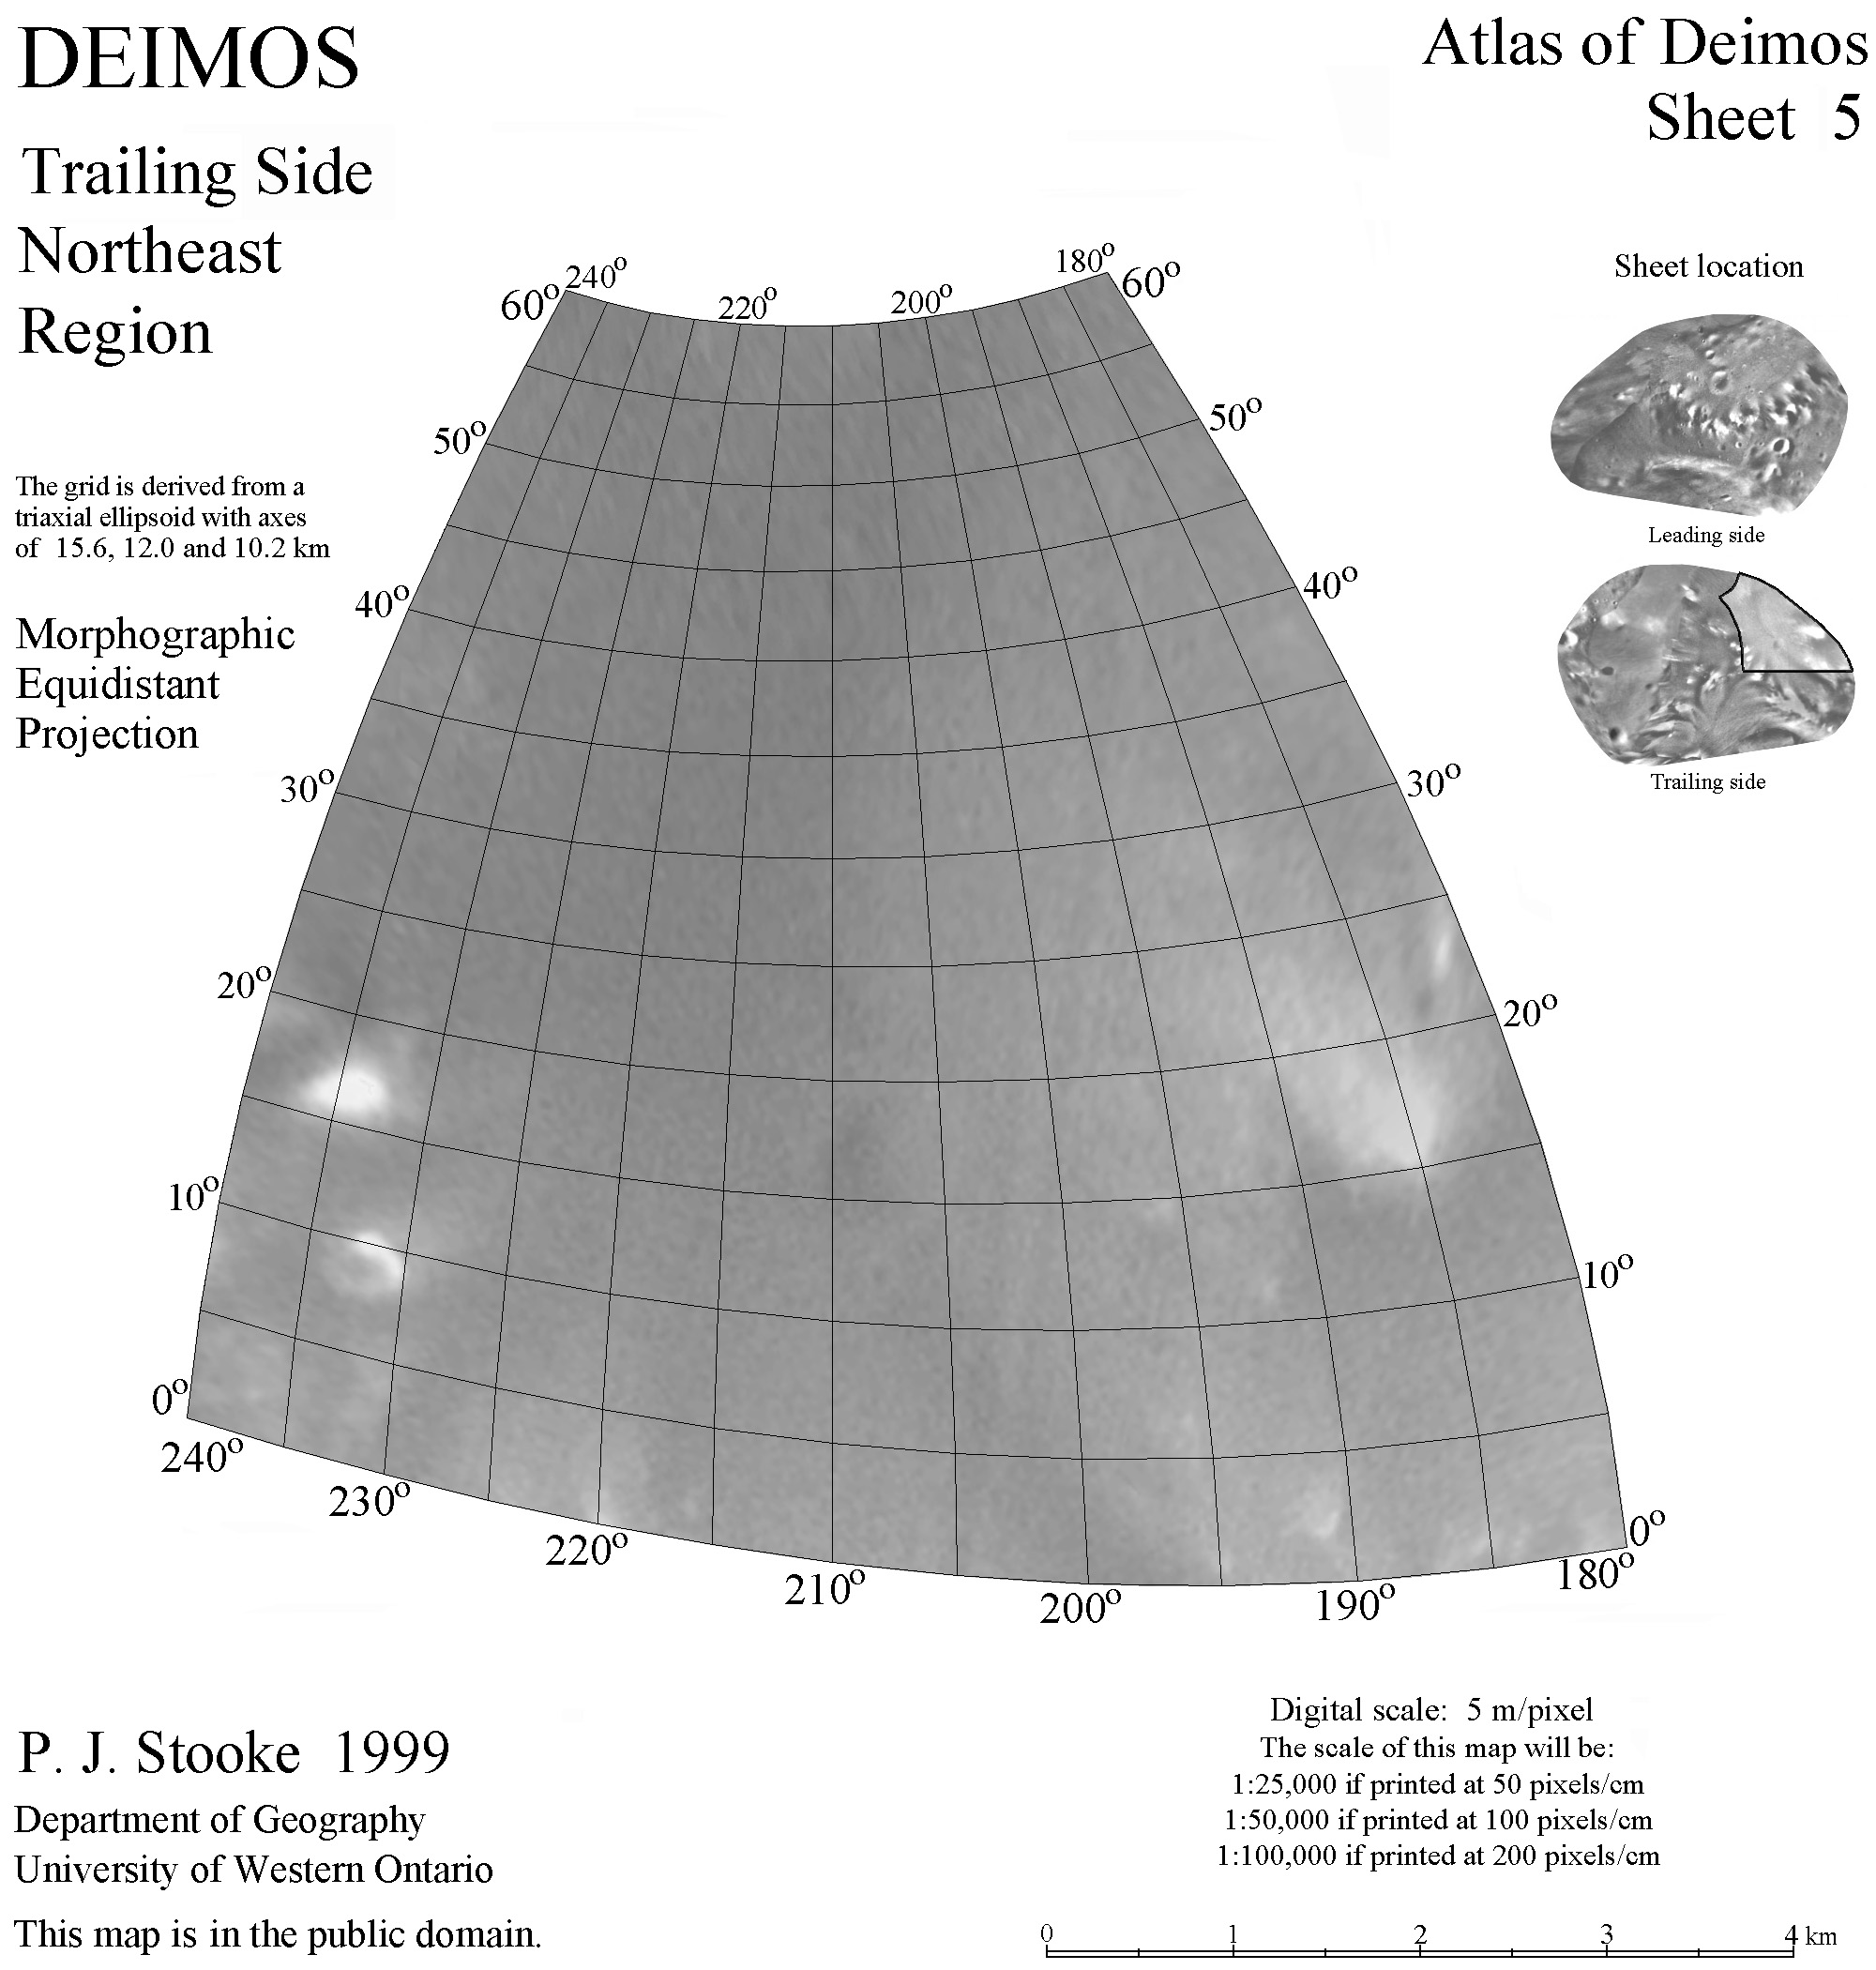
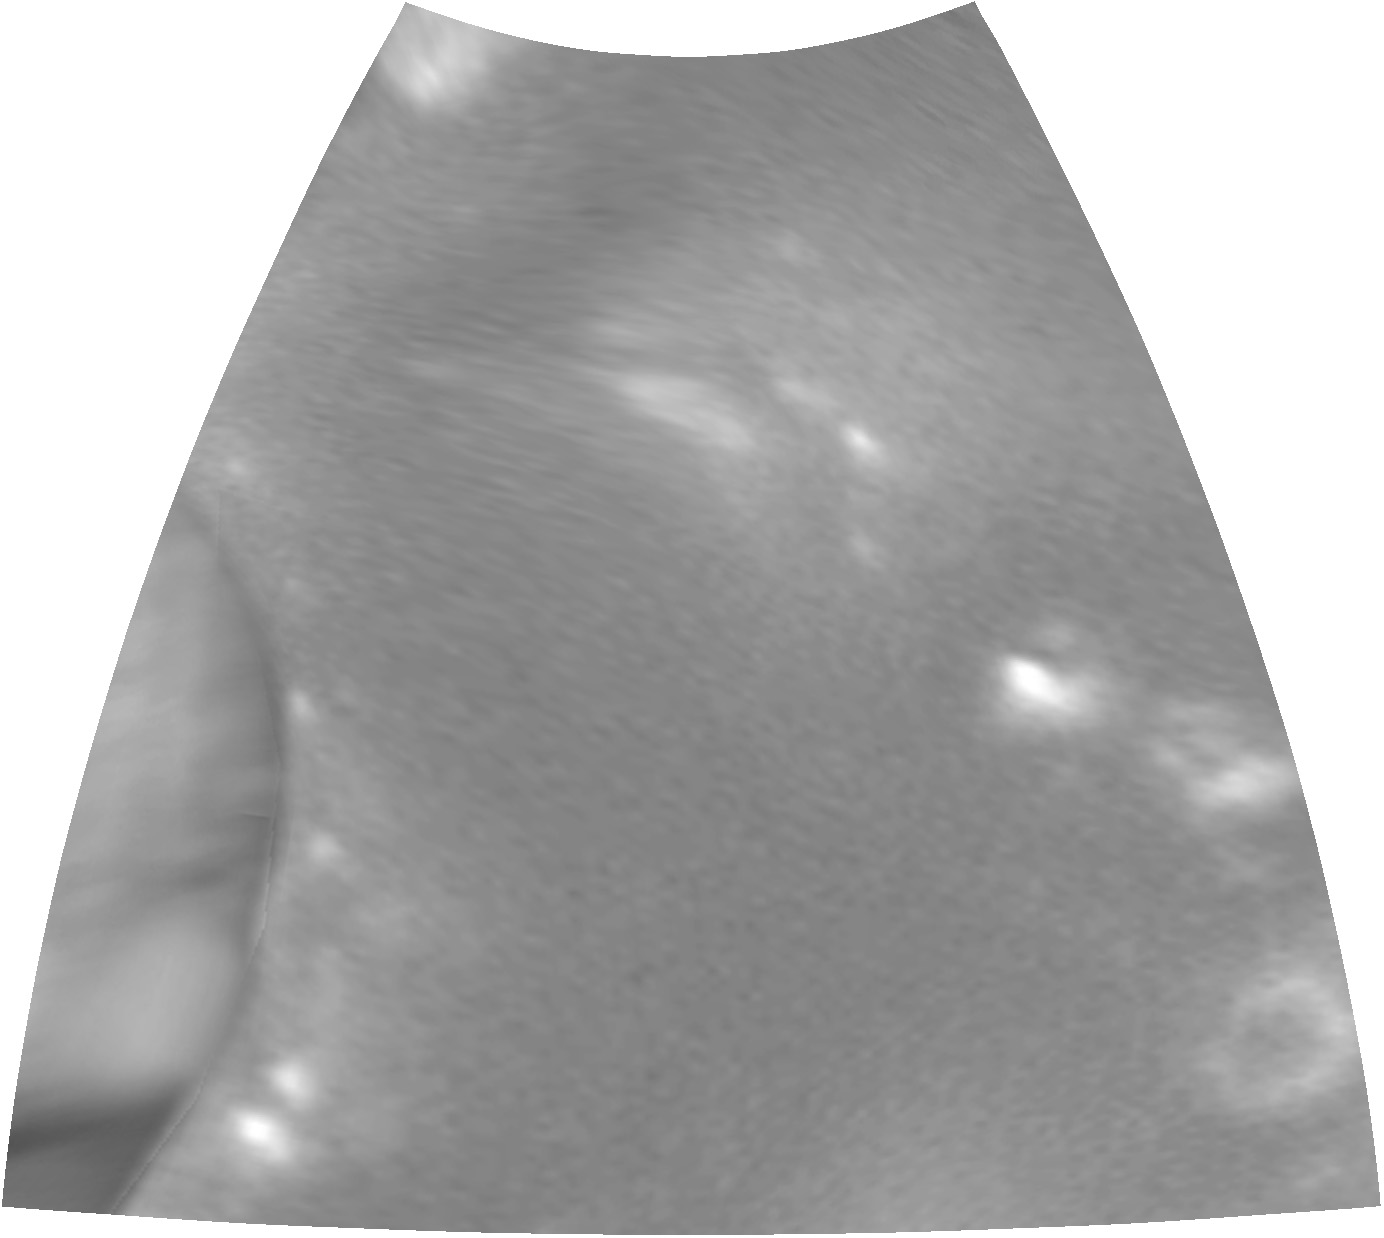
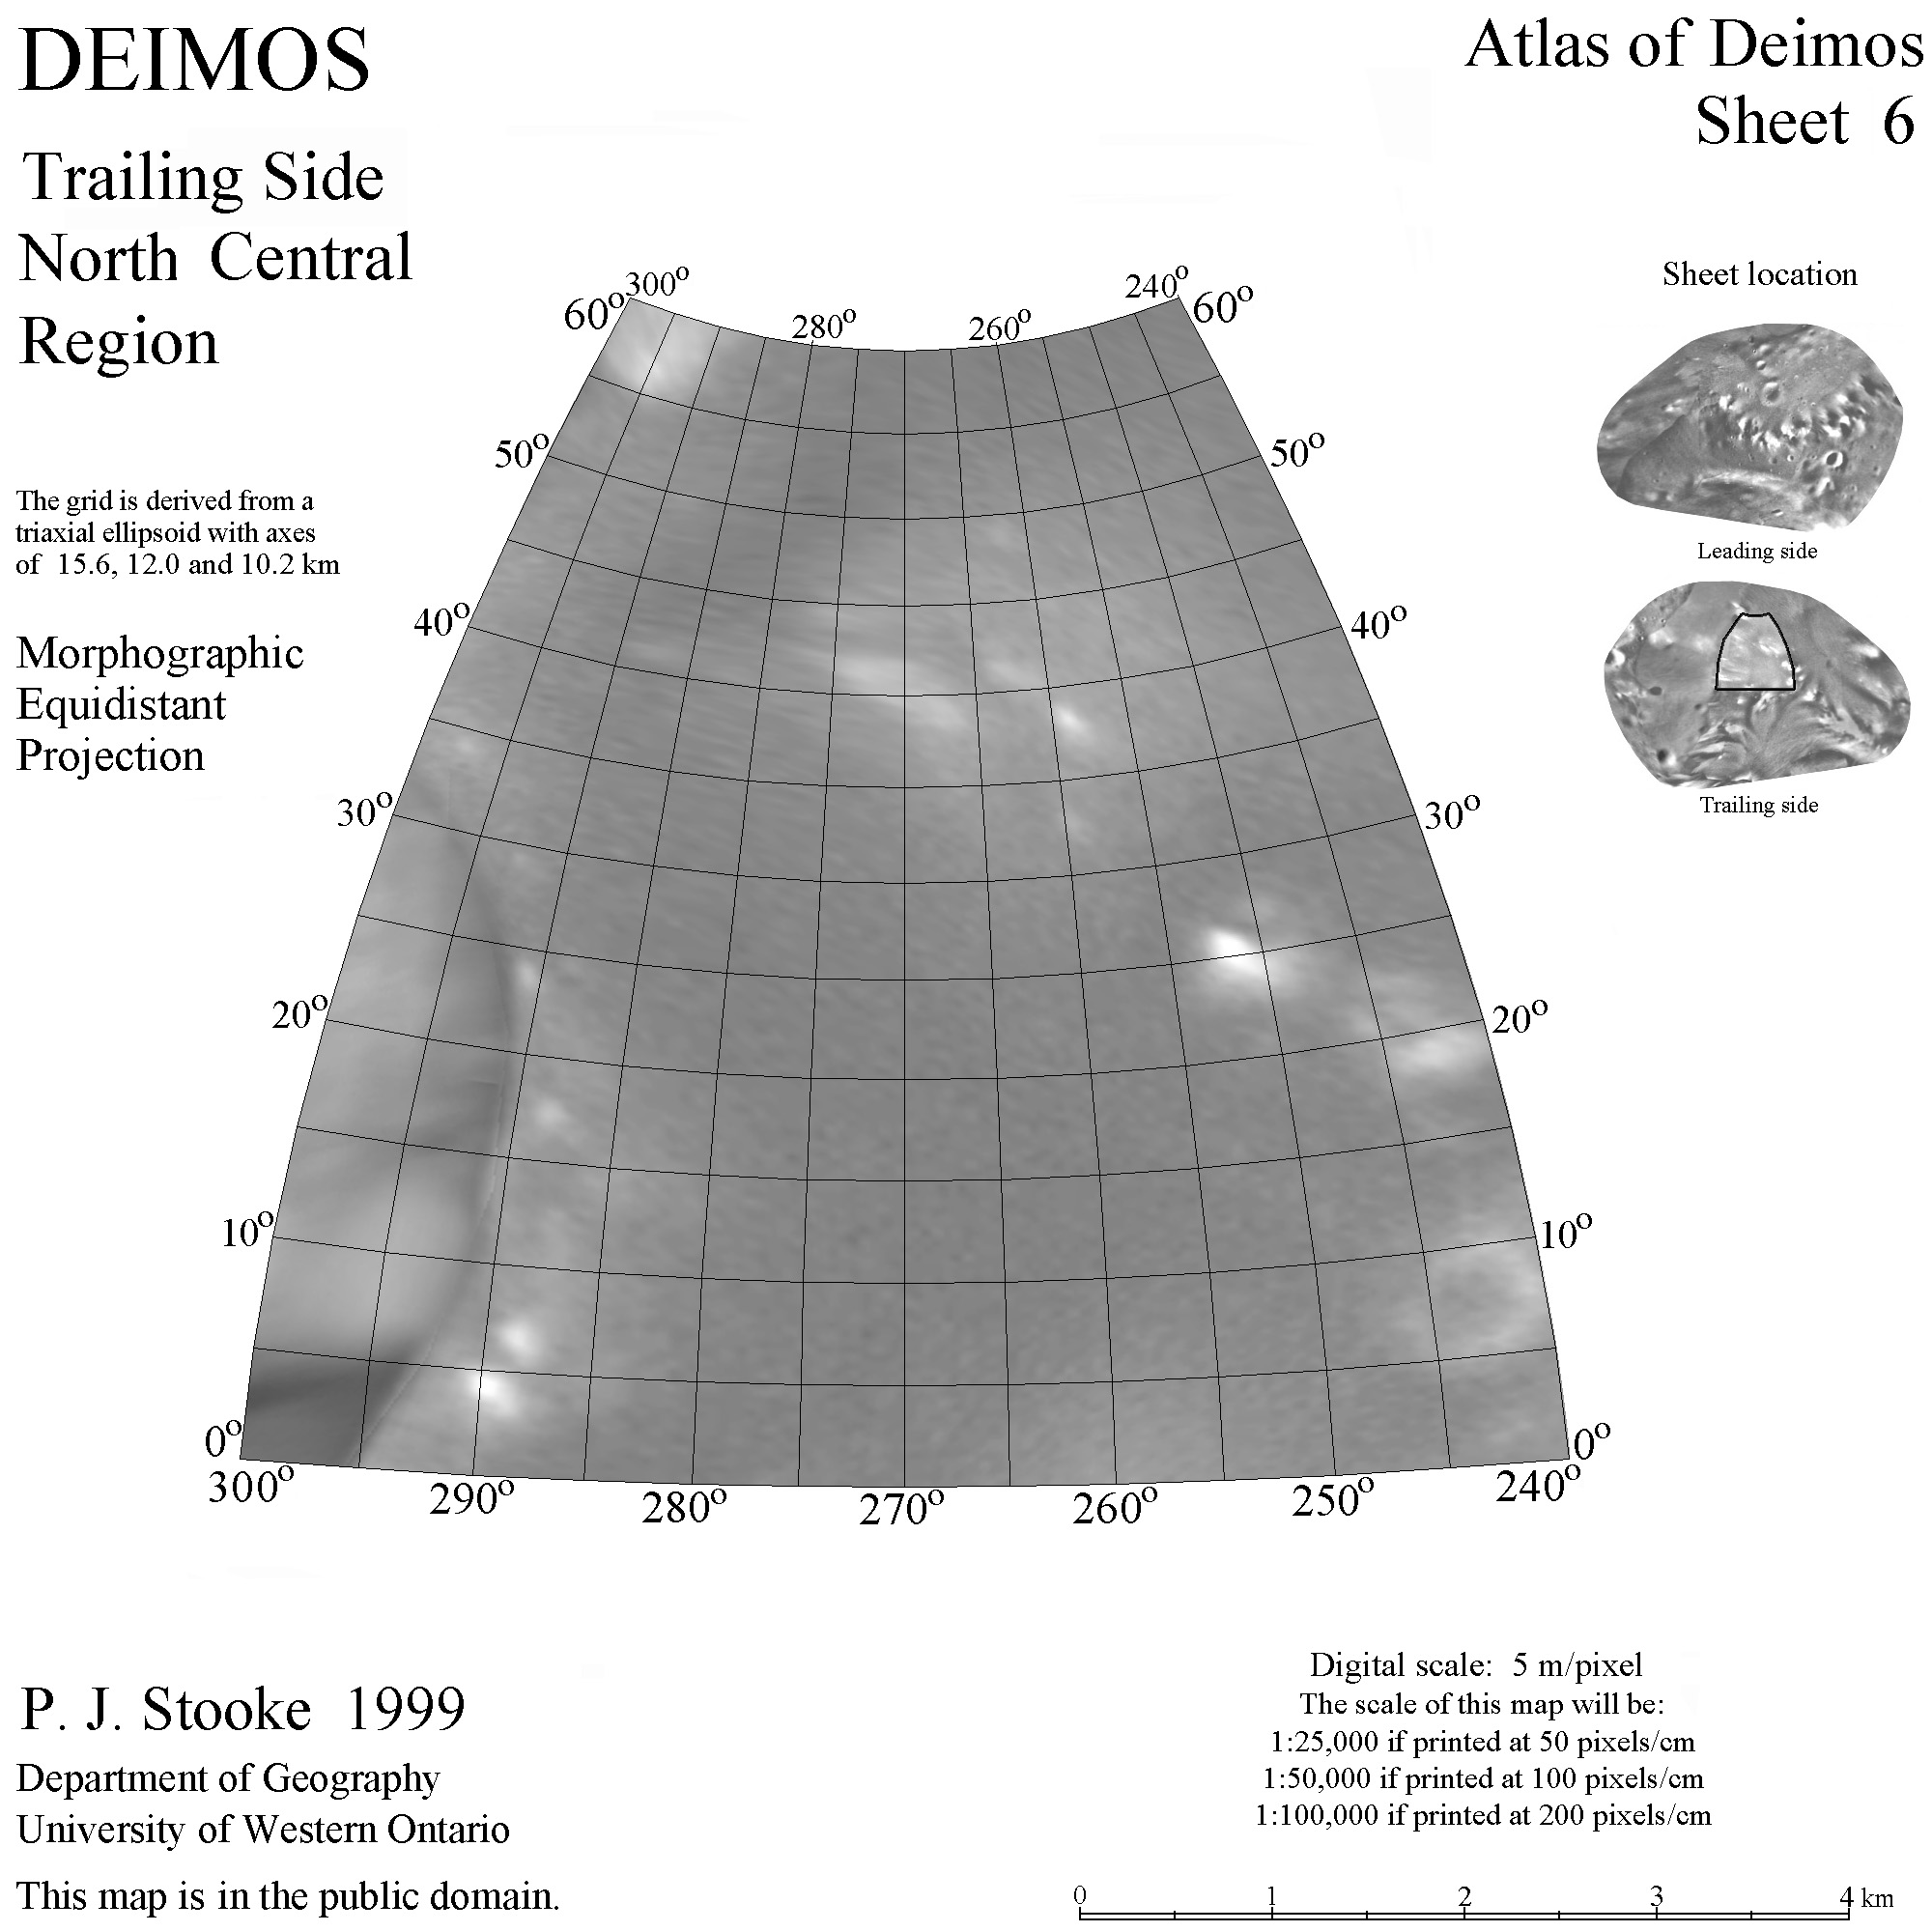
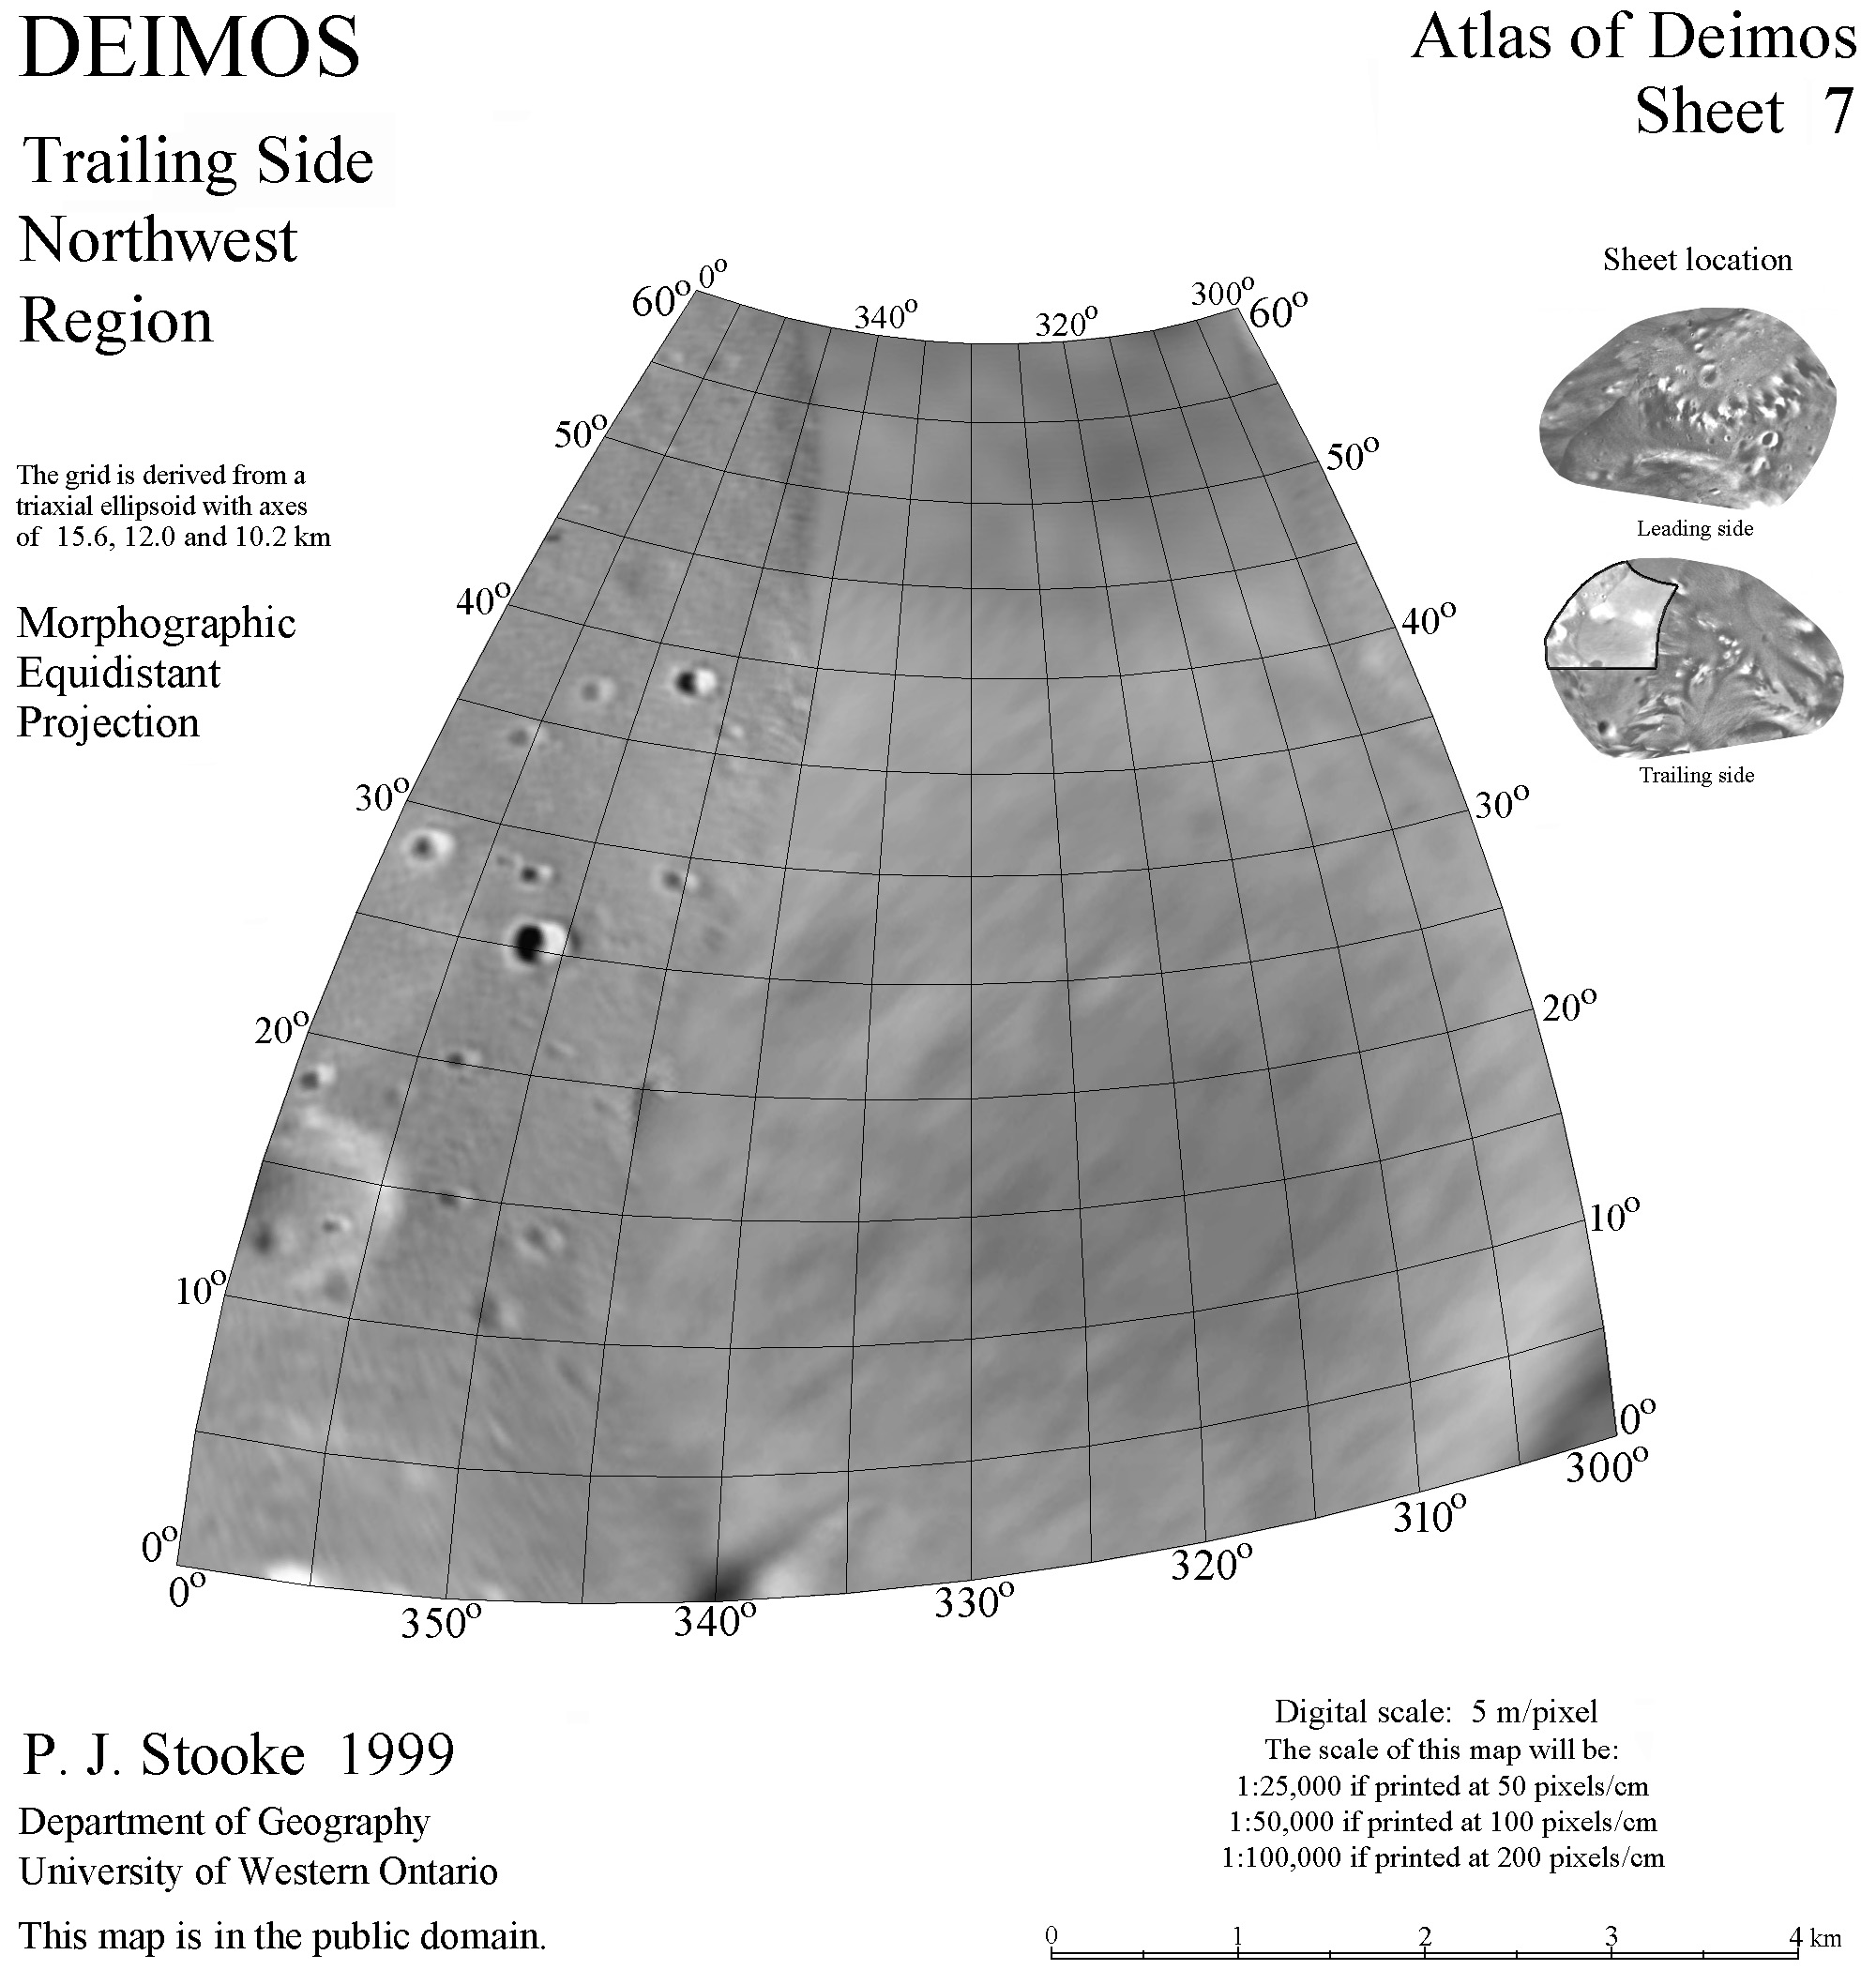
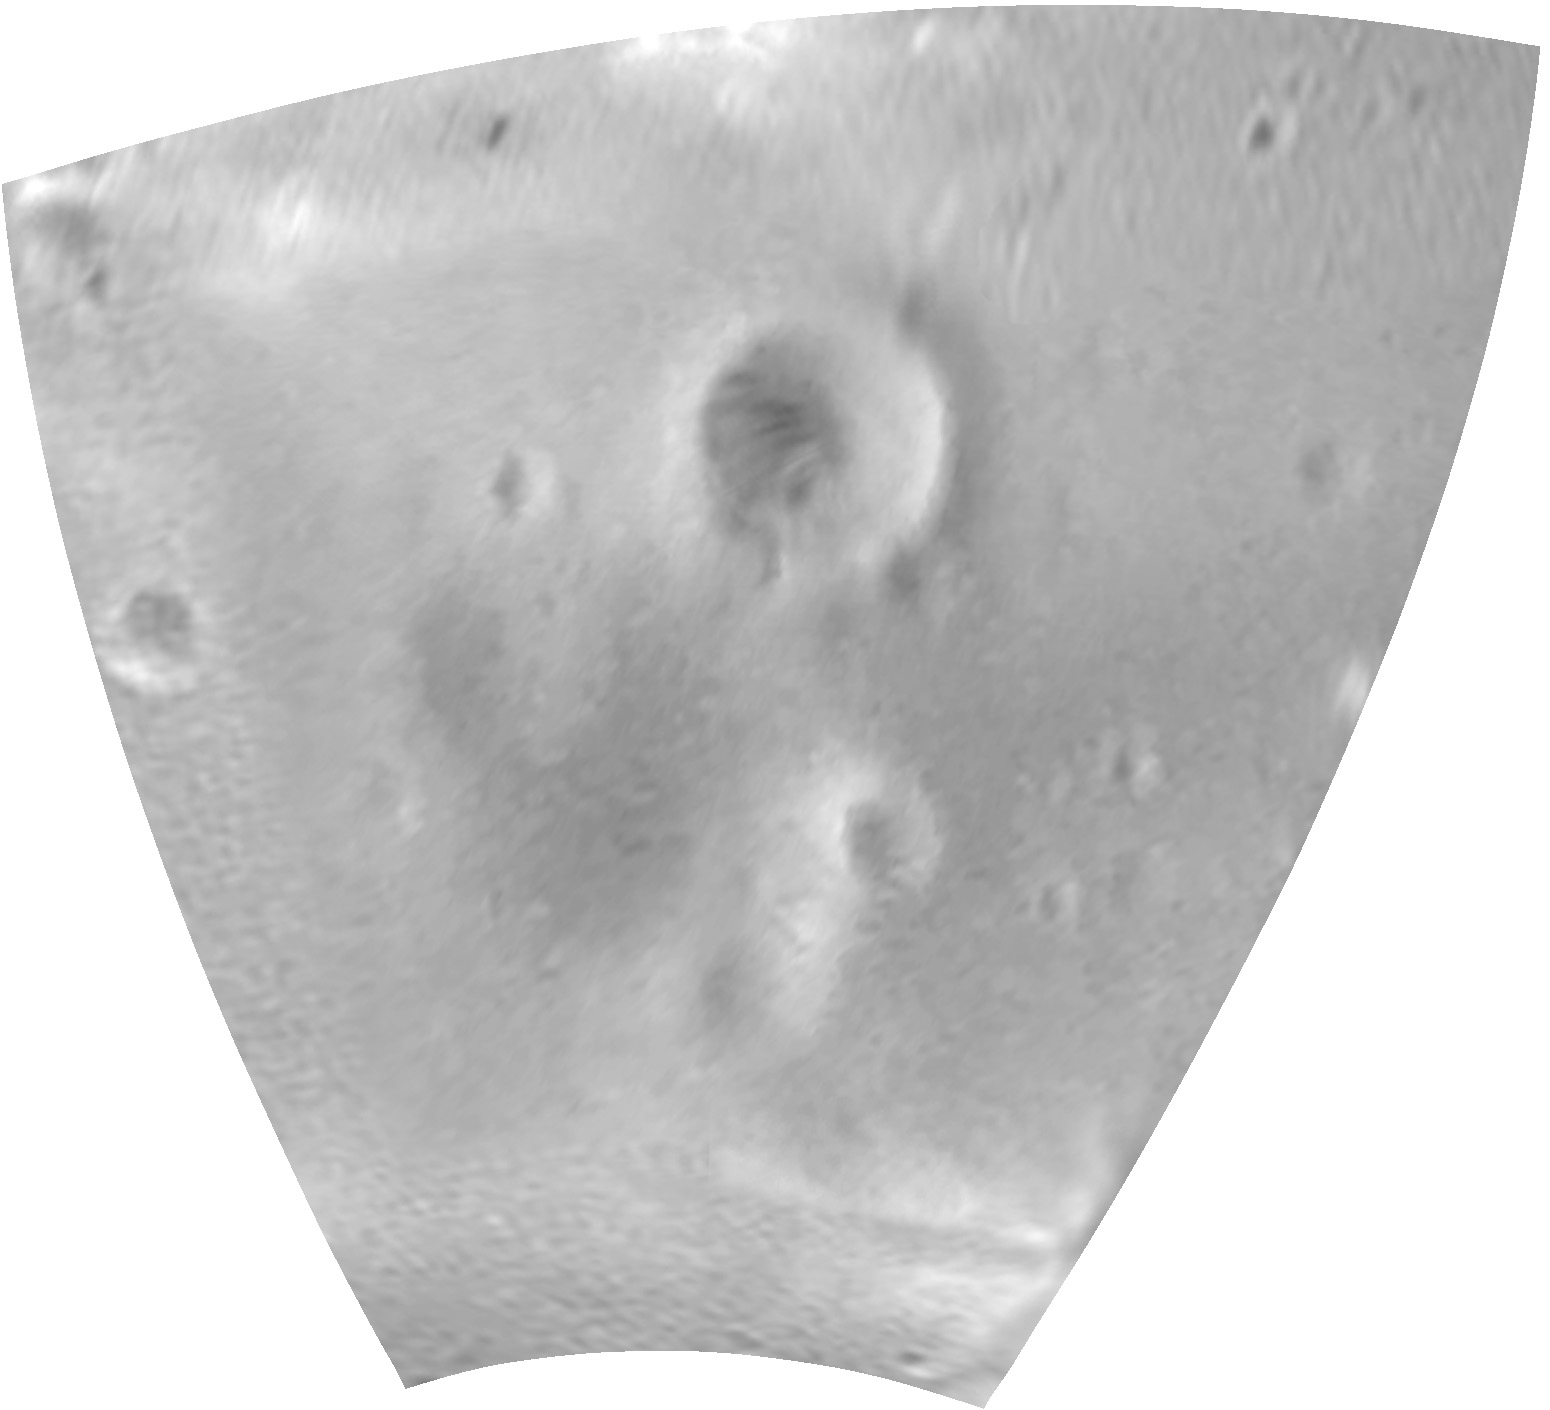
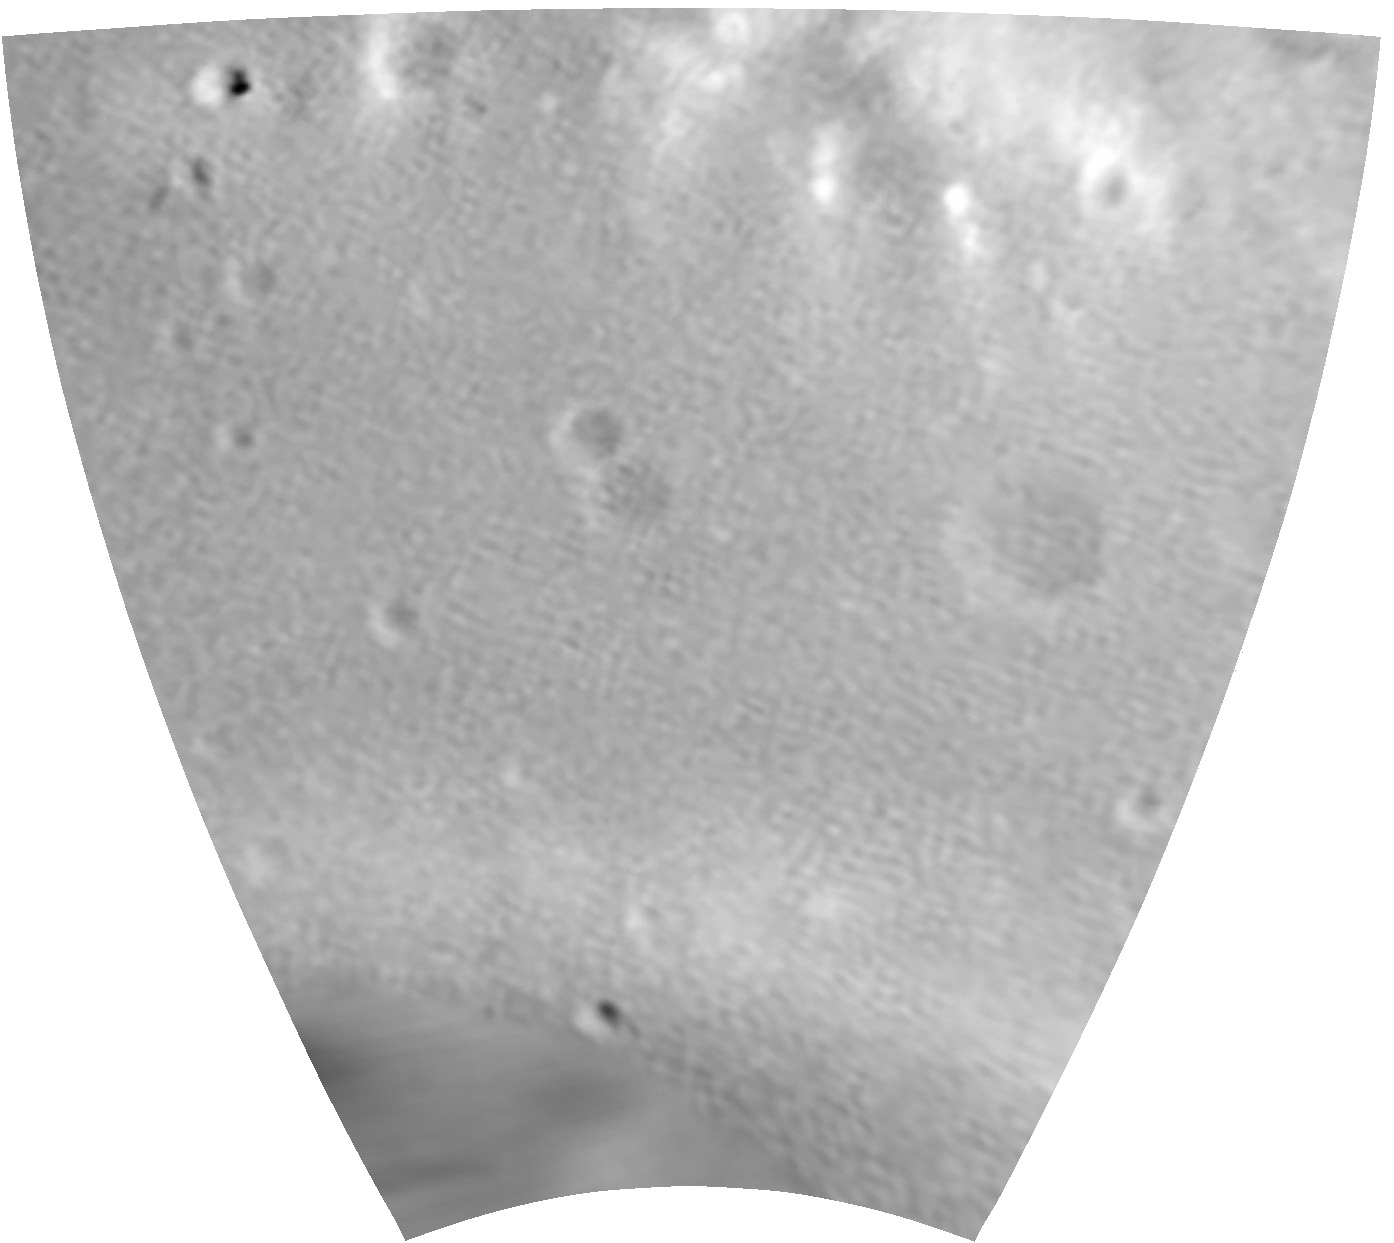
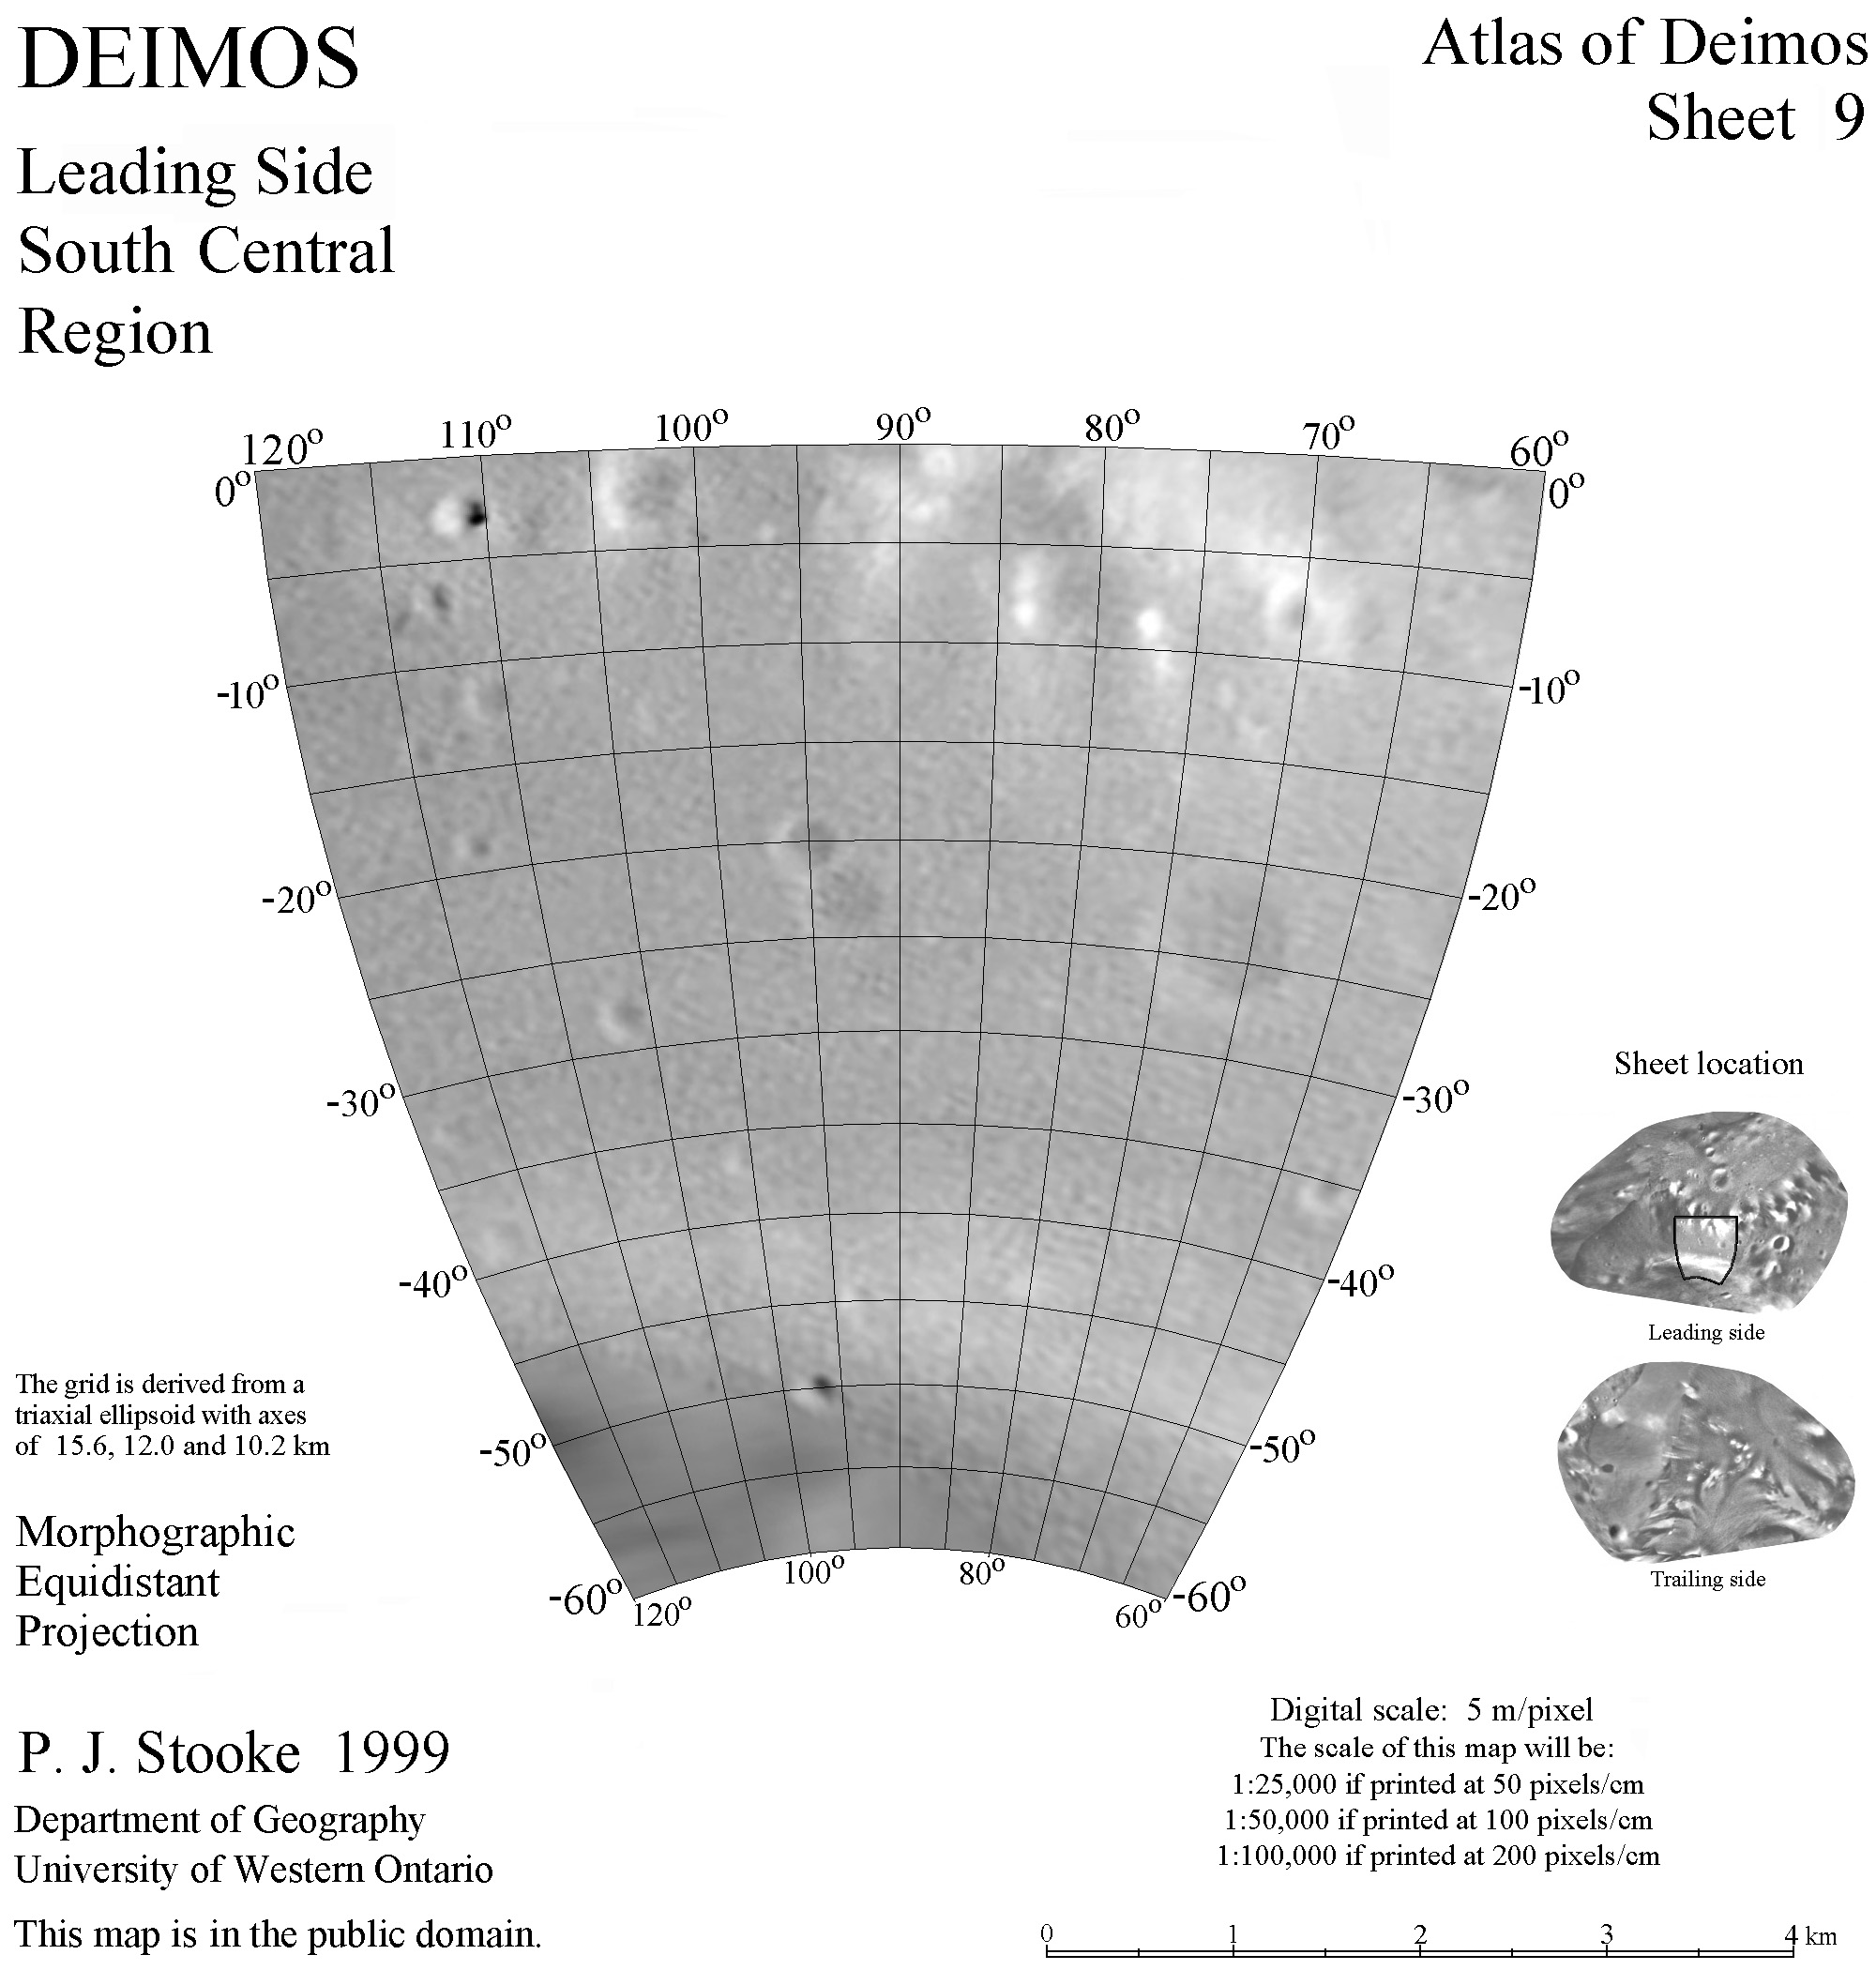
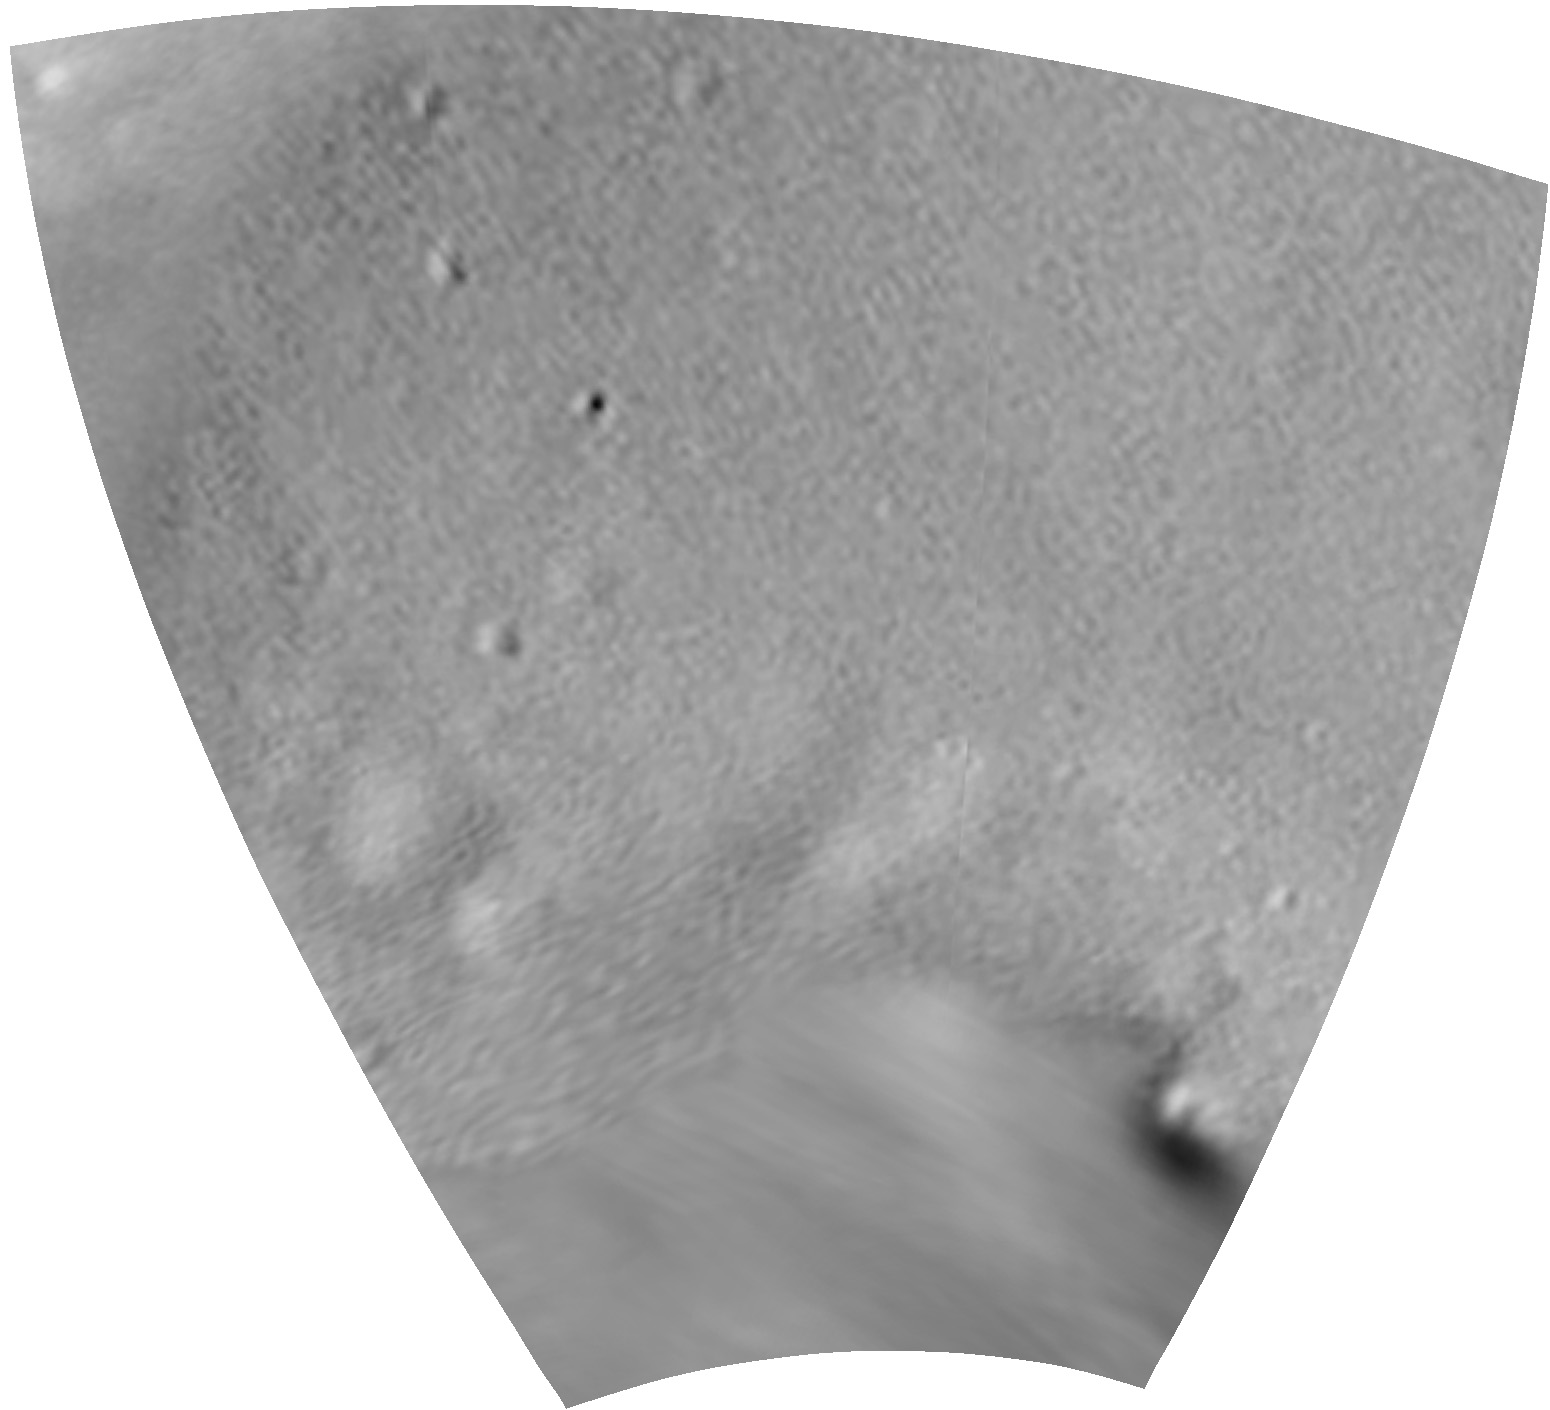
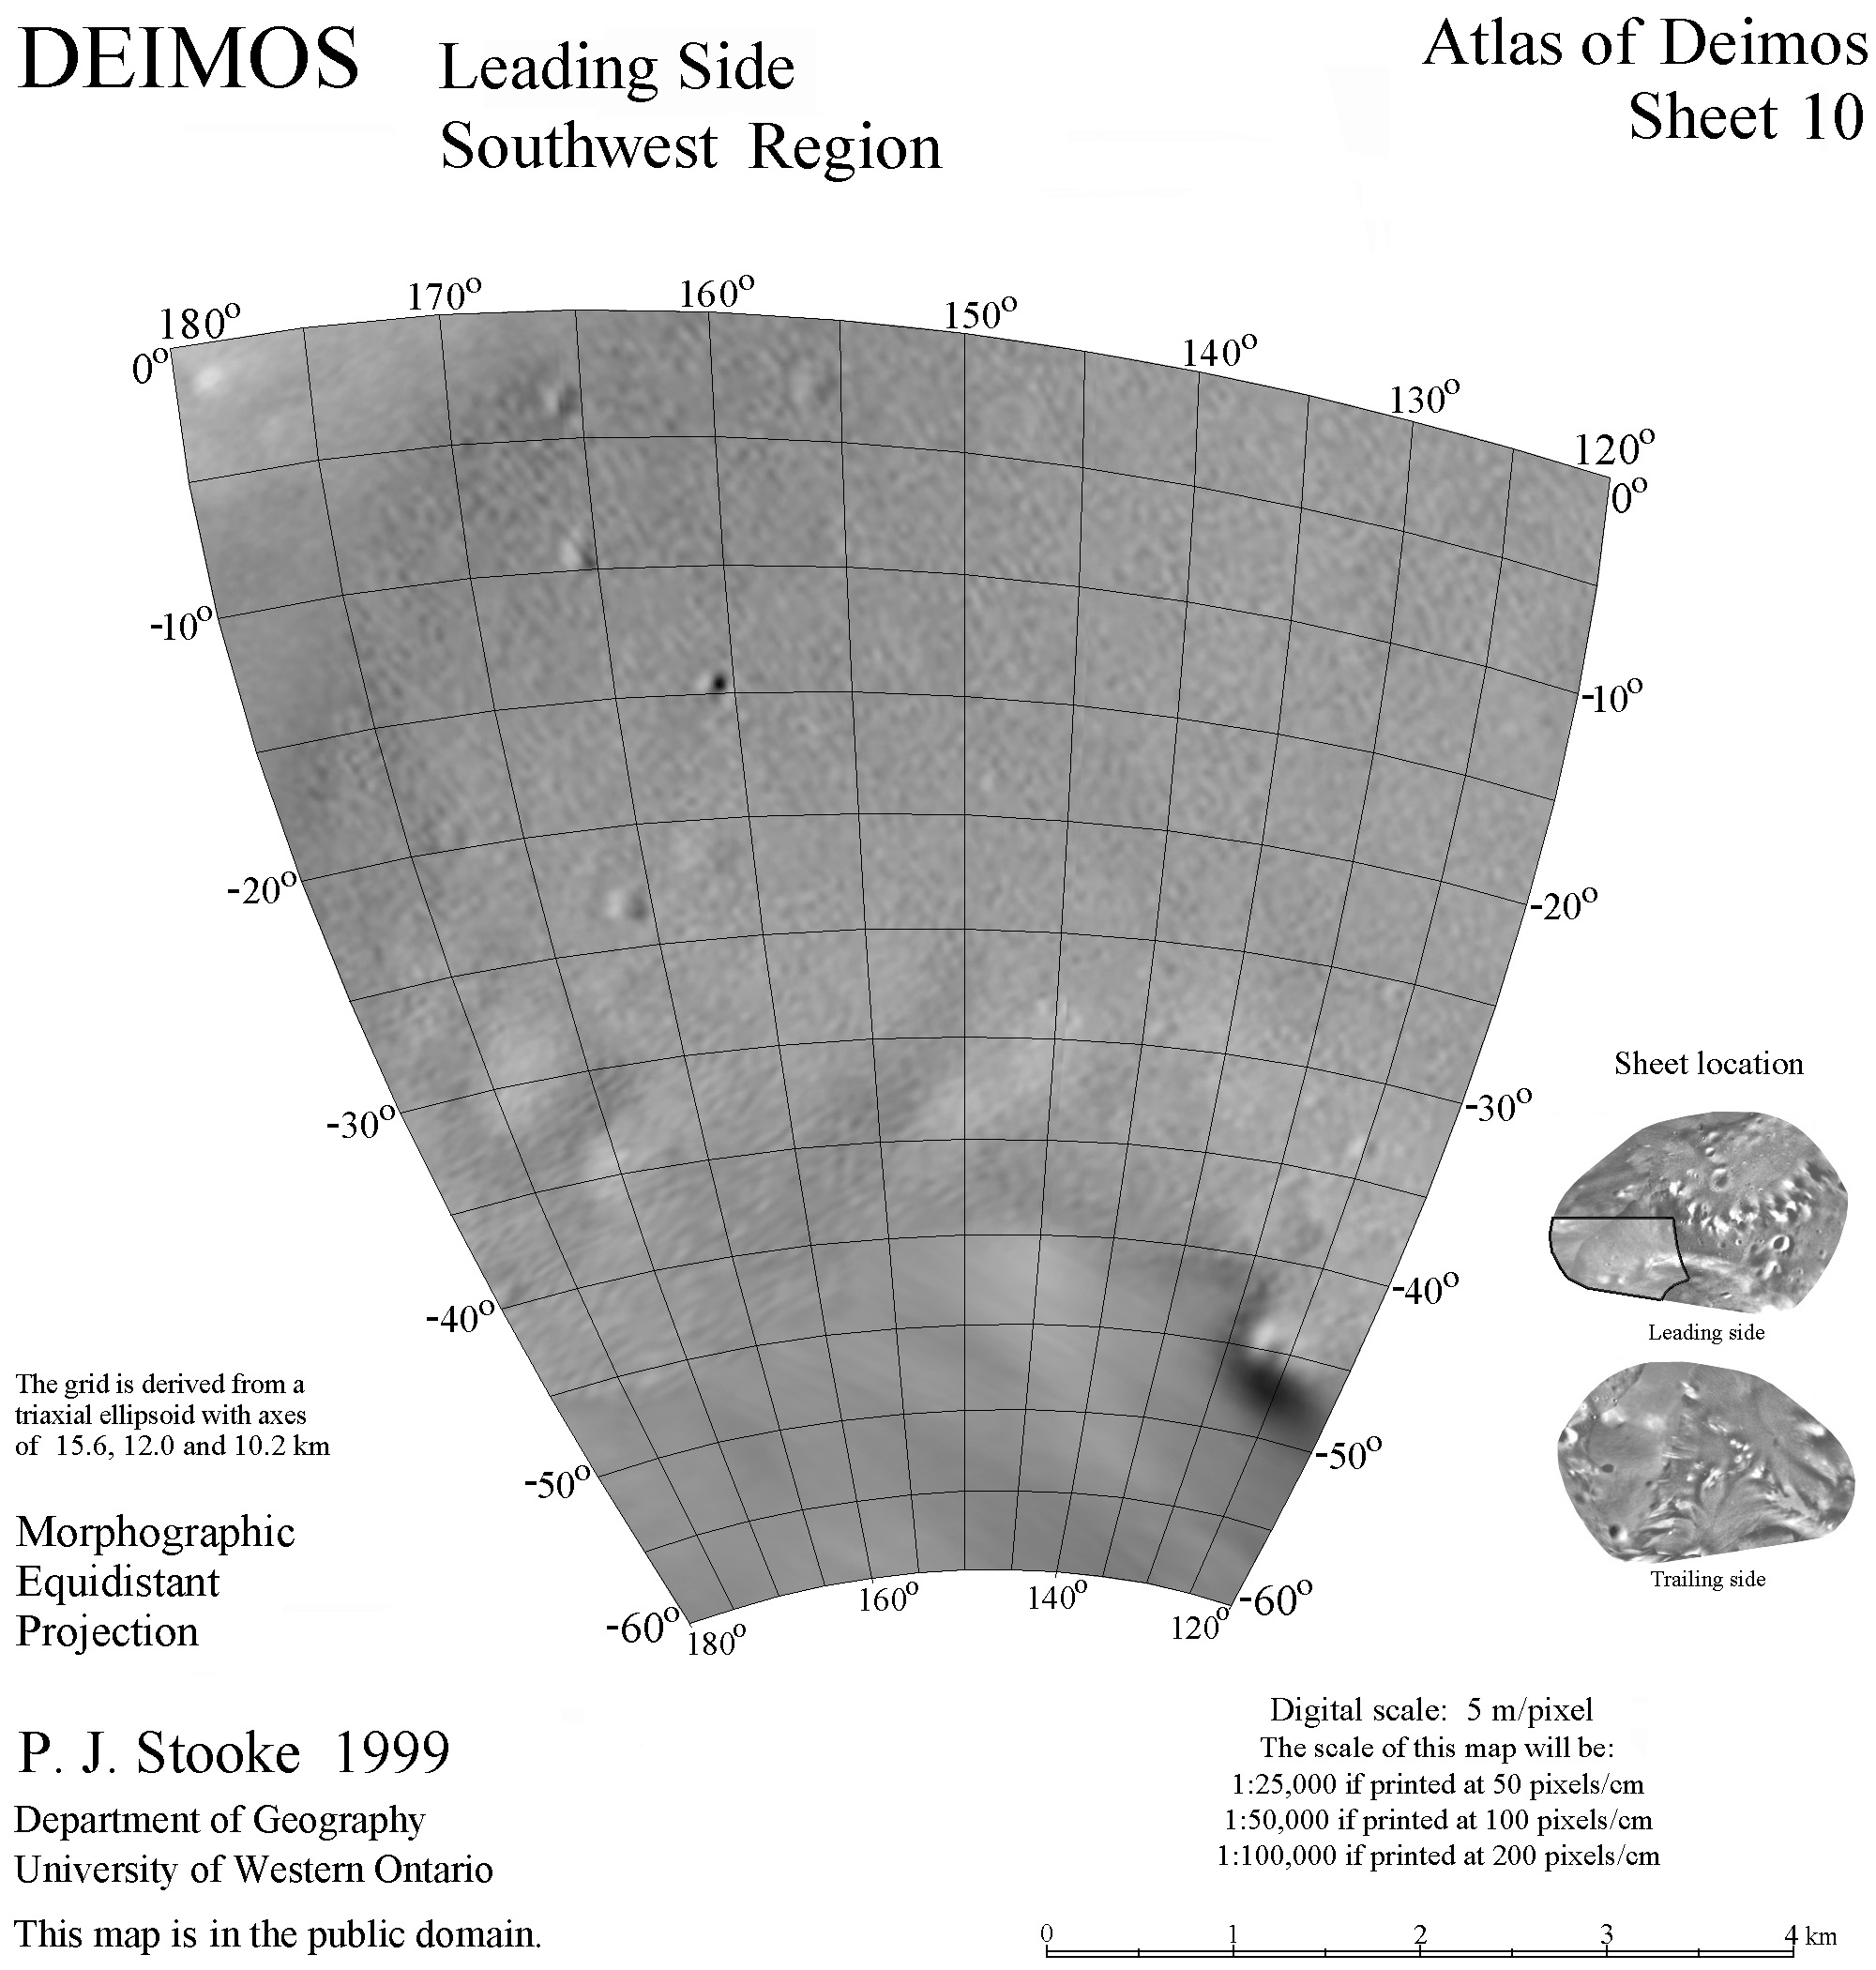
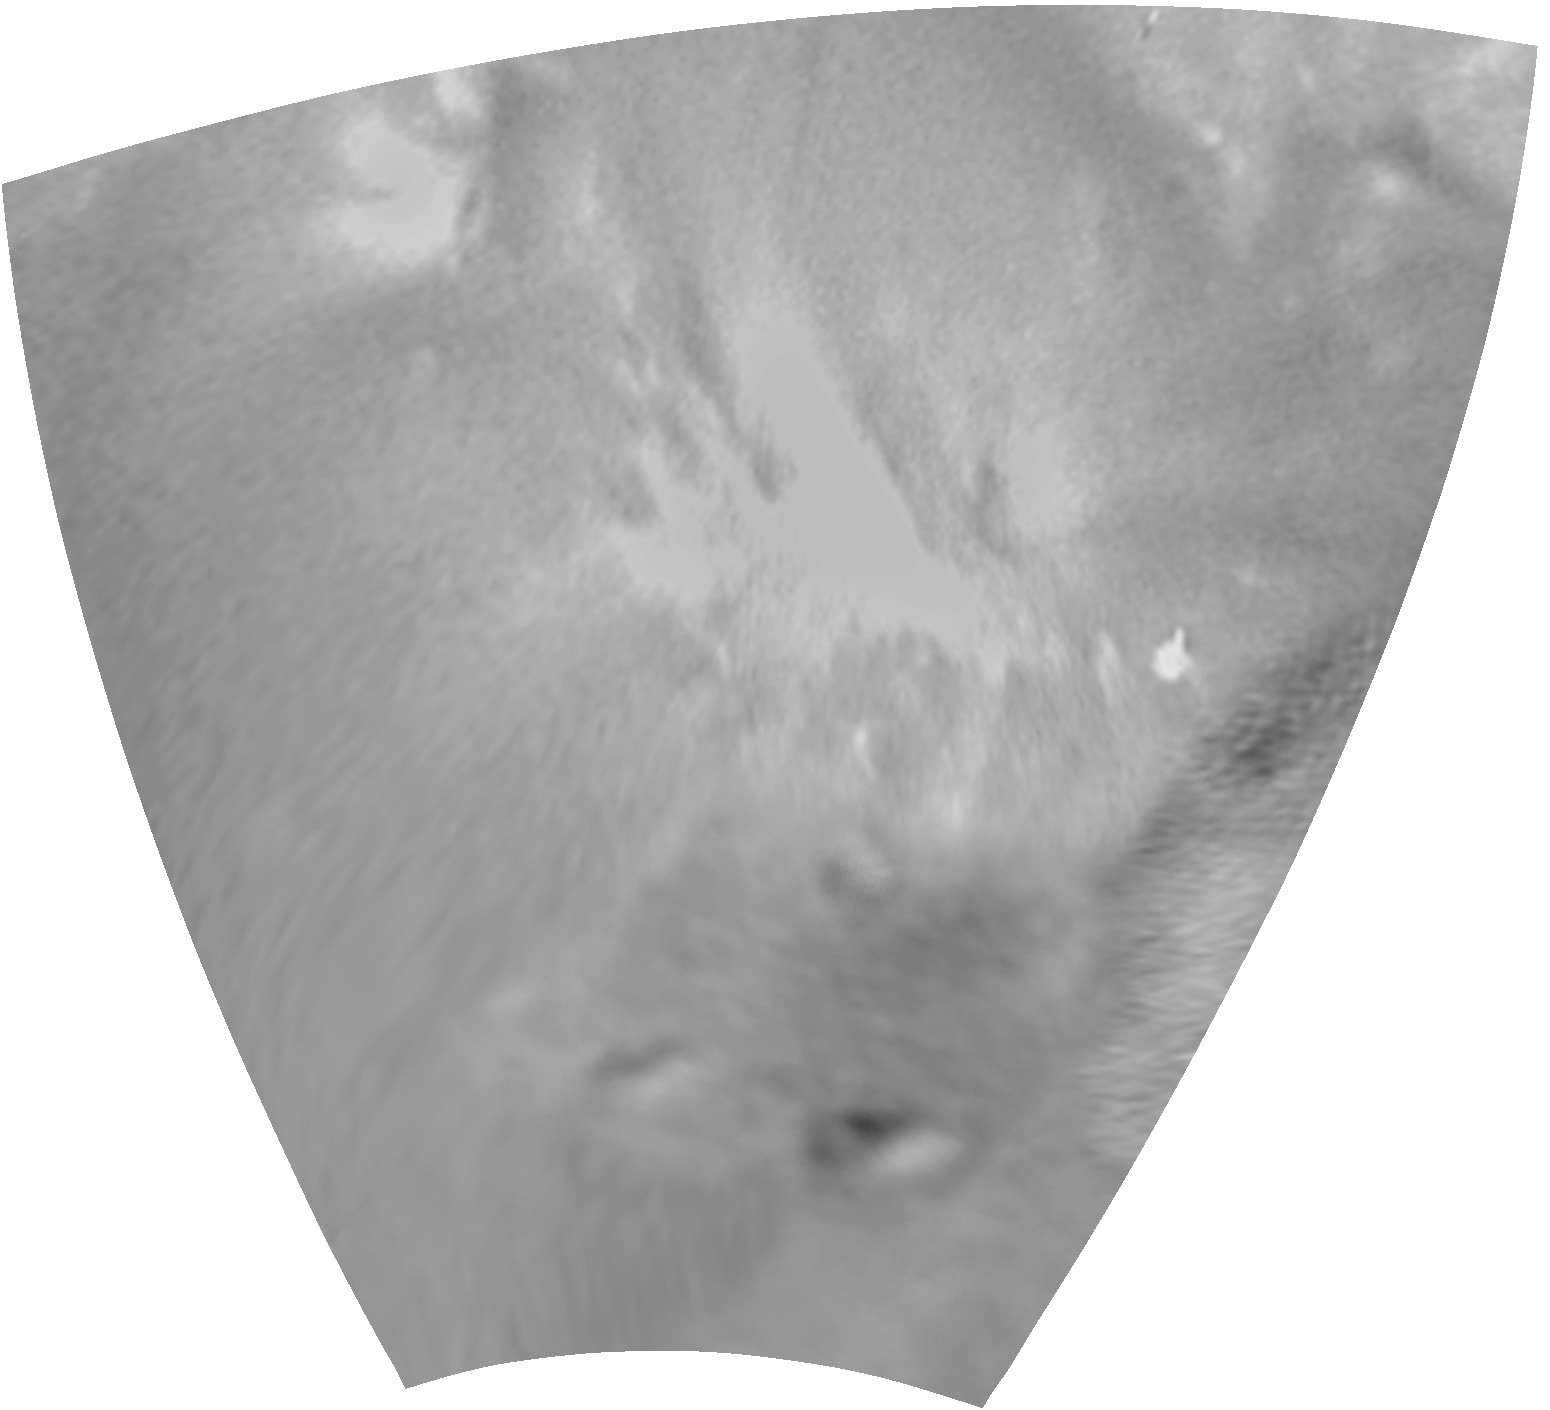
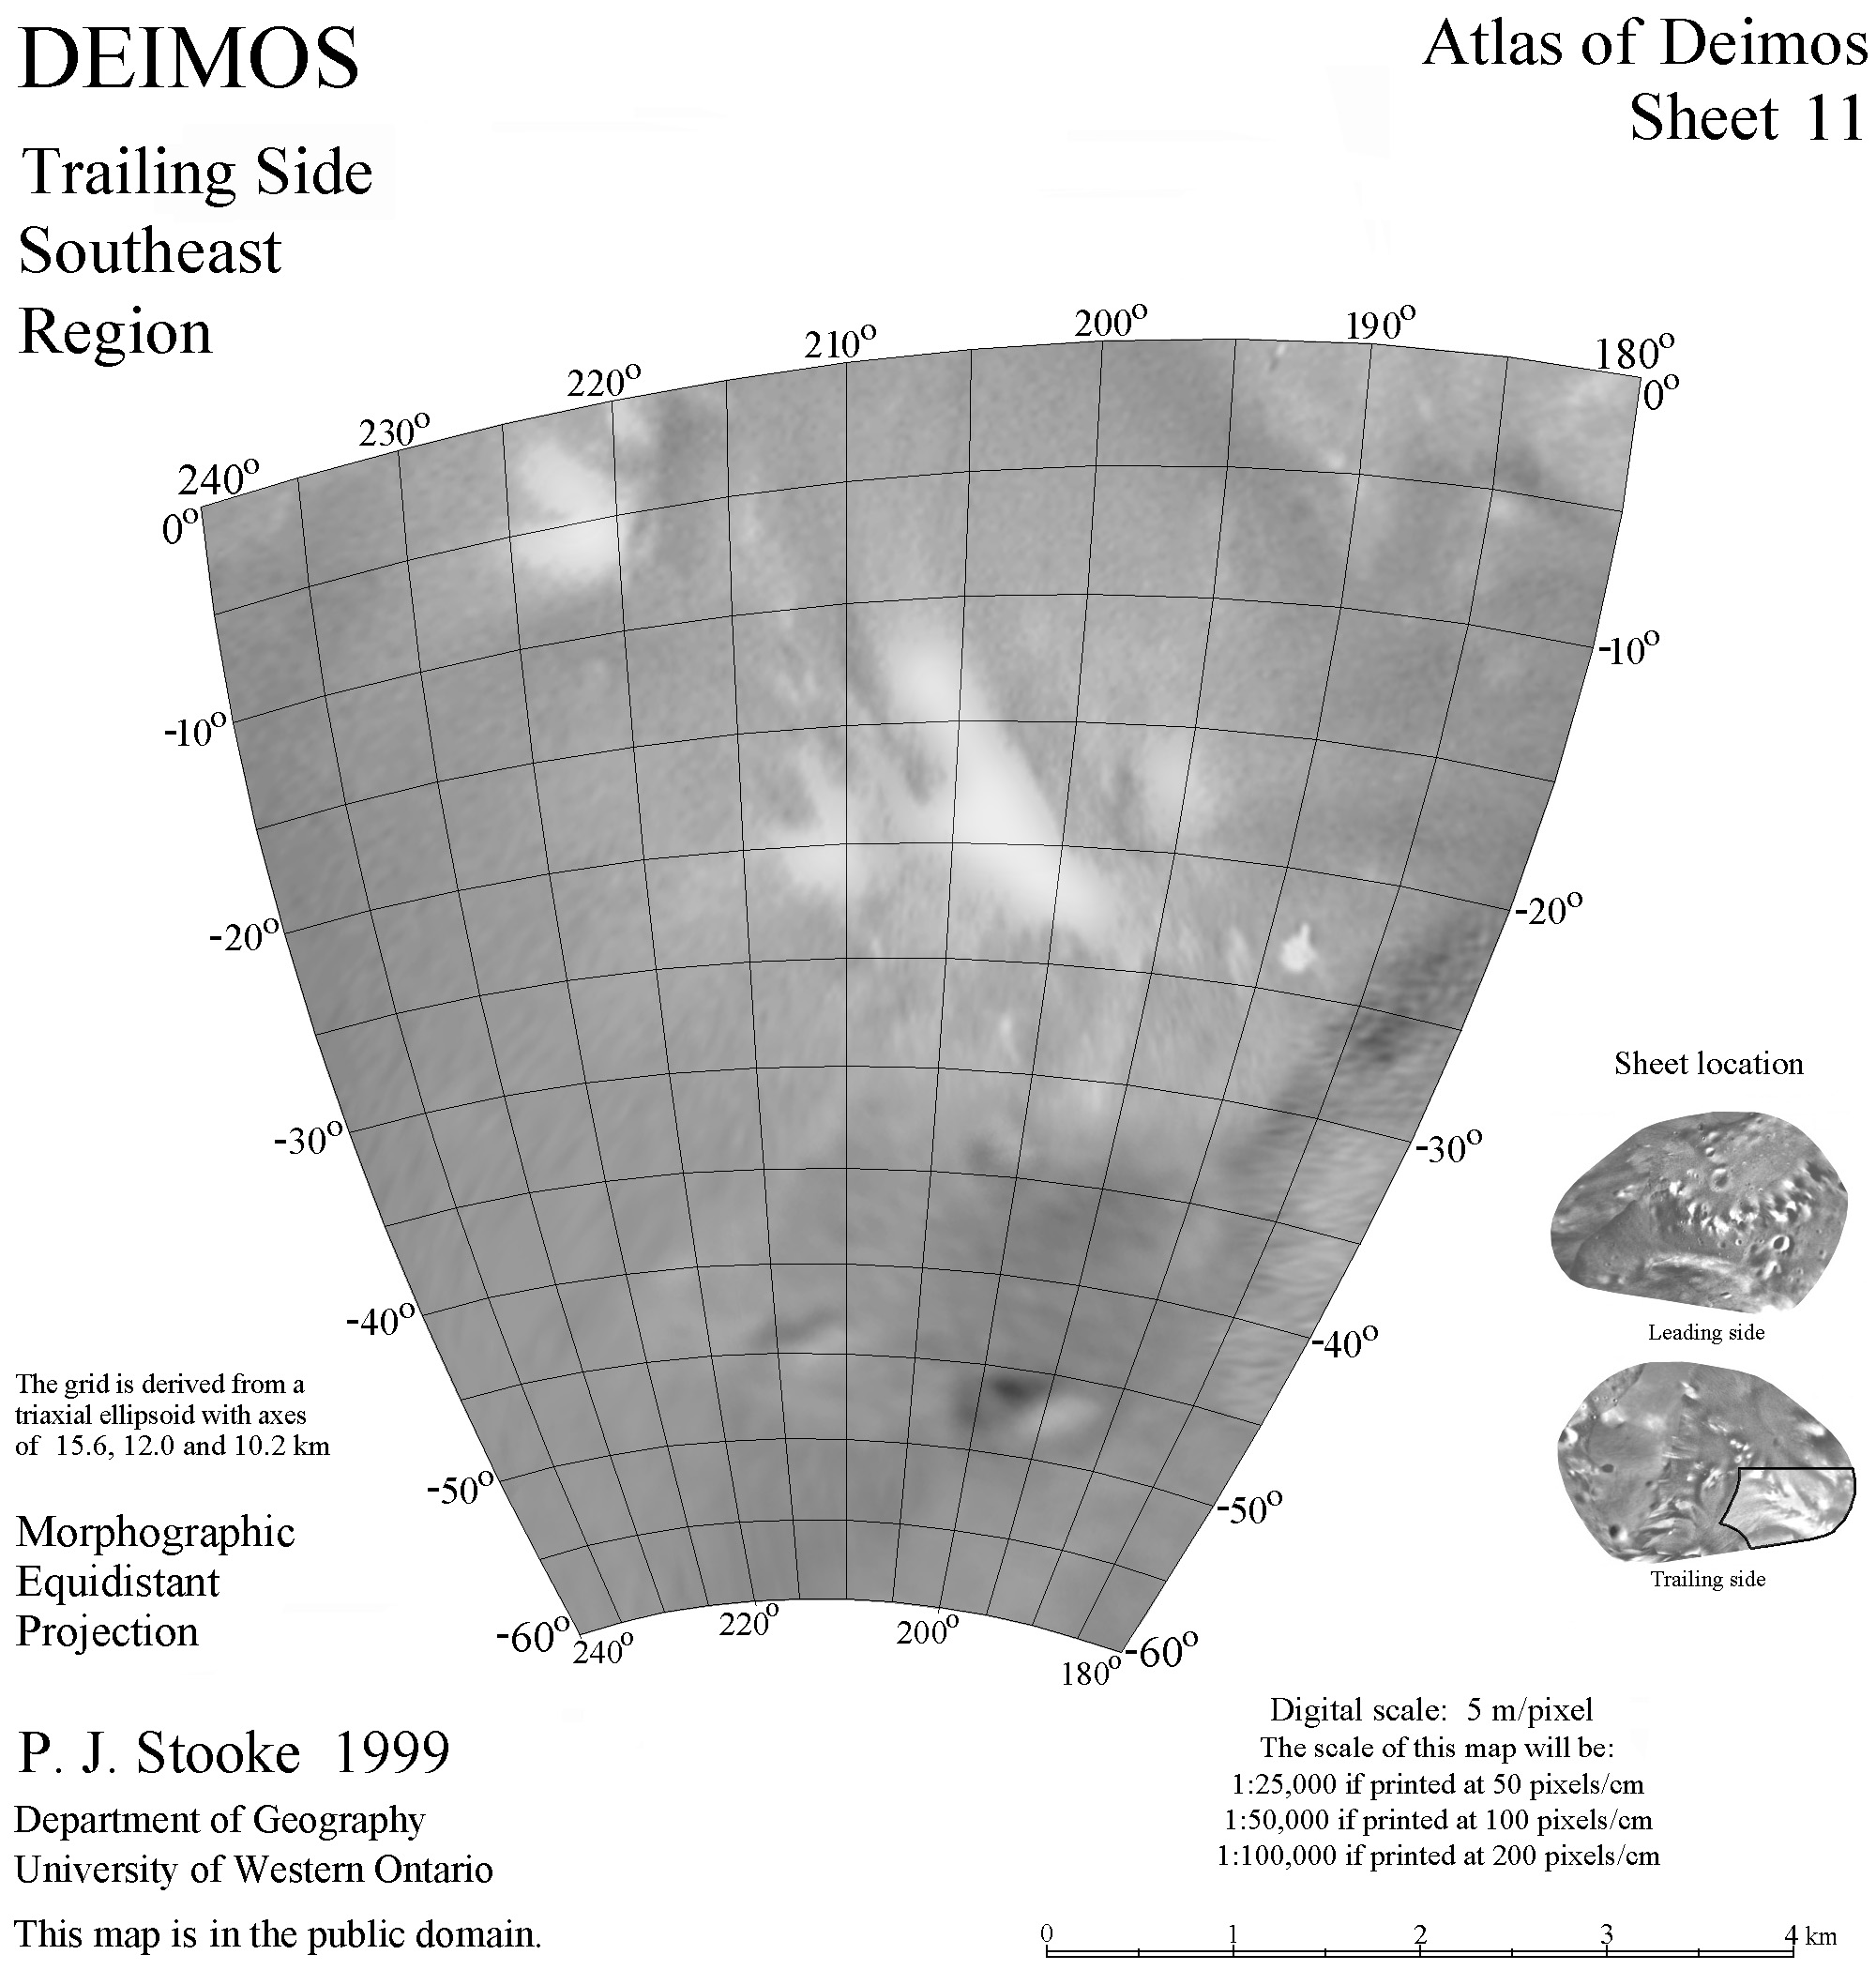
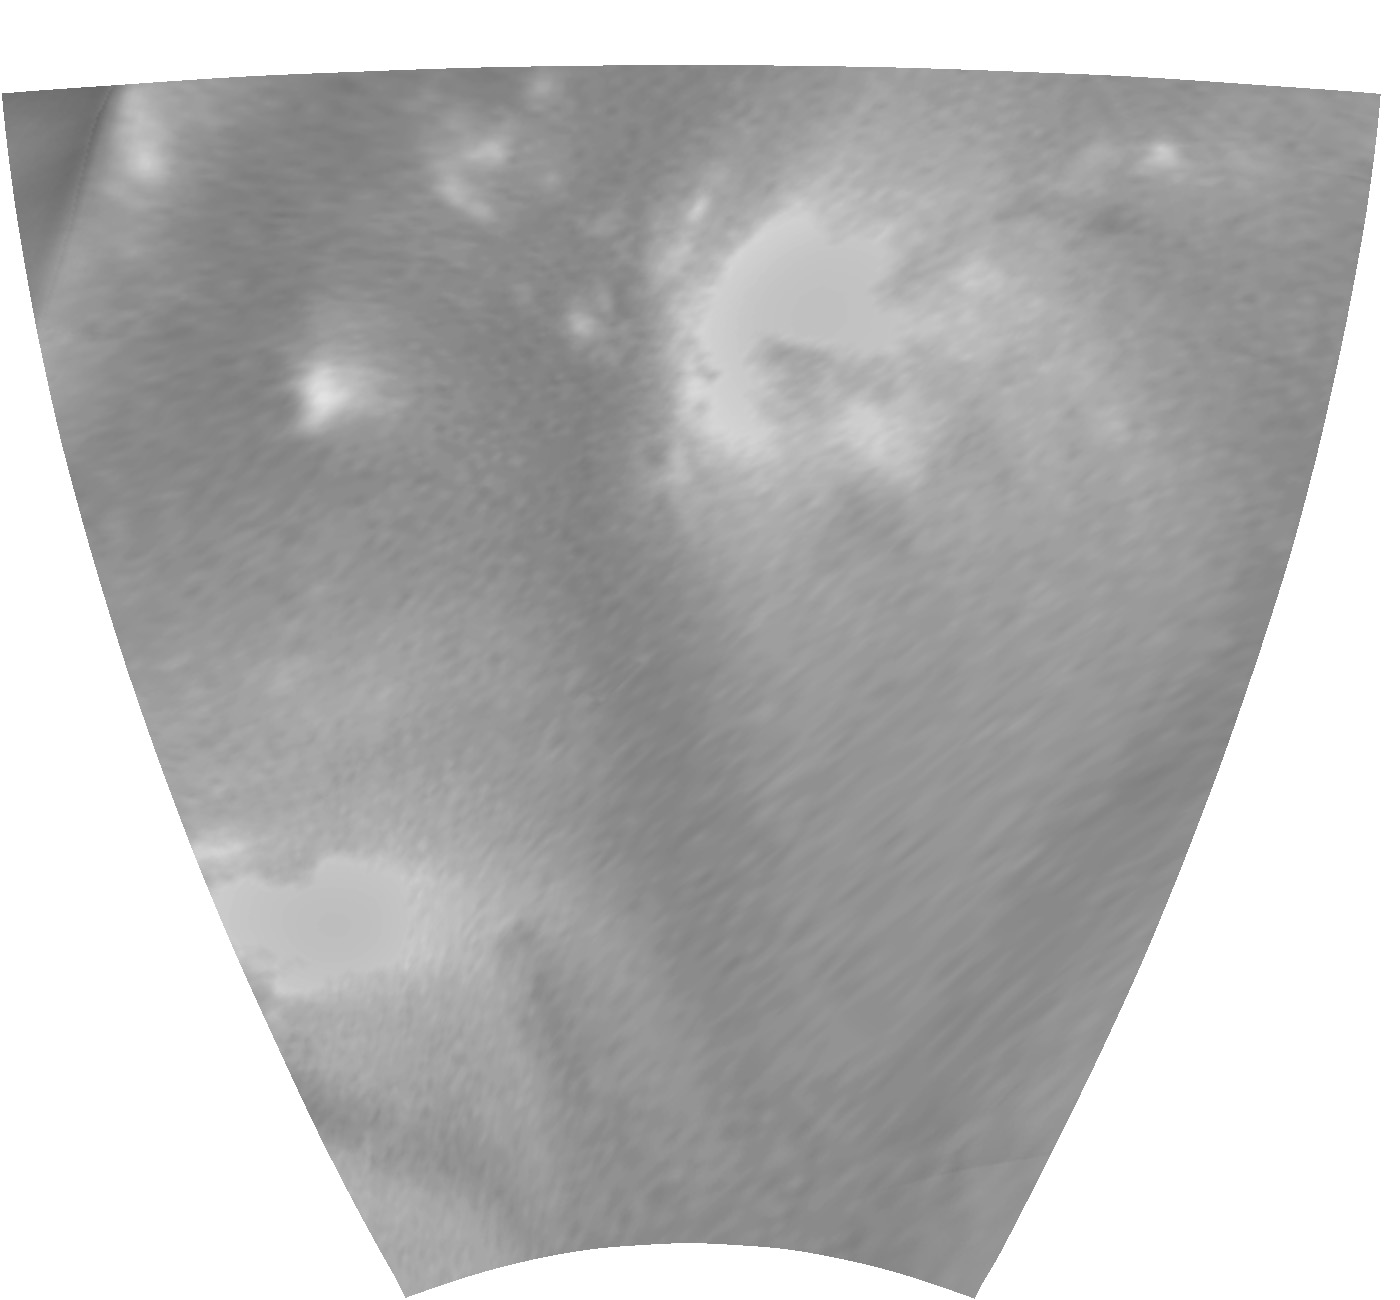
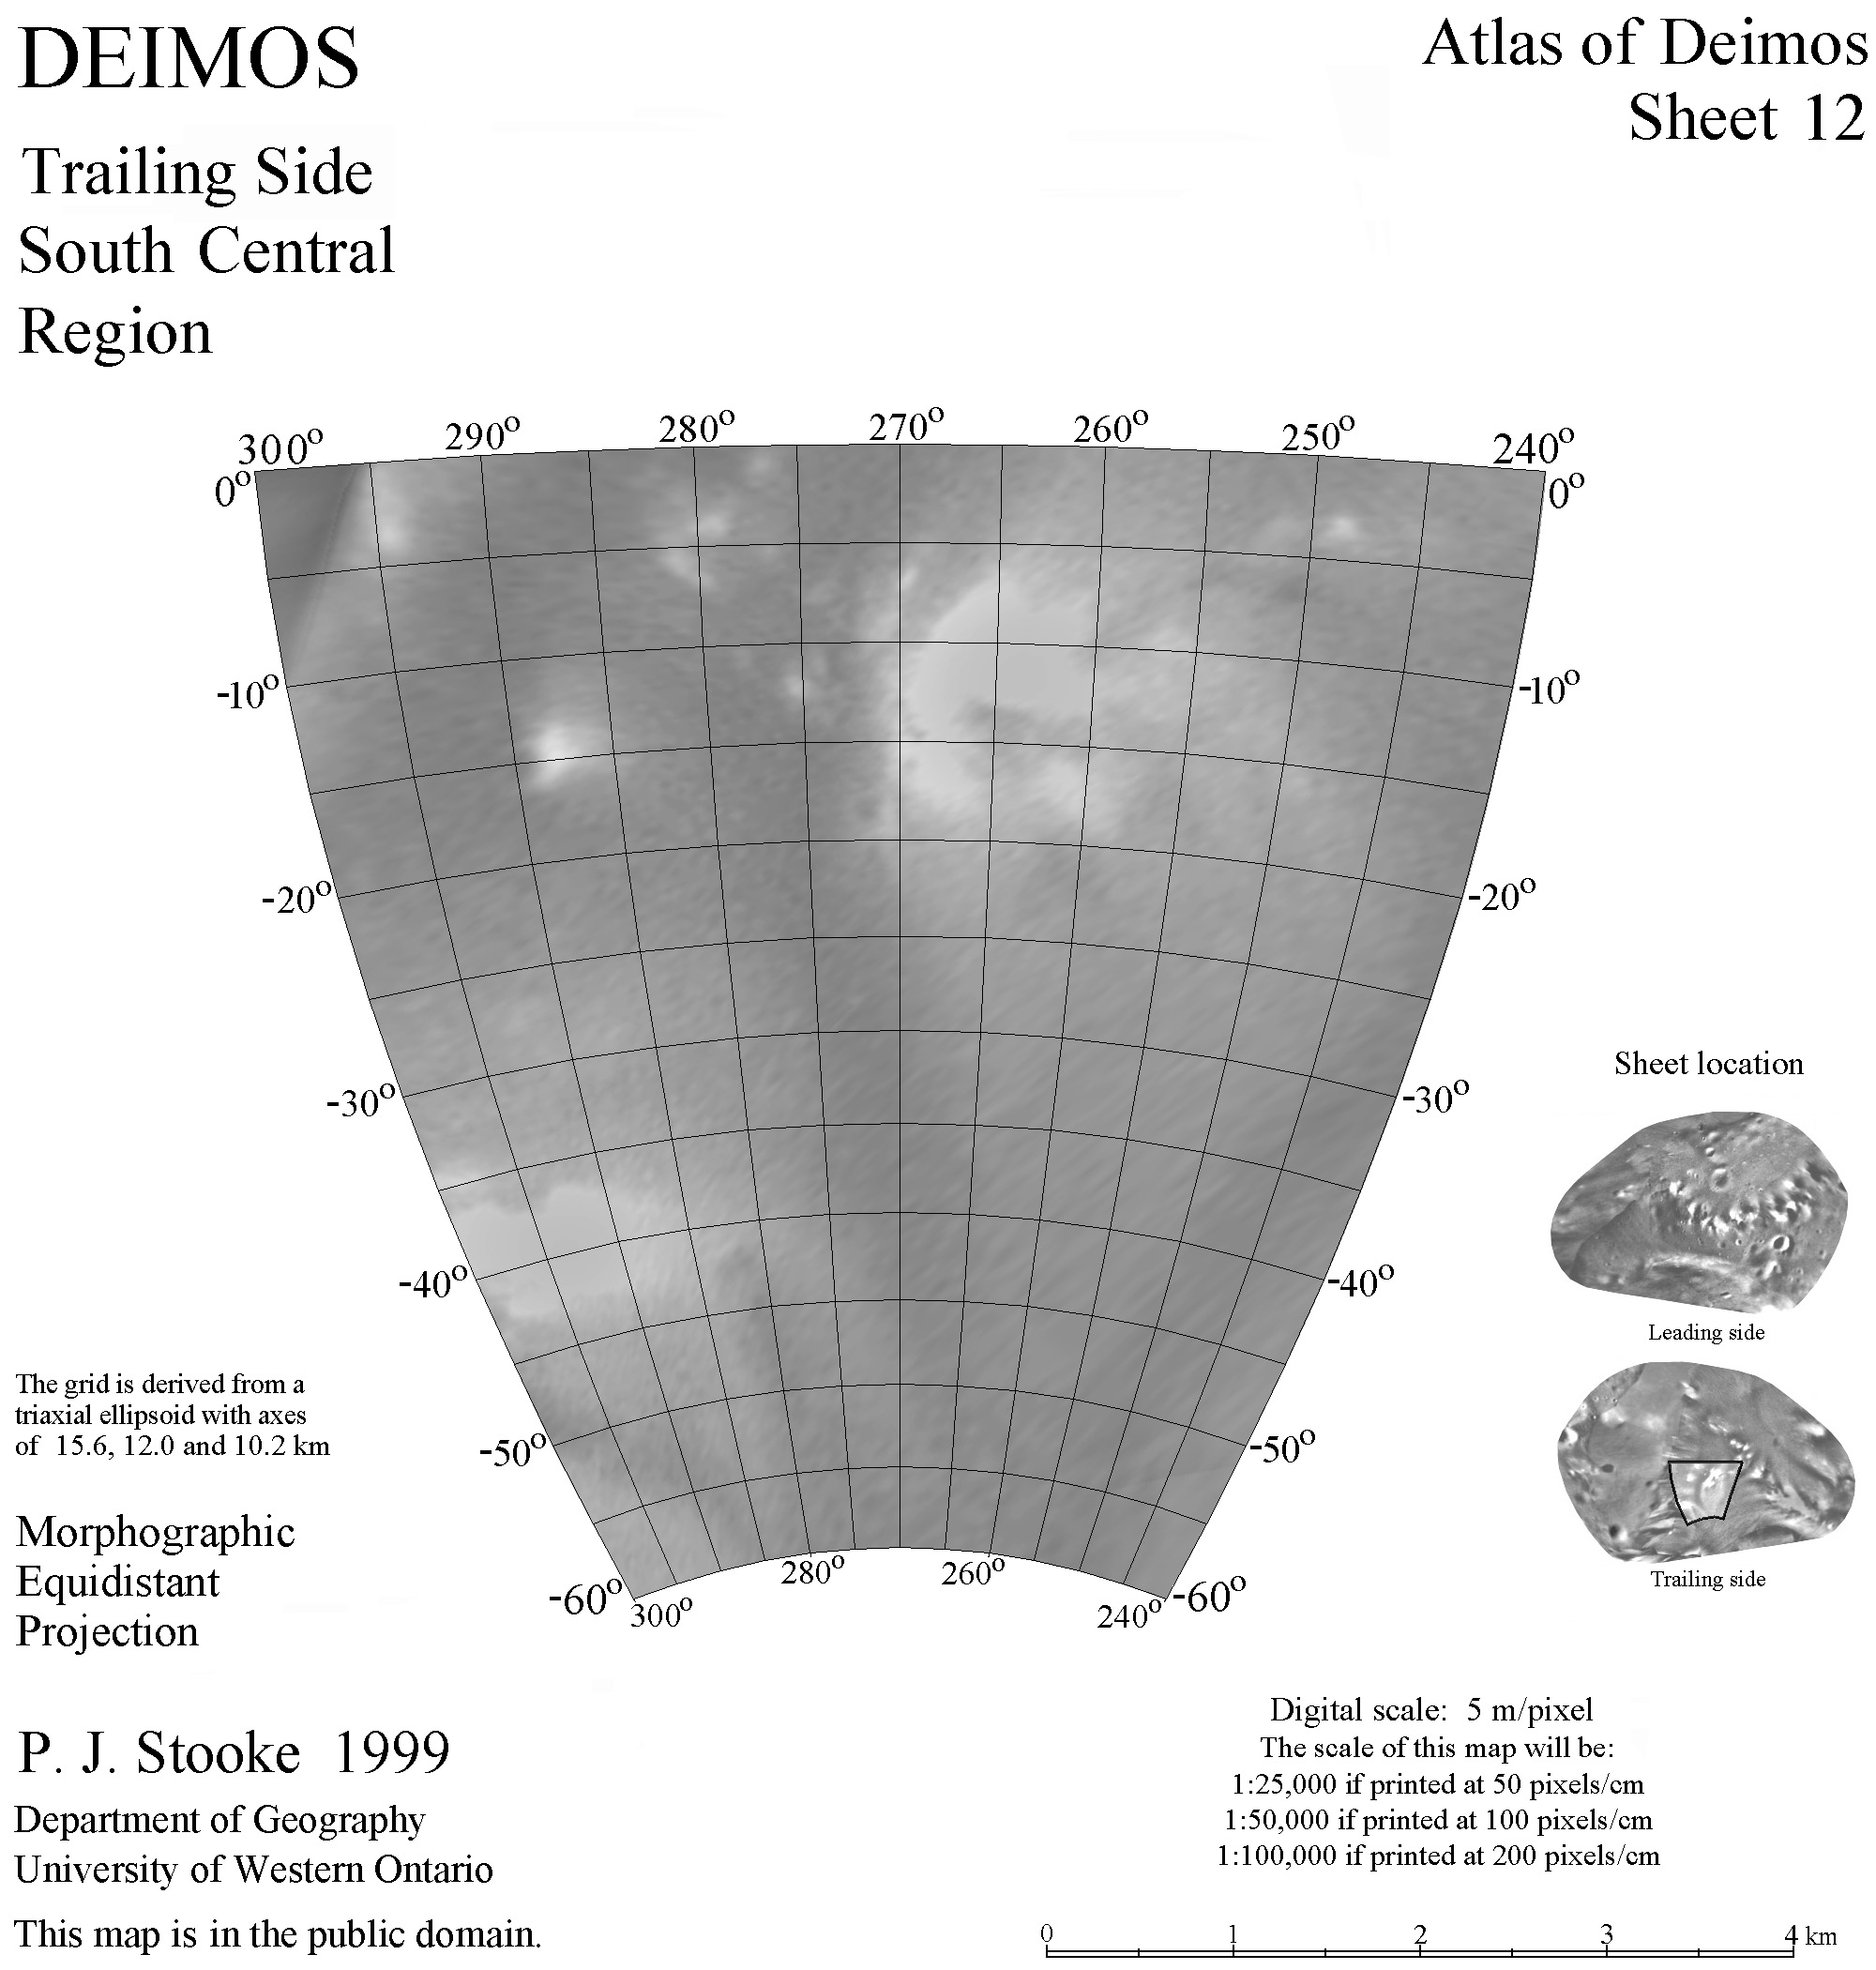
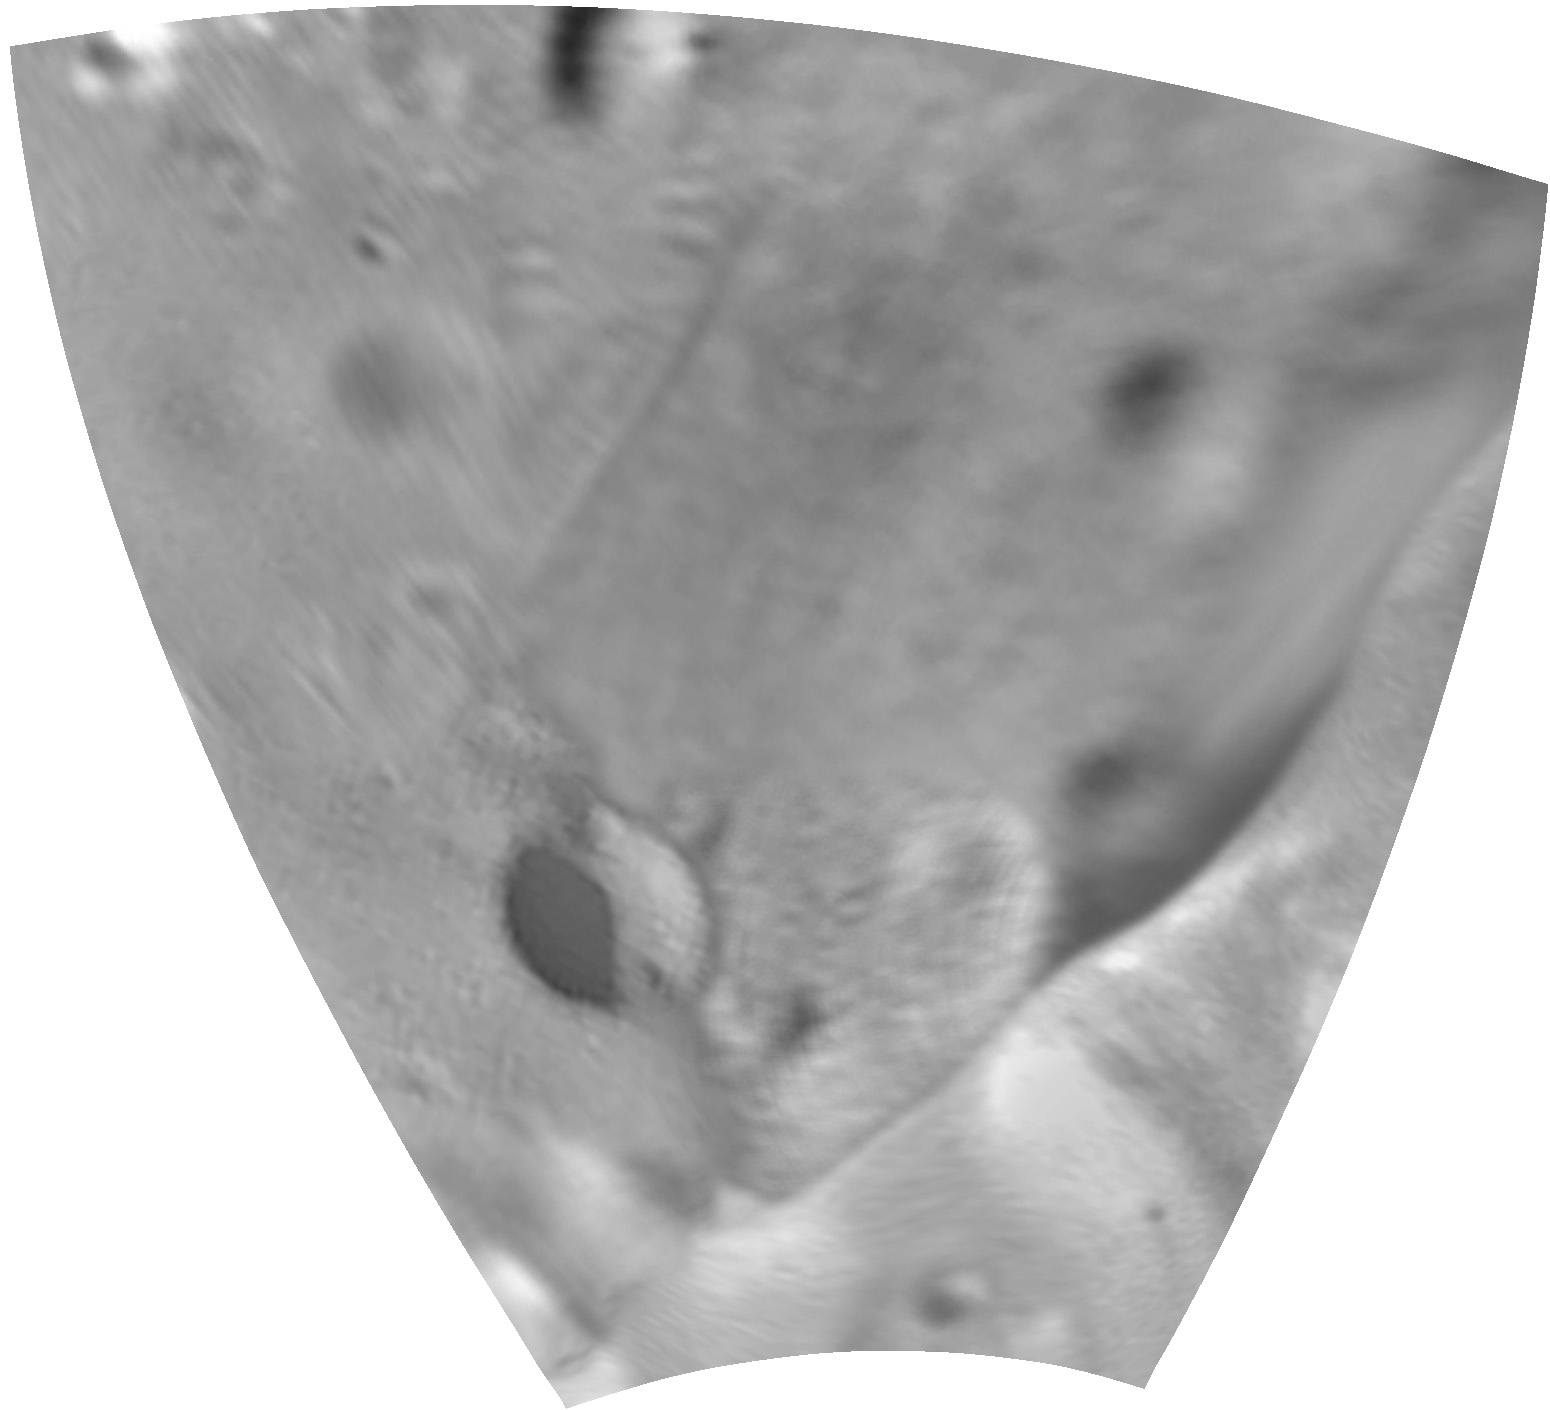
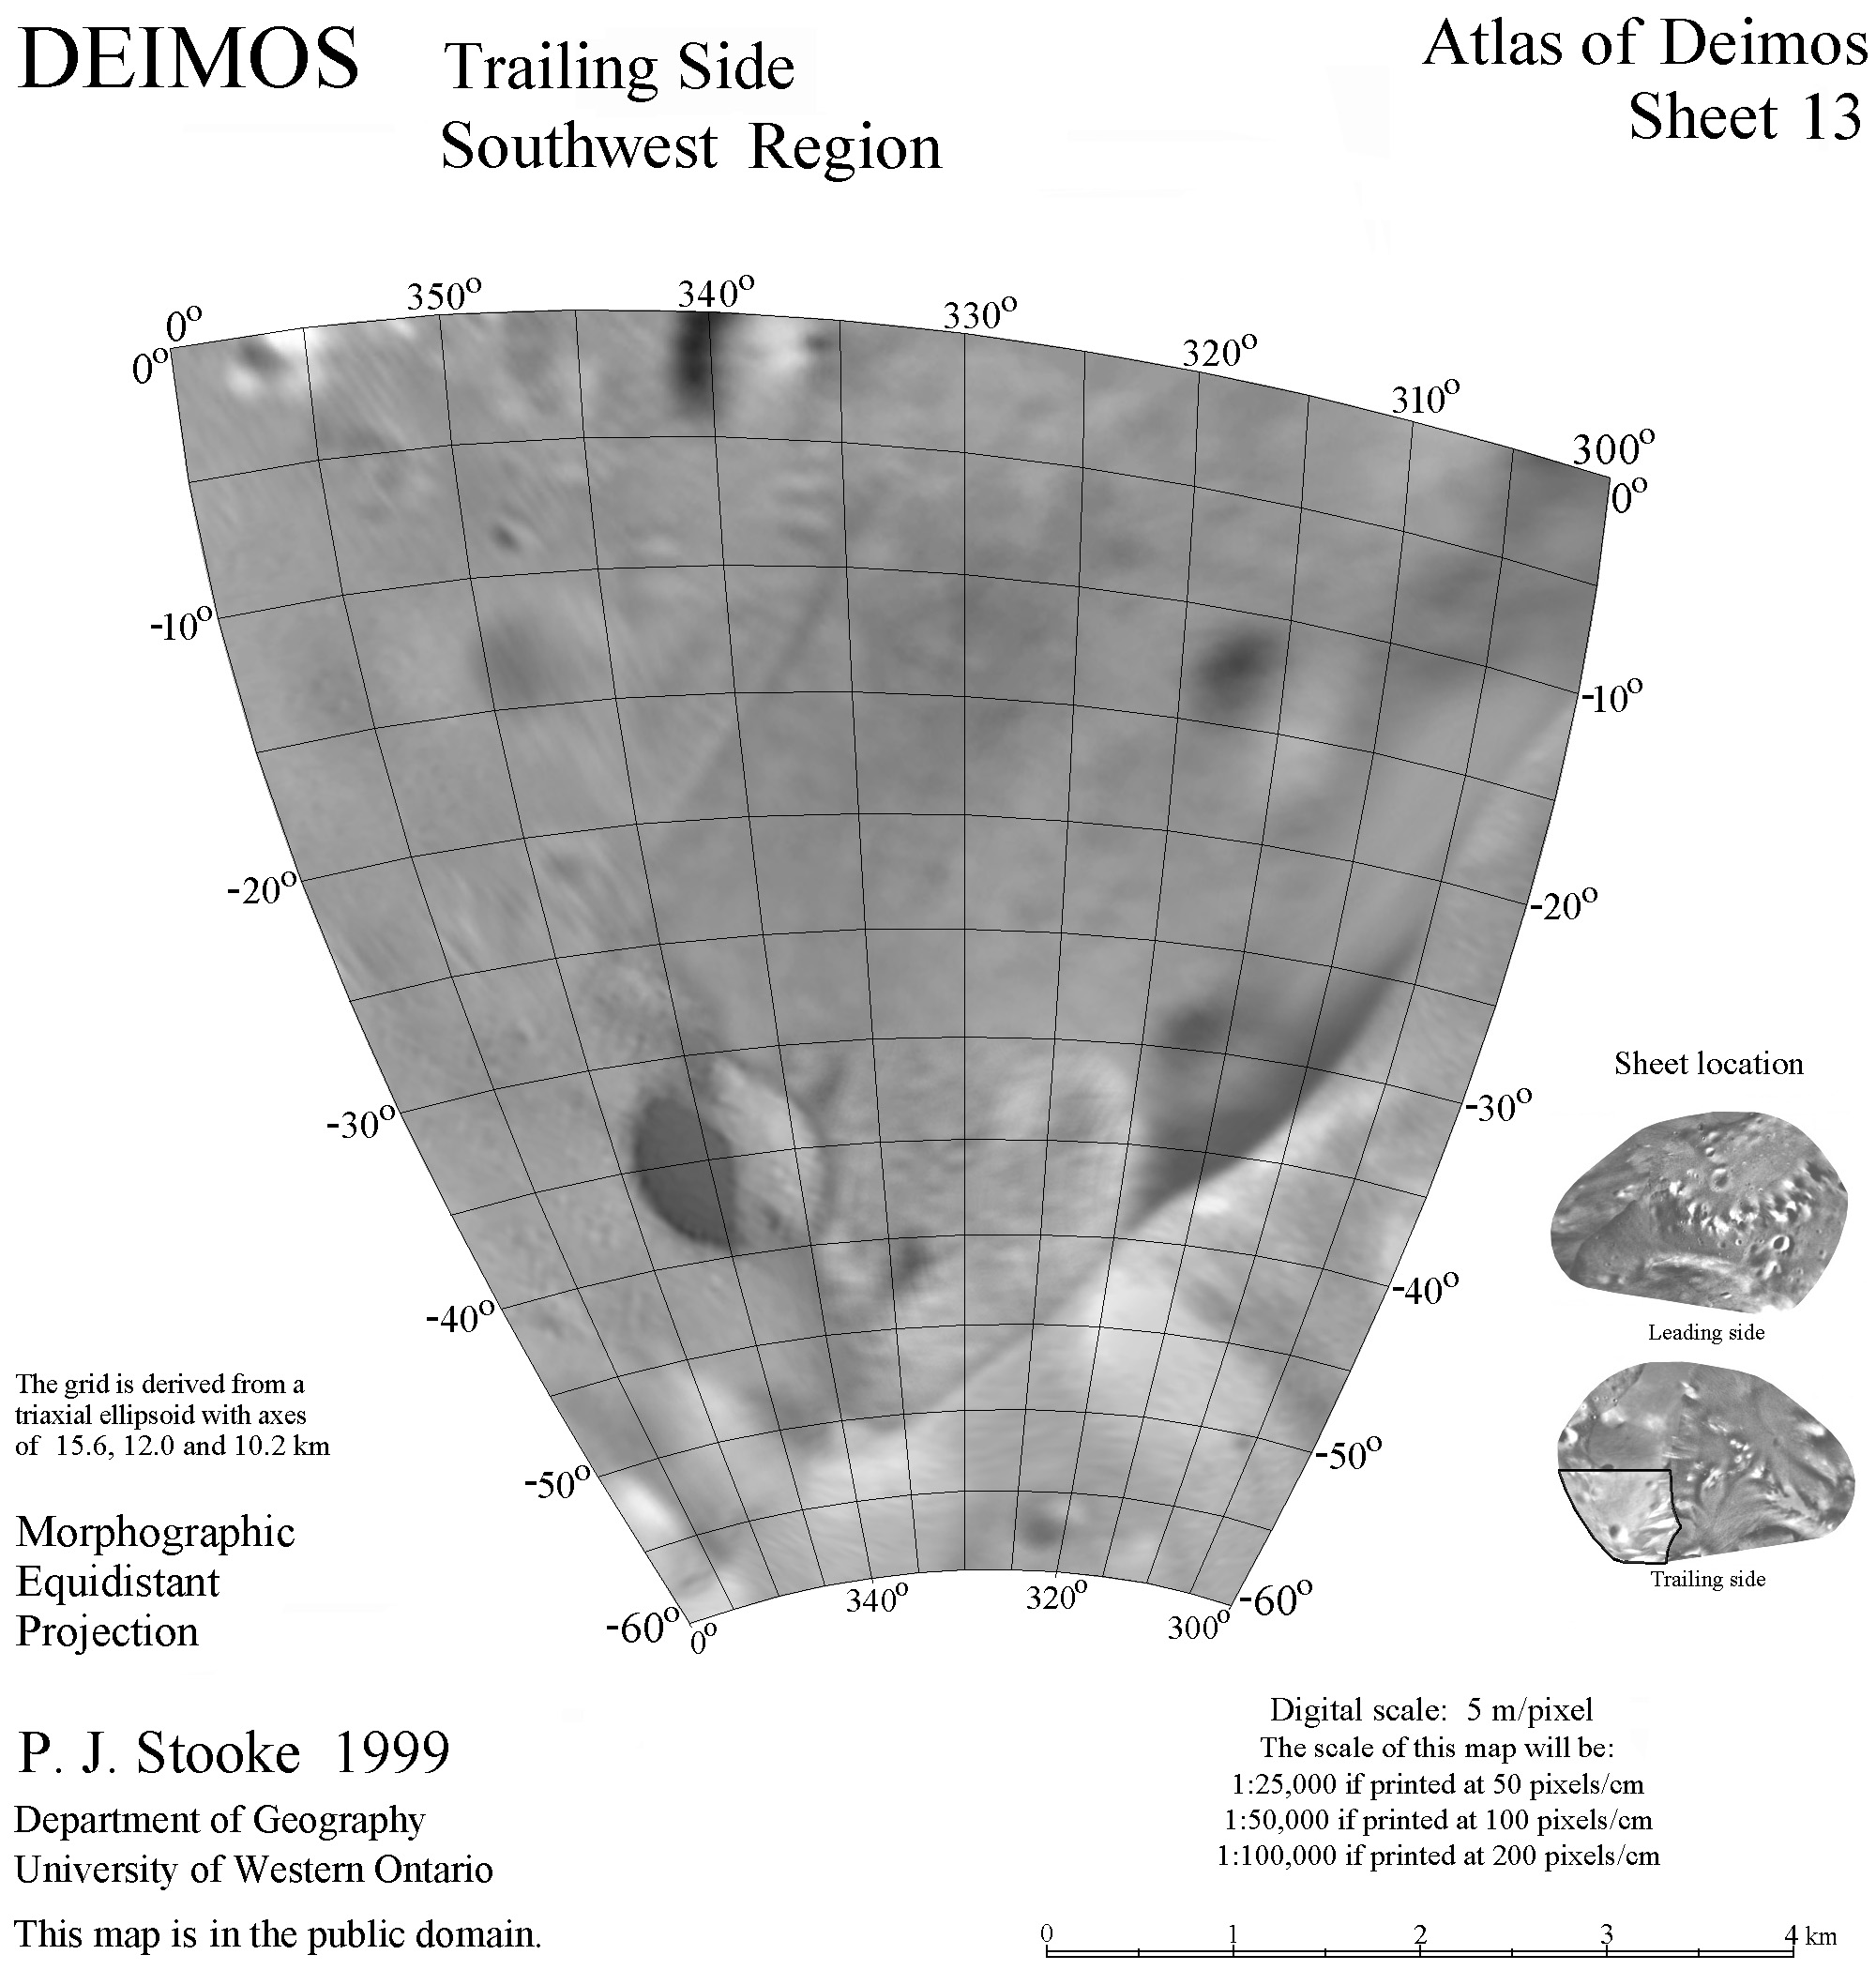
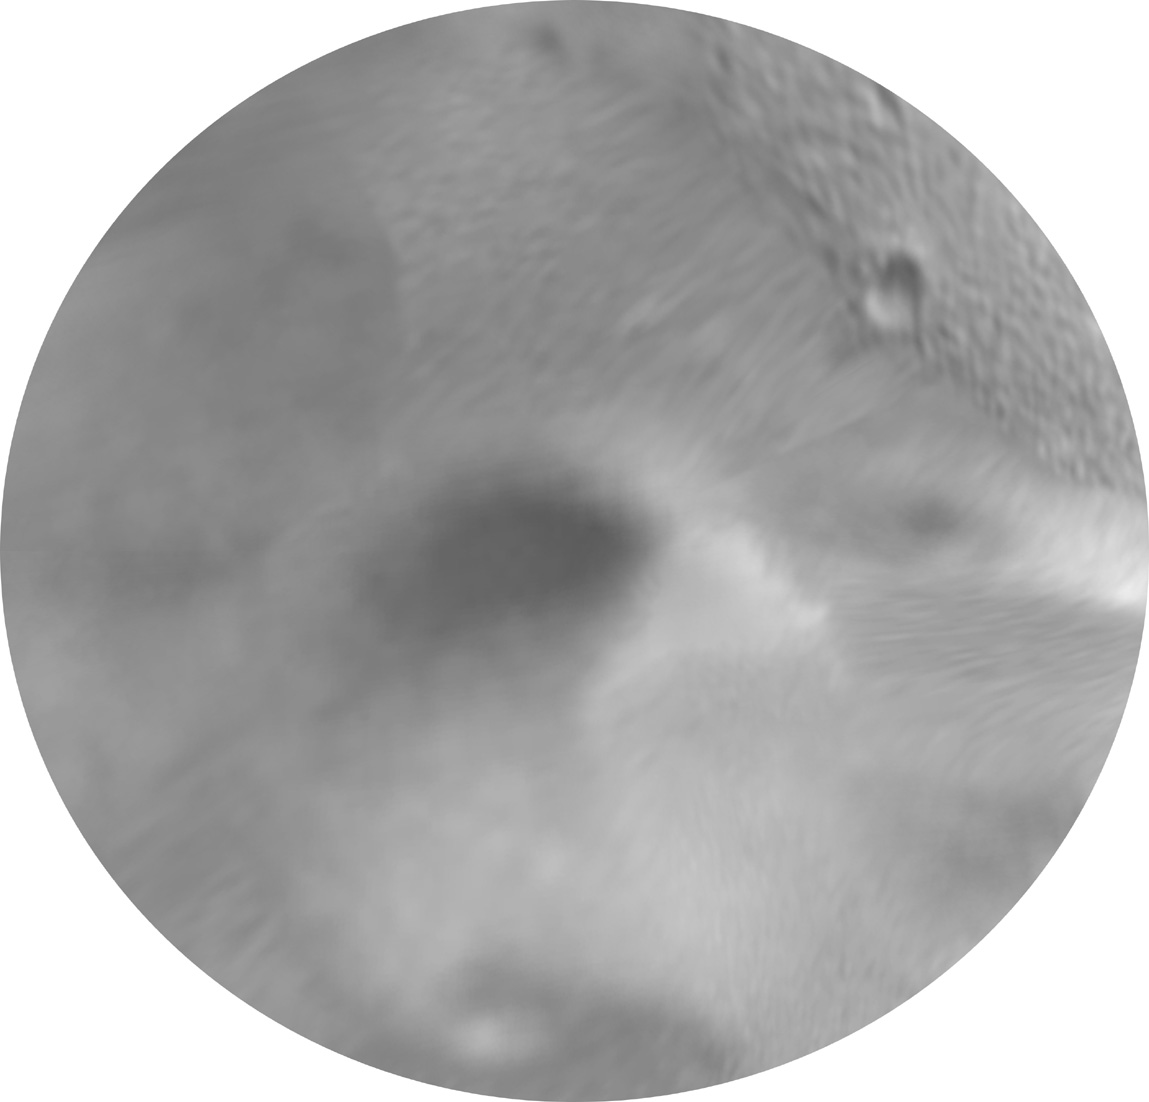
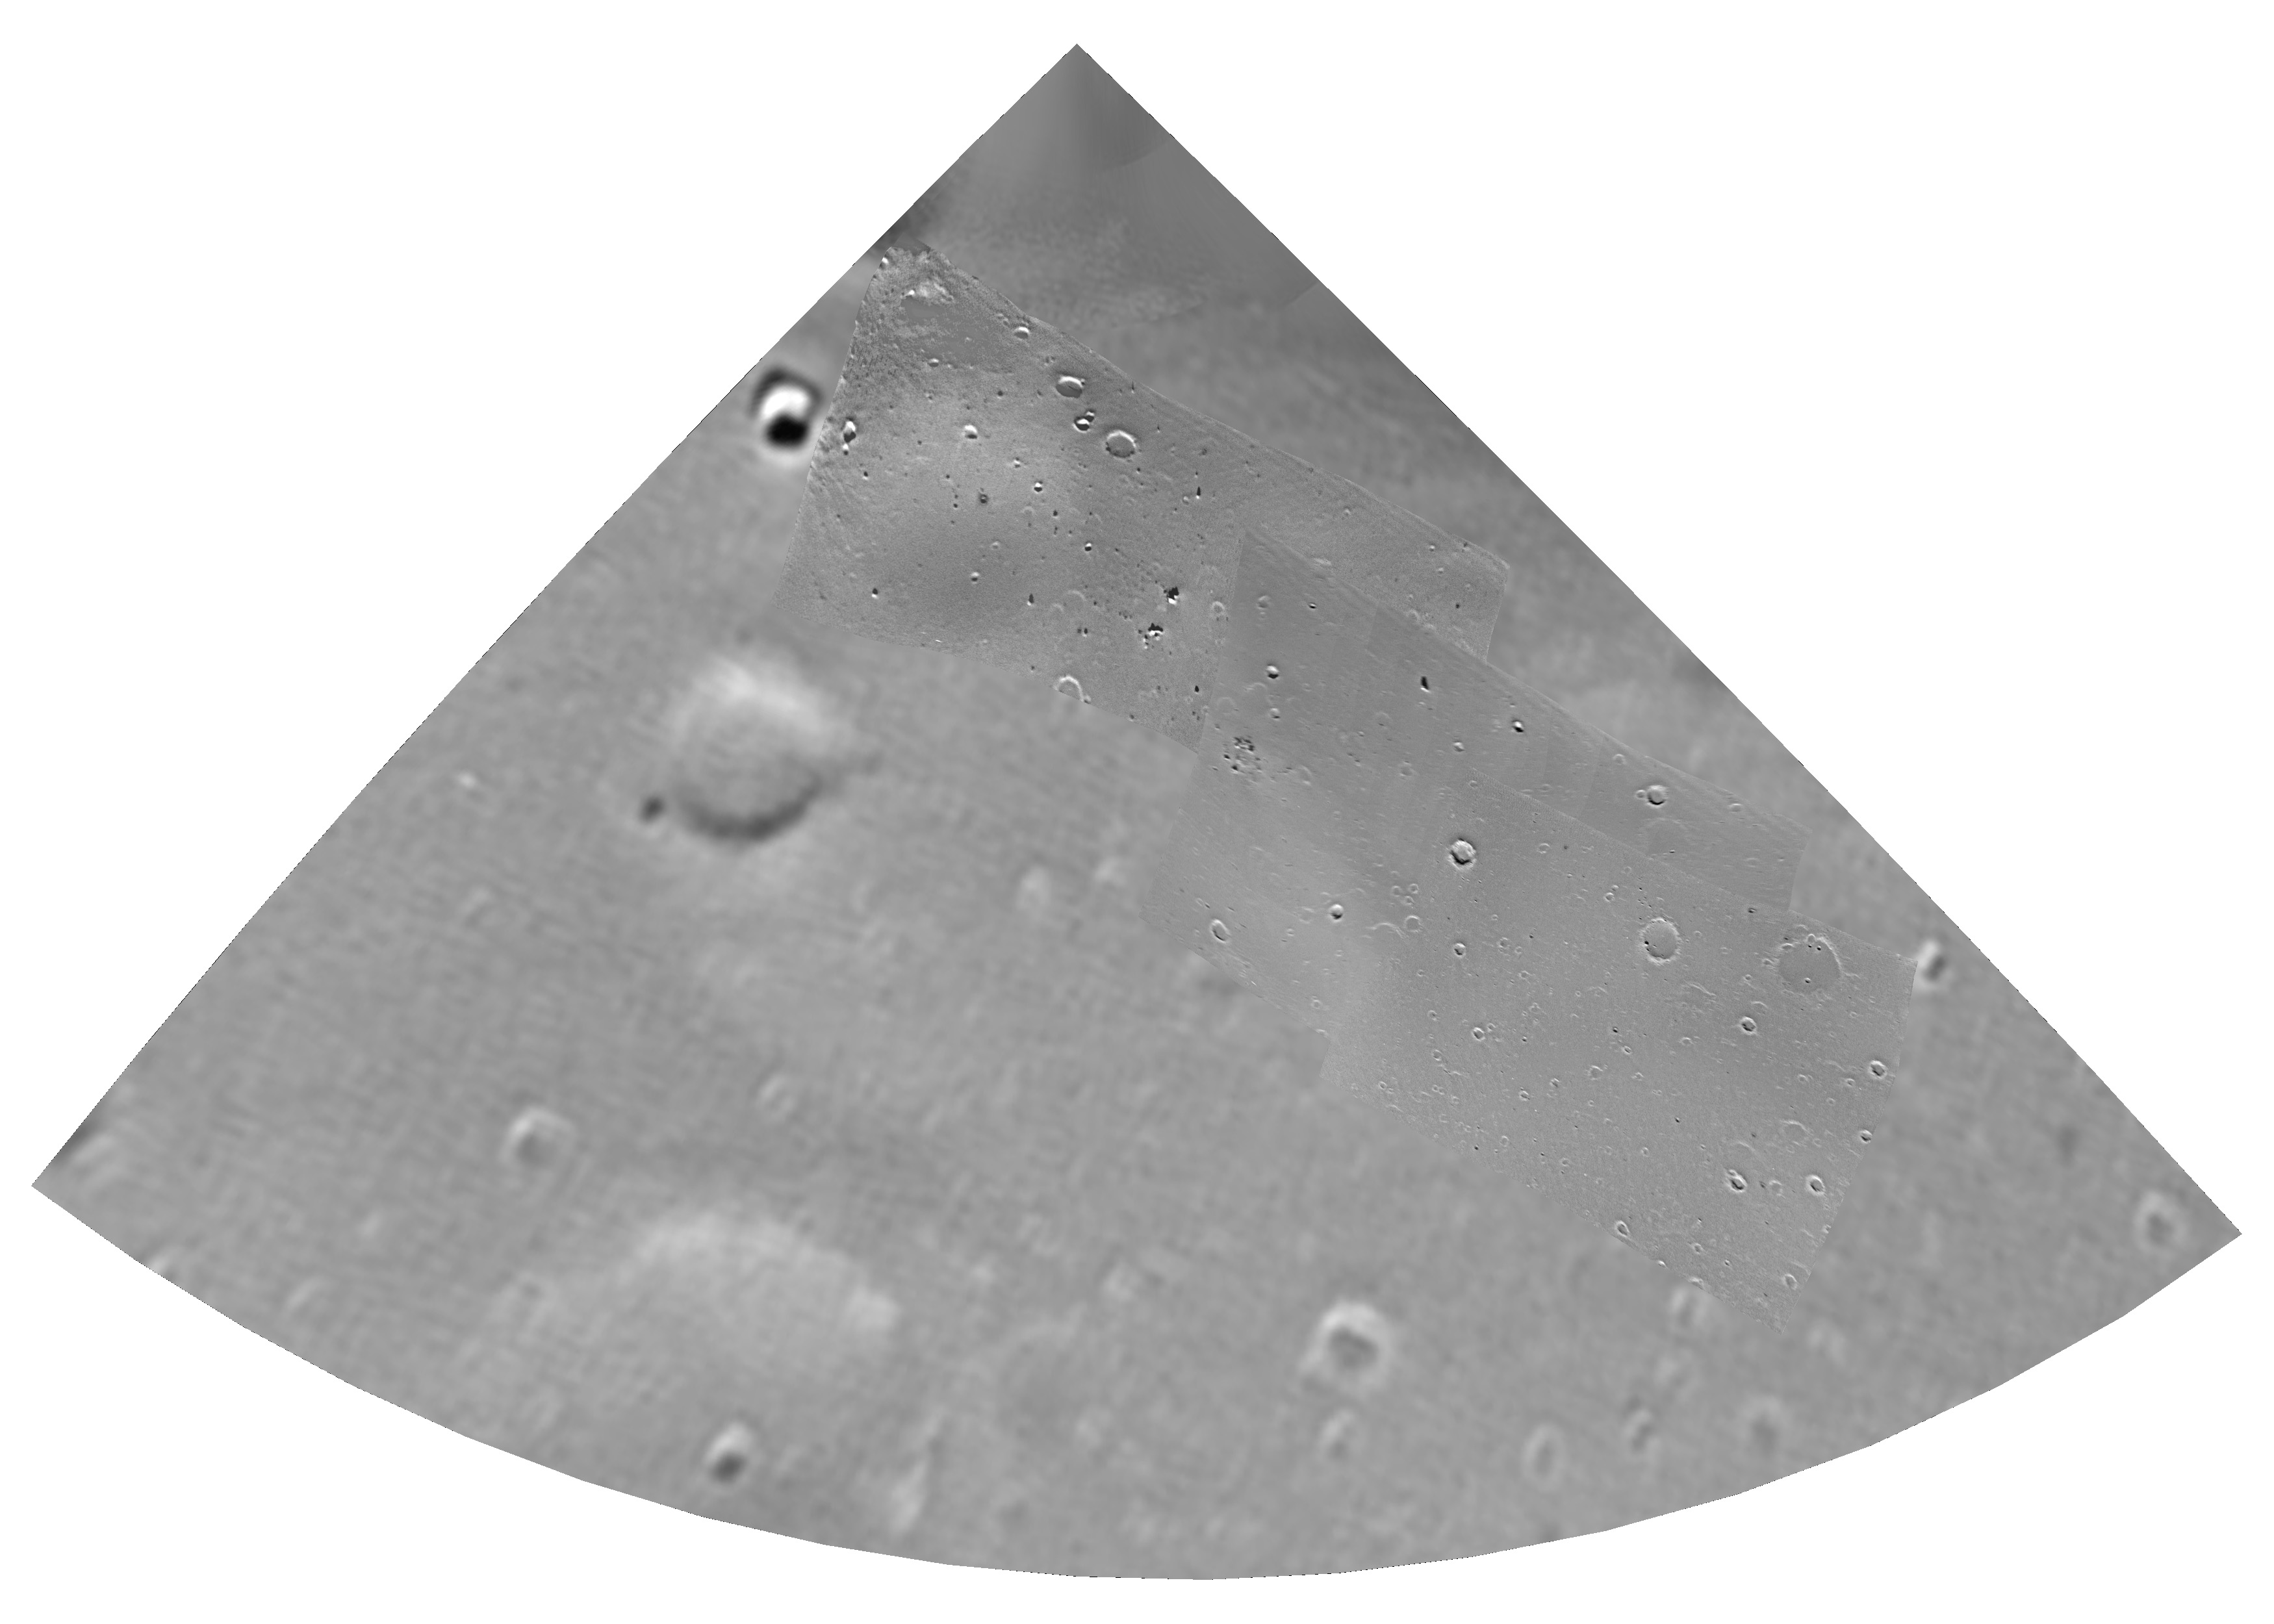
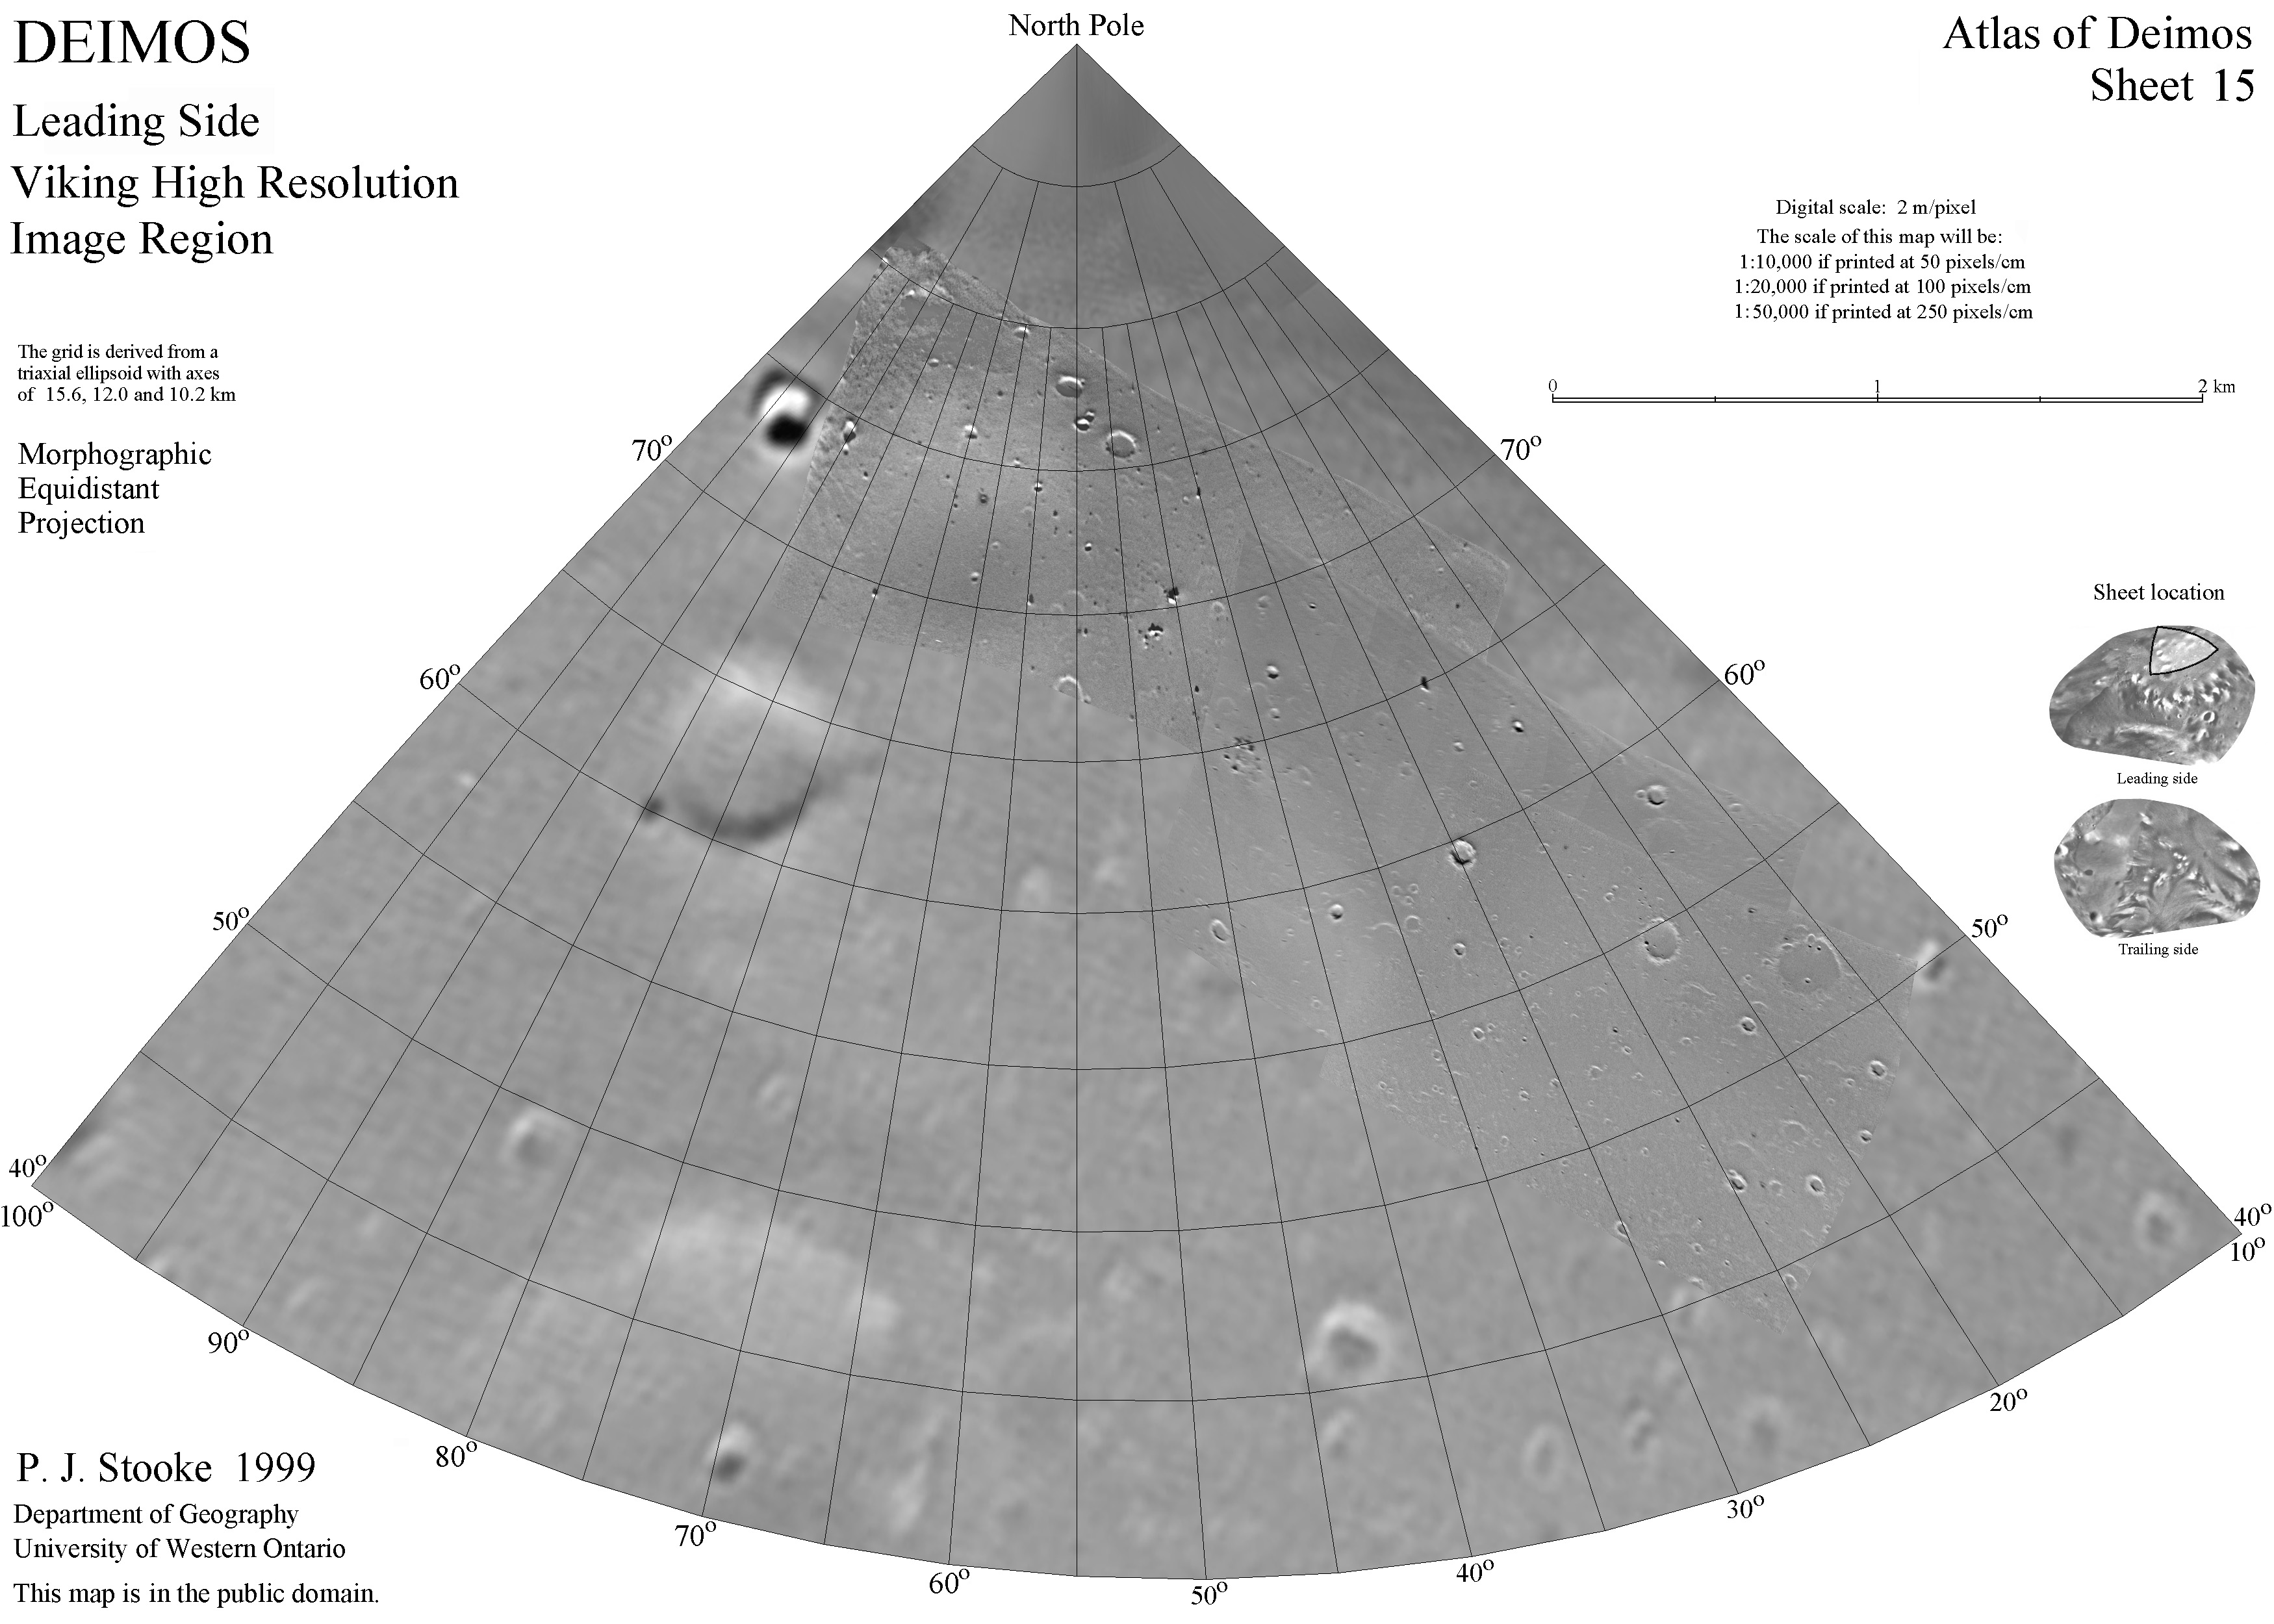
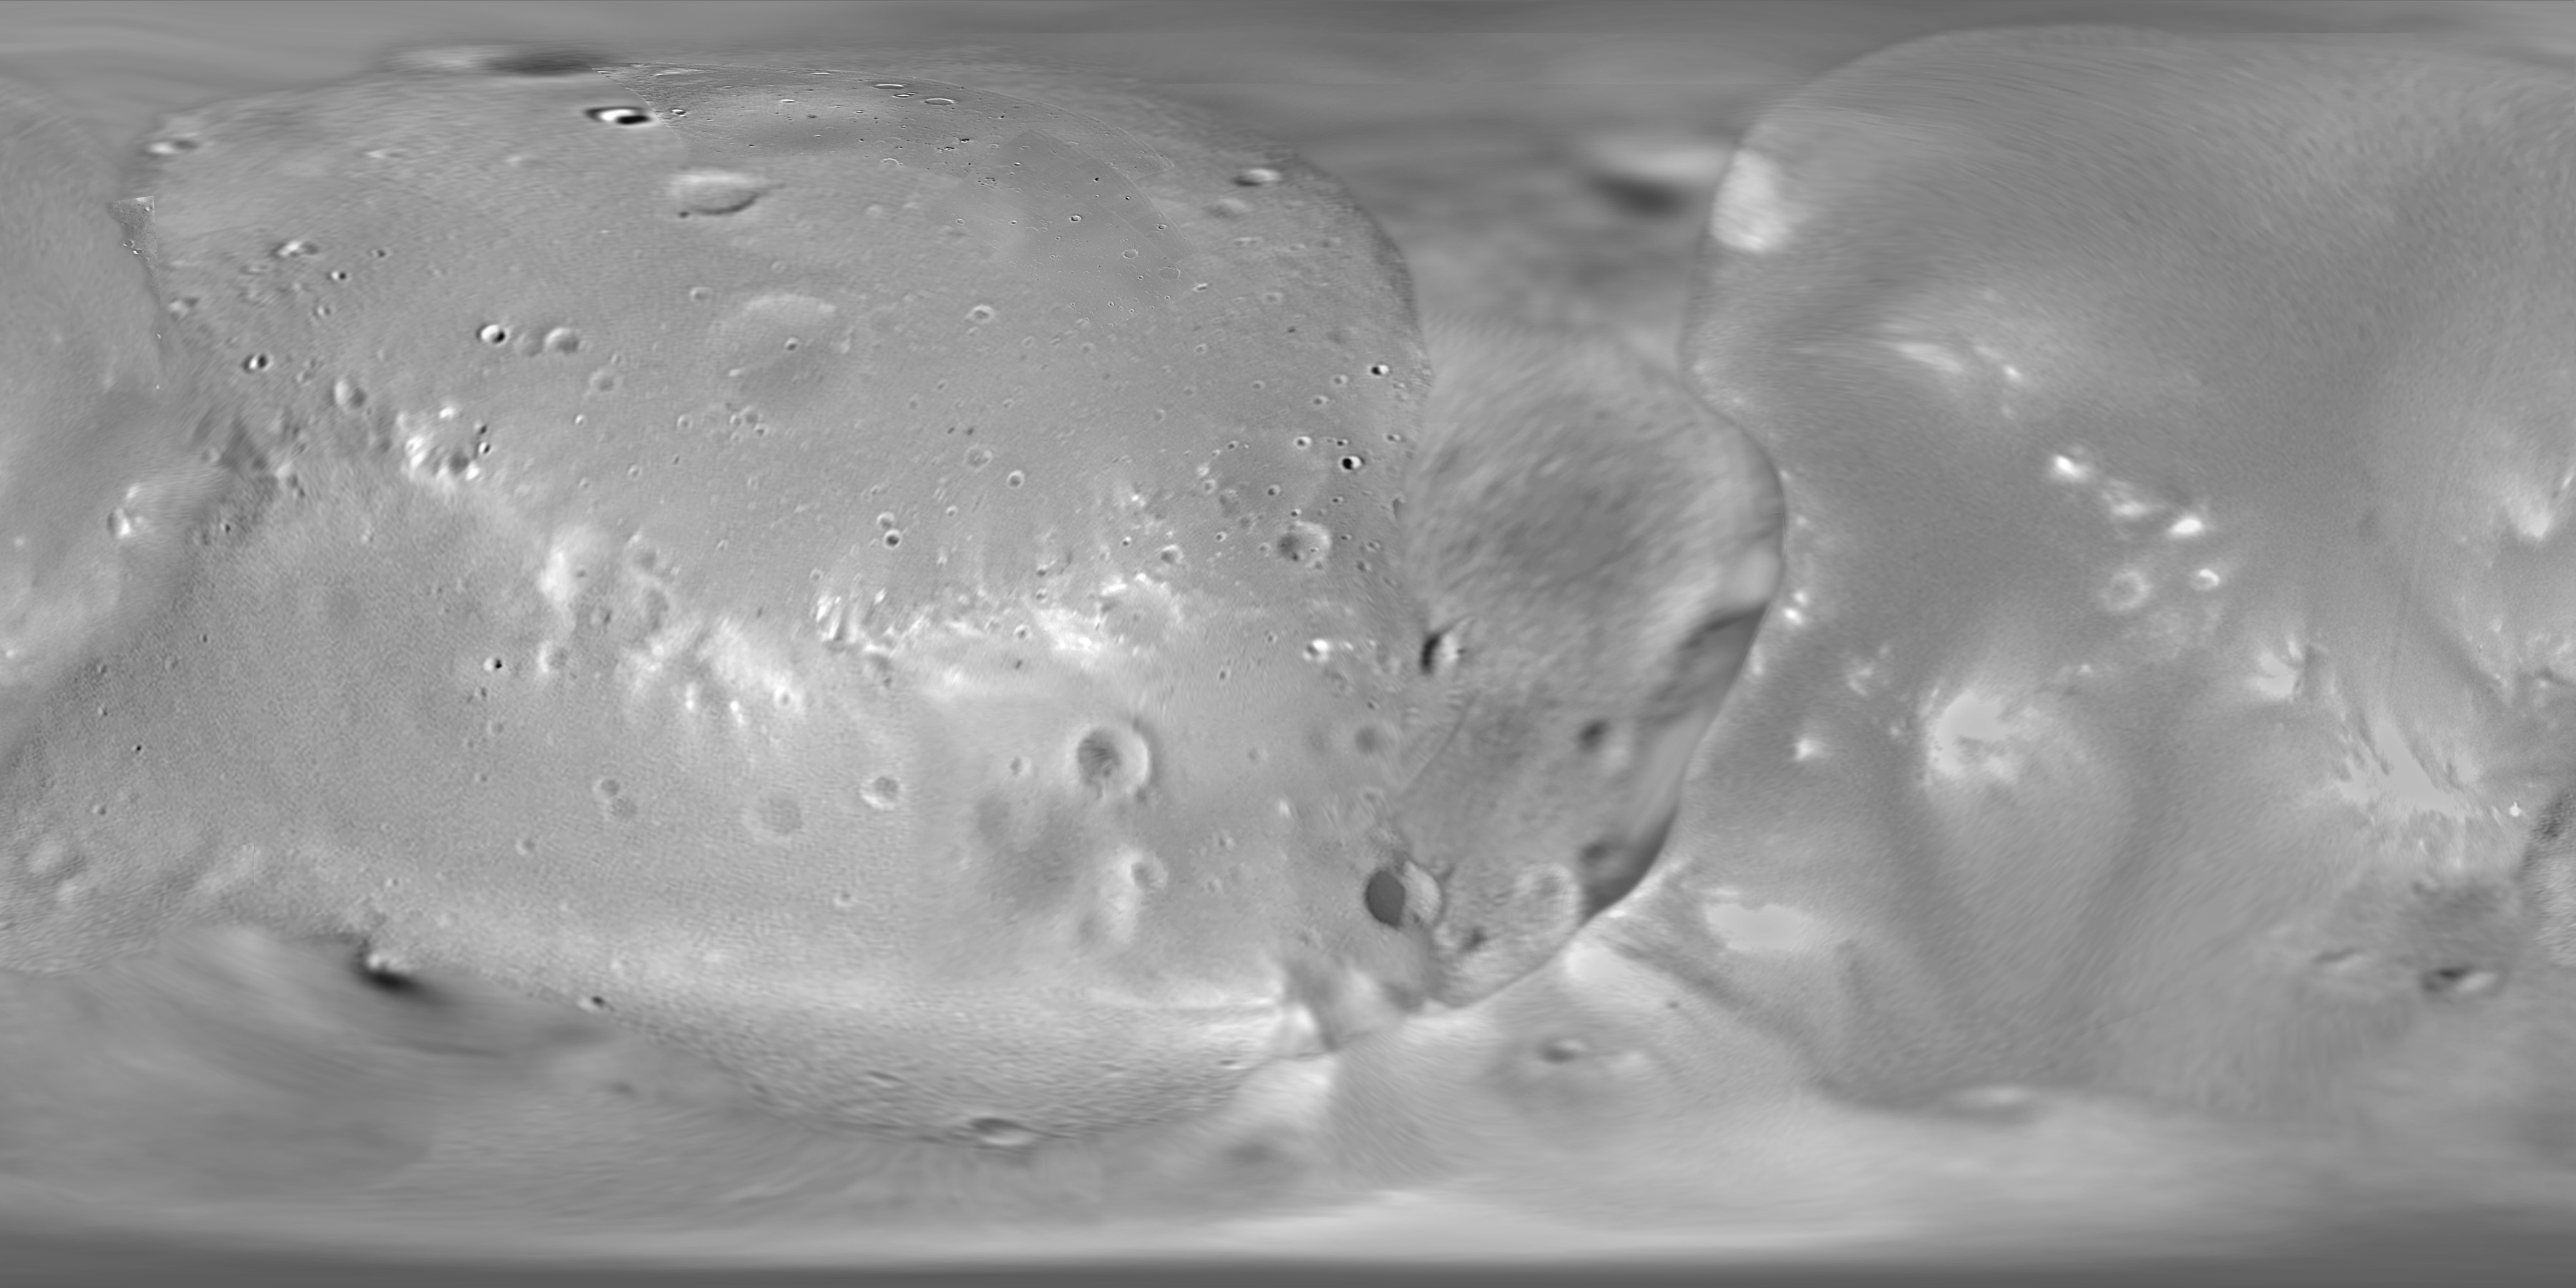
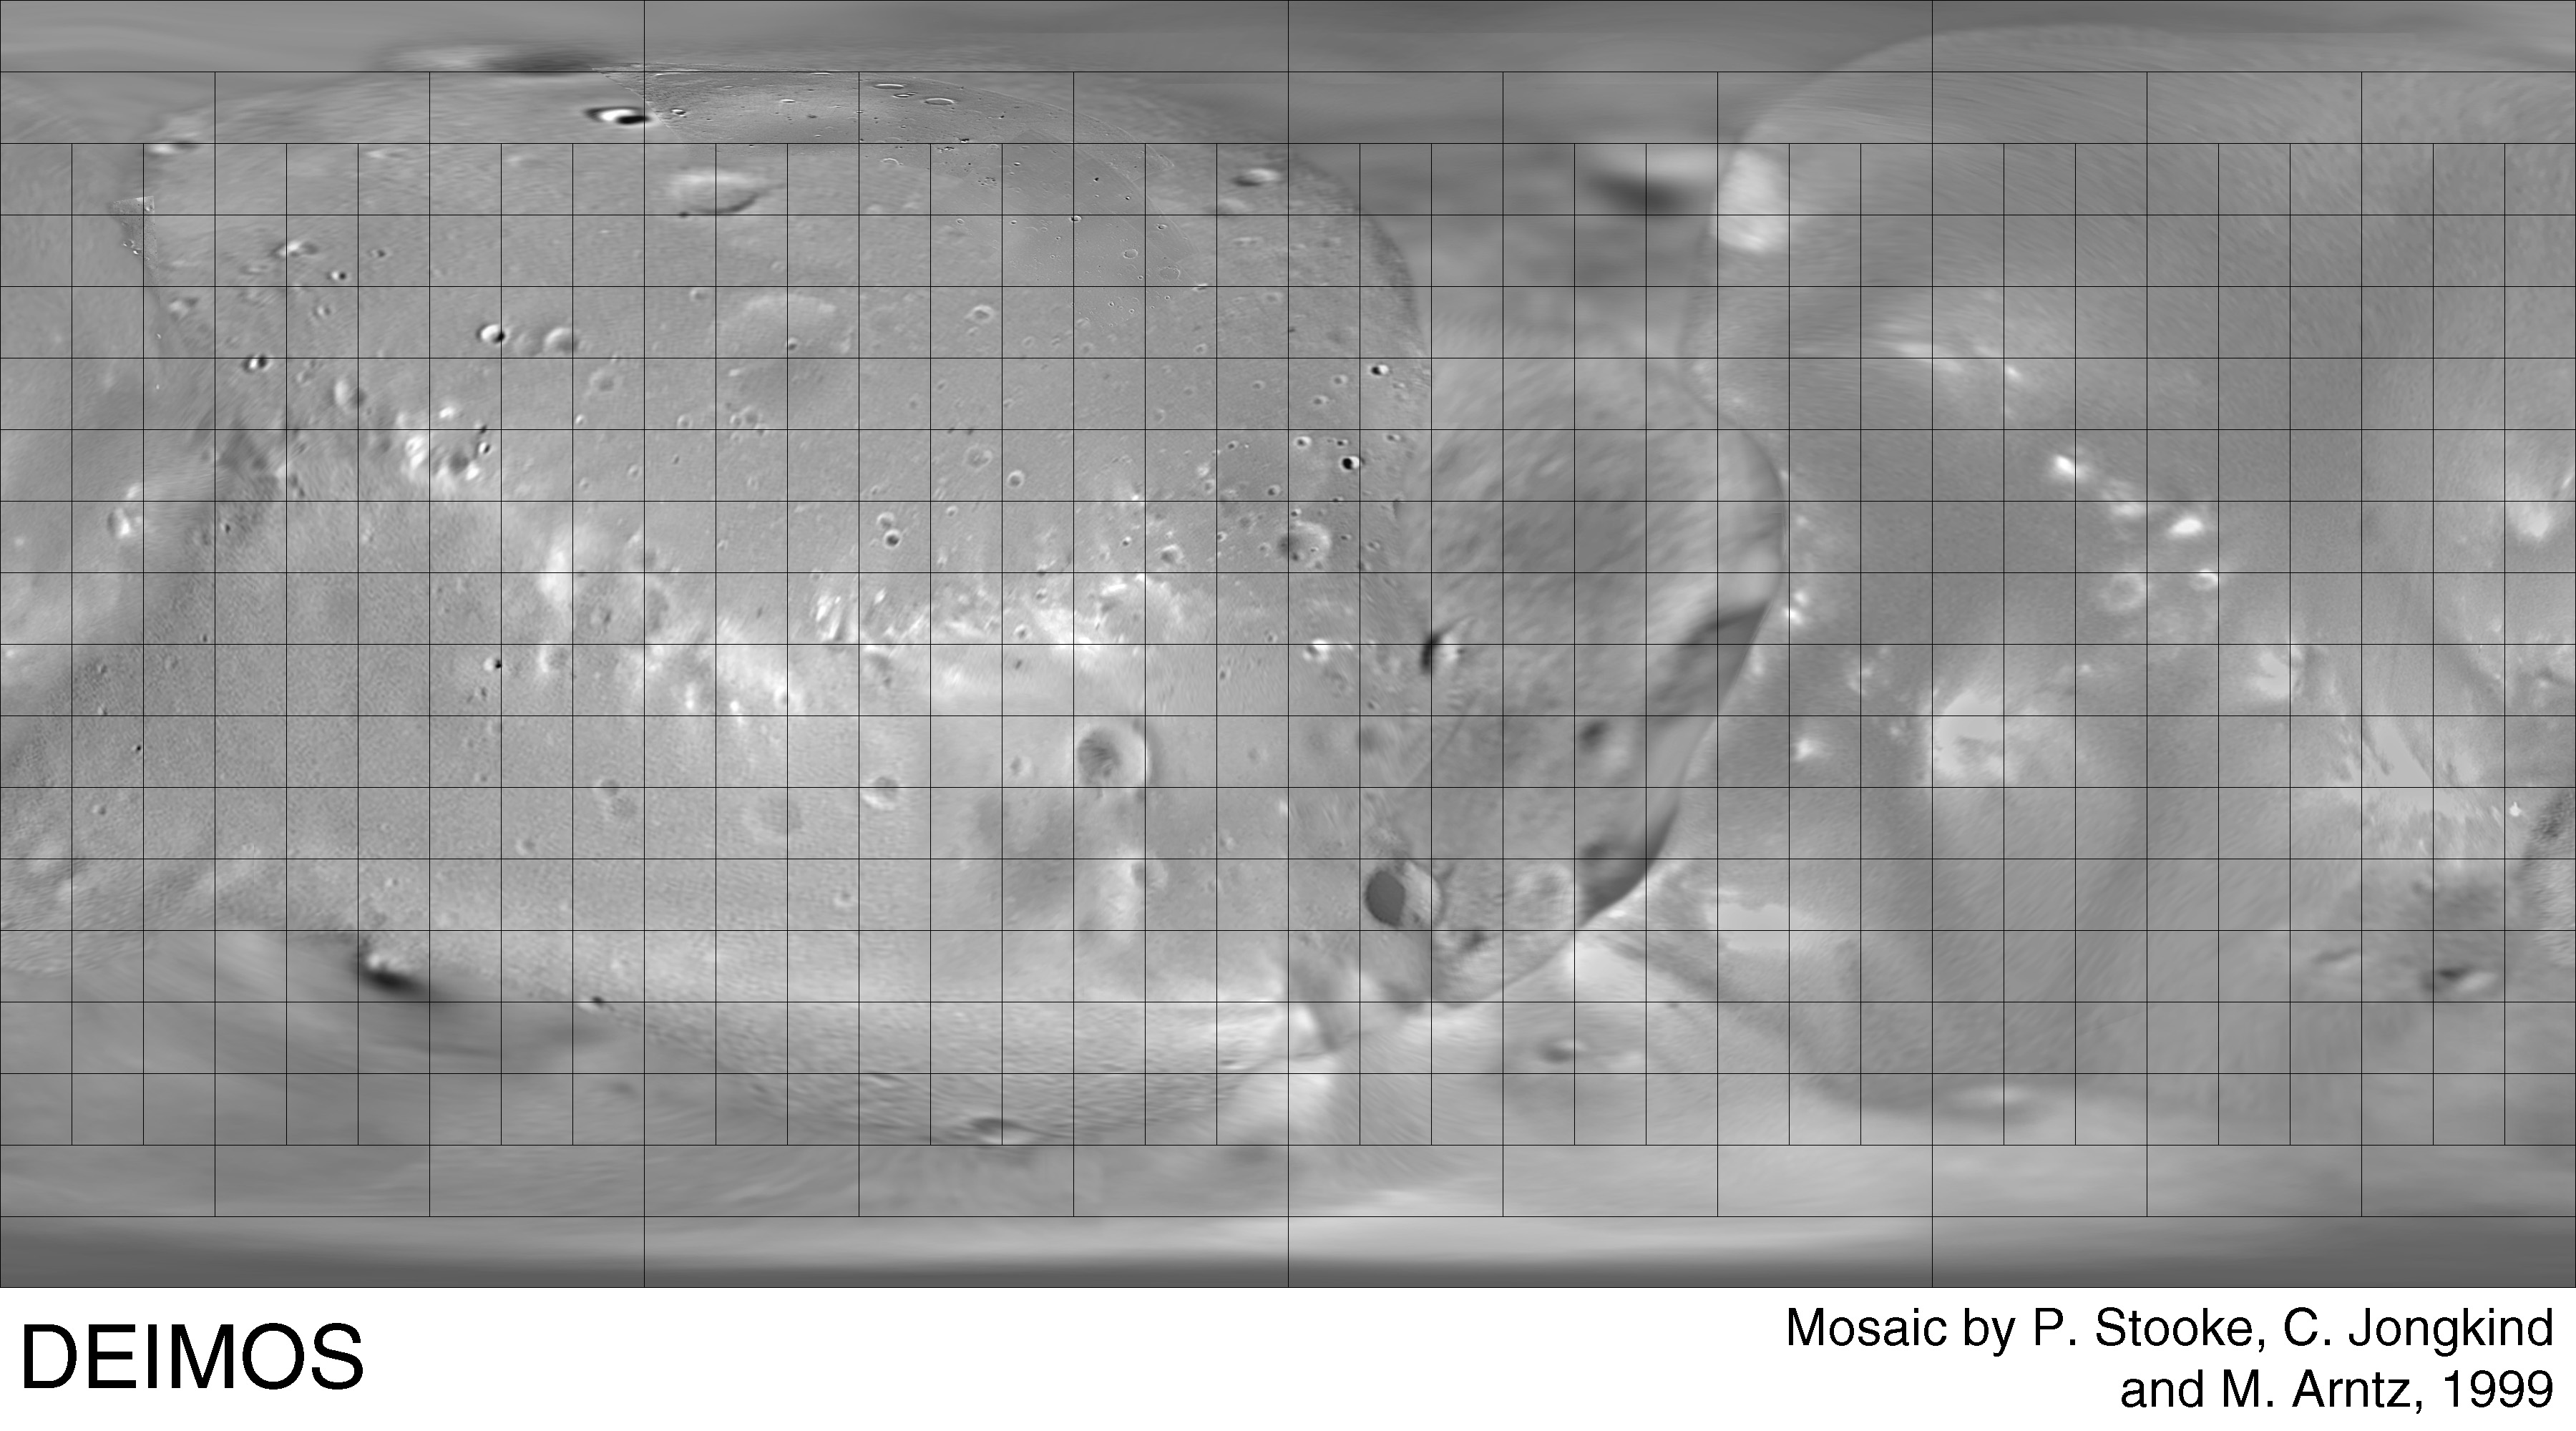
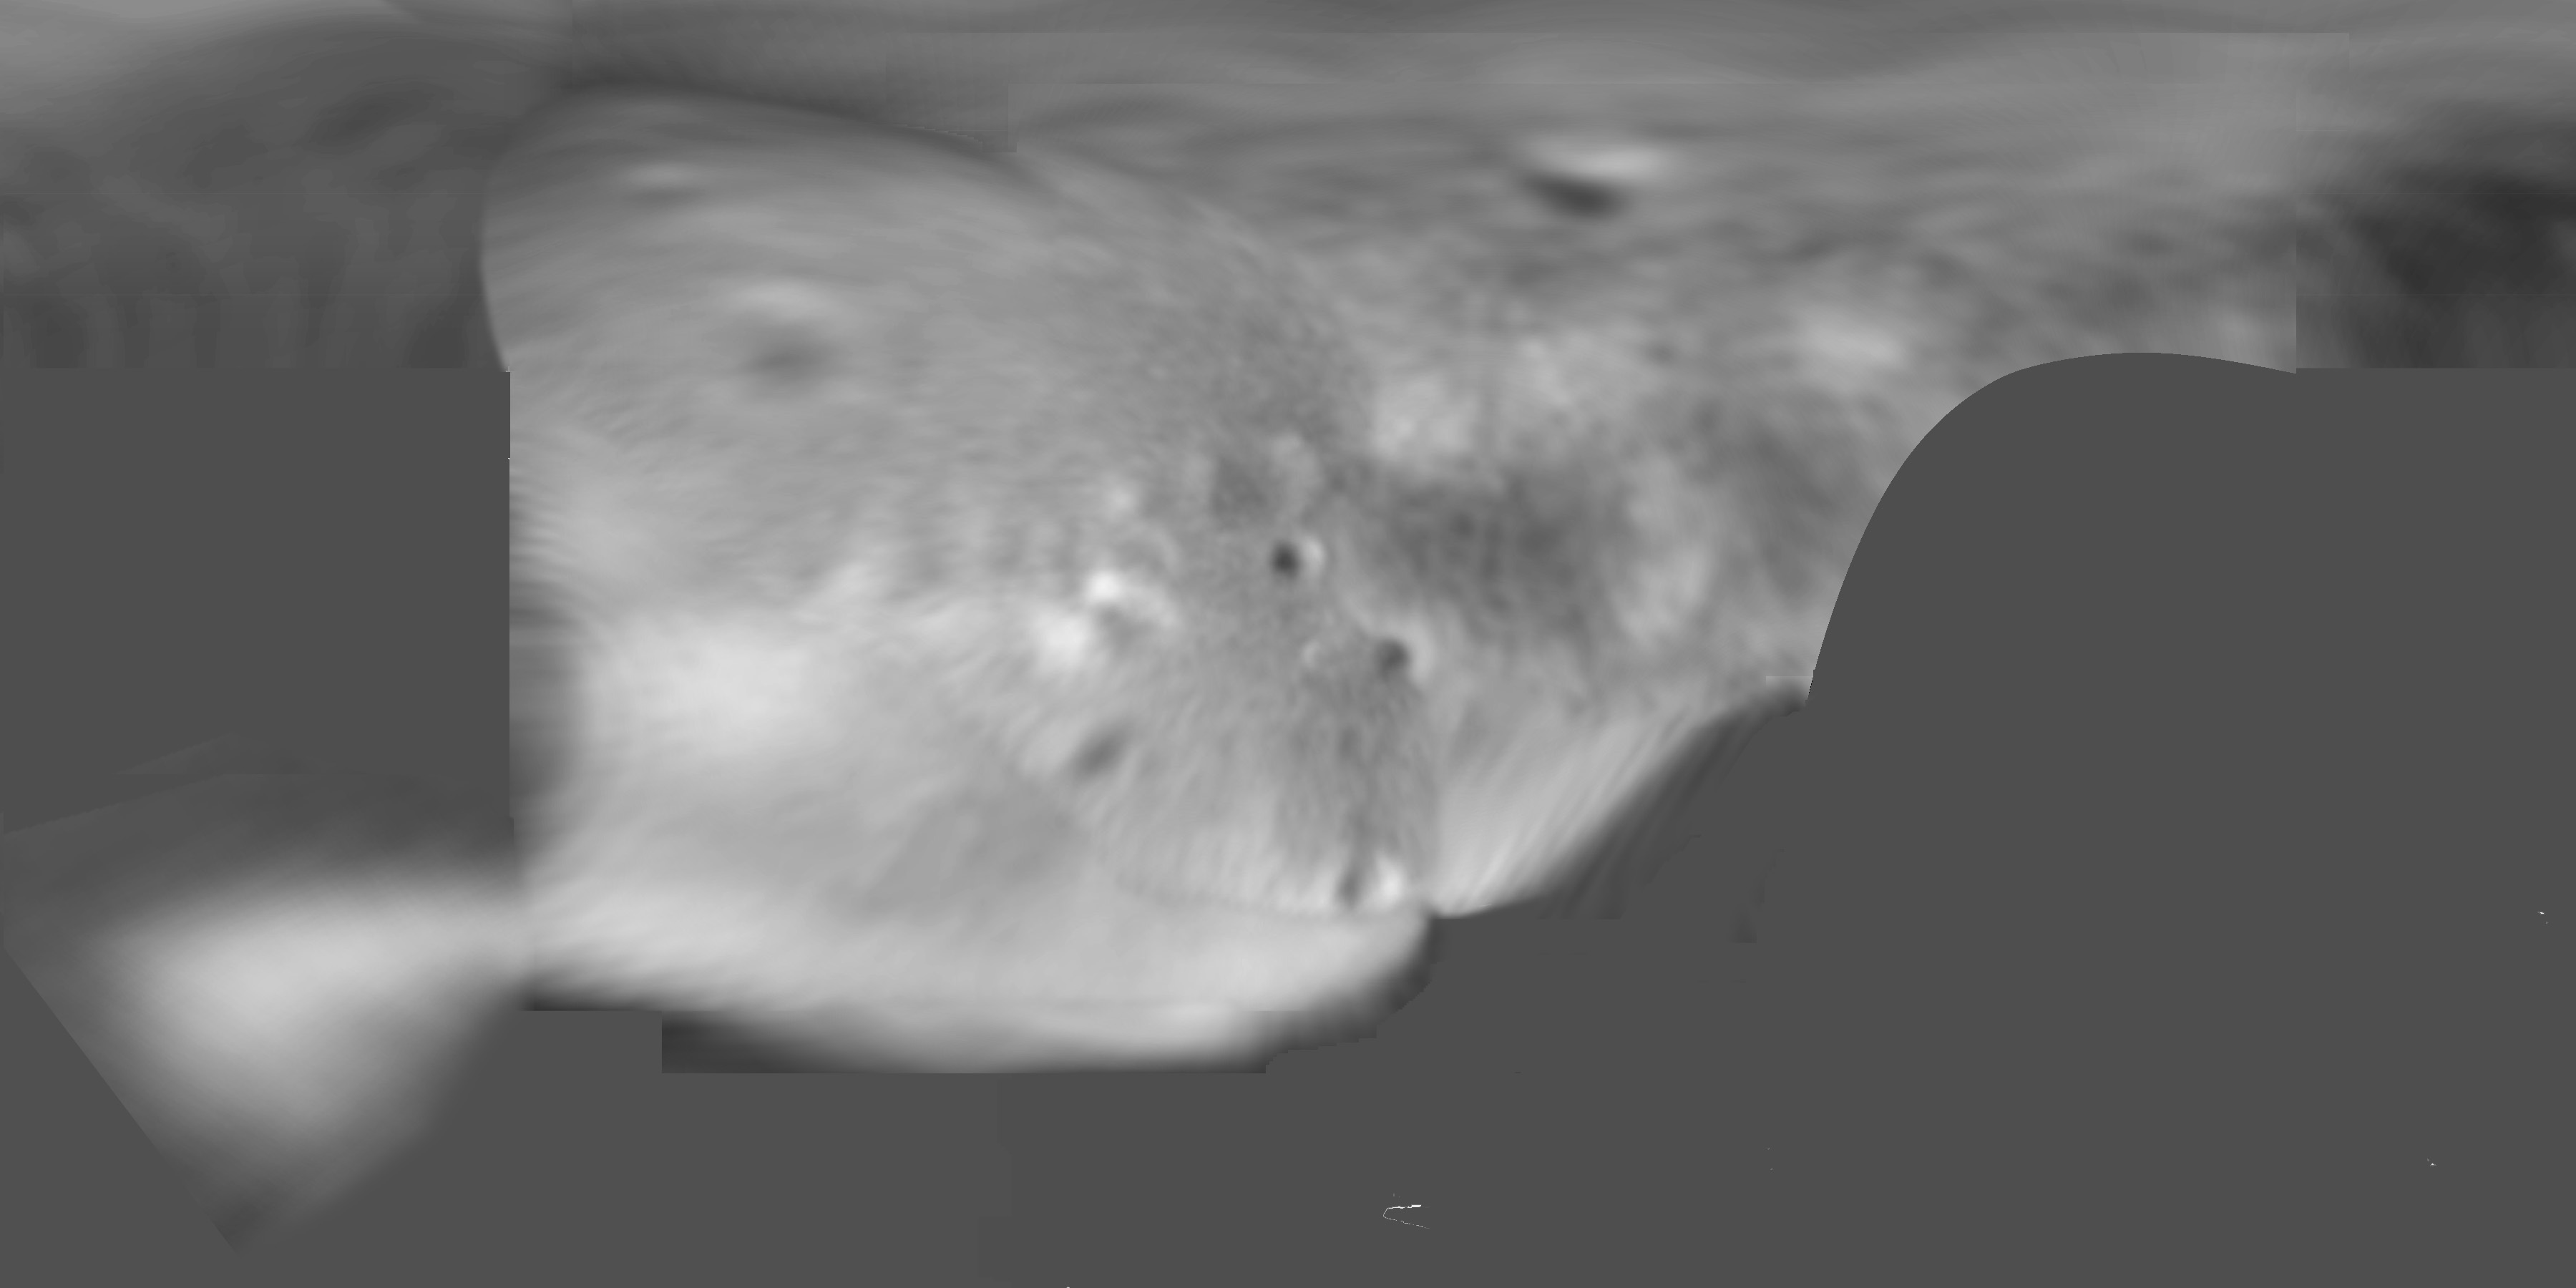
M2 Deimos
A. Photomosaics of Deimos created from the original Viking and Mariner 9
images by Philip Stooke with the assistance of Chris Jongkind and
Megan Arntz. Control is based on a shape model and mosaic by Peter Thomas
and colleagues at Cornell University, to whom the author is very grateful
for permission to use them. The photomosaic was compiled on a Simple
Cylindrical Projection, then reprojected to a map projection designed for
use with non-spherical bodies. The map grids are derived from a best-fit
triaxial ellipsoid whose dimensions are given on each map.
These maps cover all of Deimos in 14 sheets, each 60 degrees by 60 degrees,
sheet limits shown on labelled and gridded versions. The fifteenth sheet
covers a special high-resolution area.
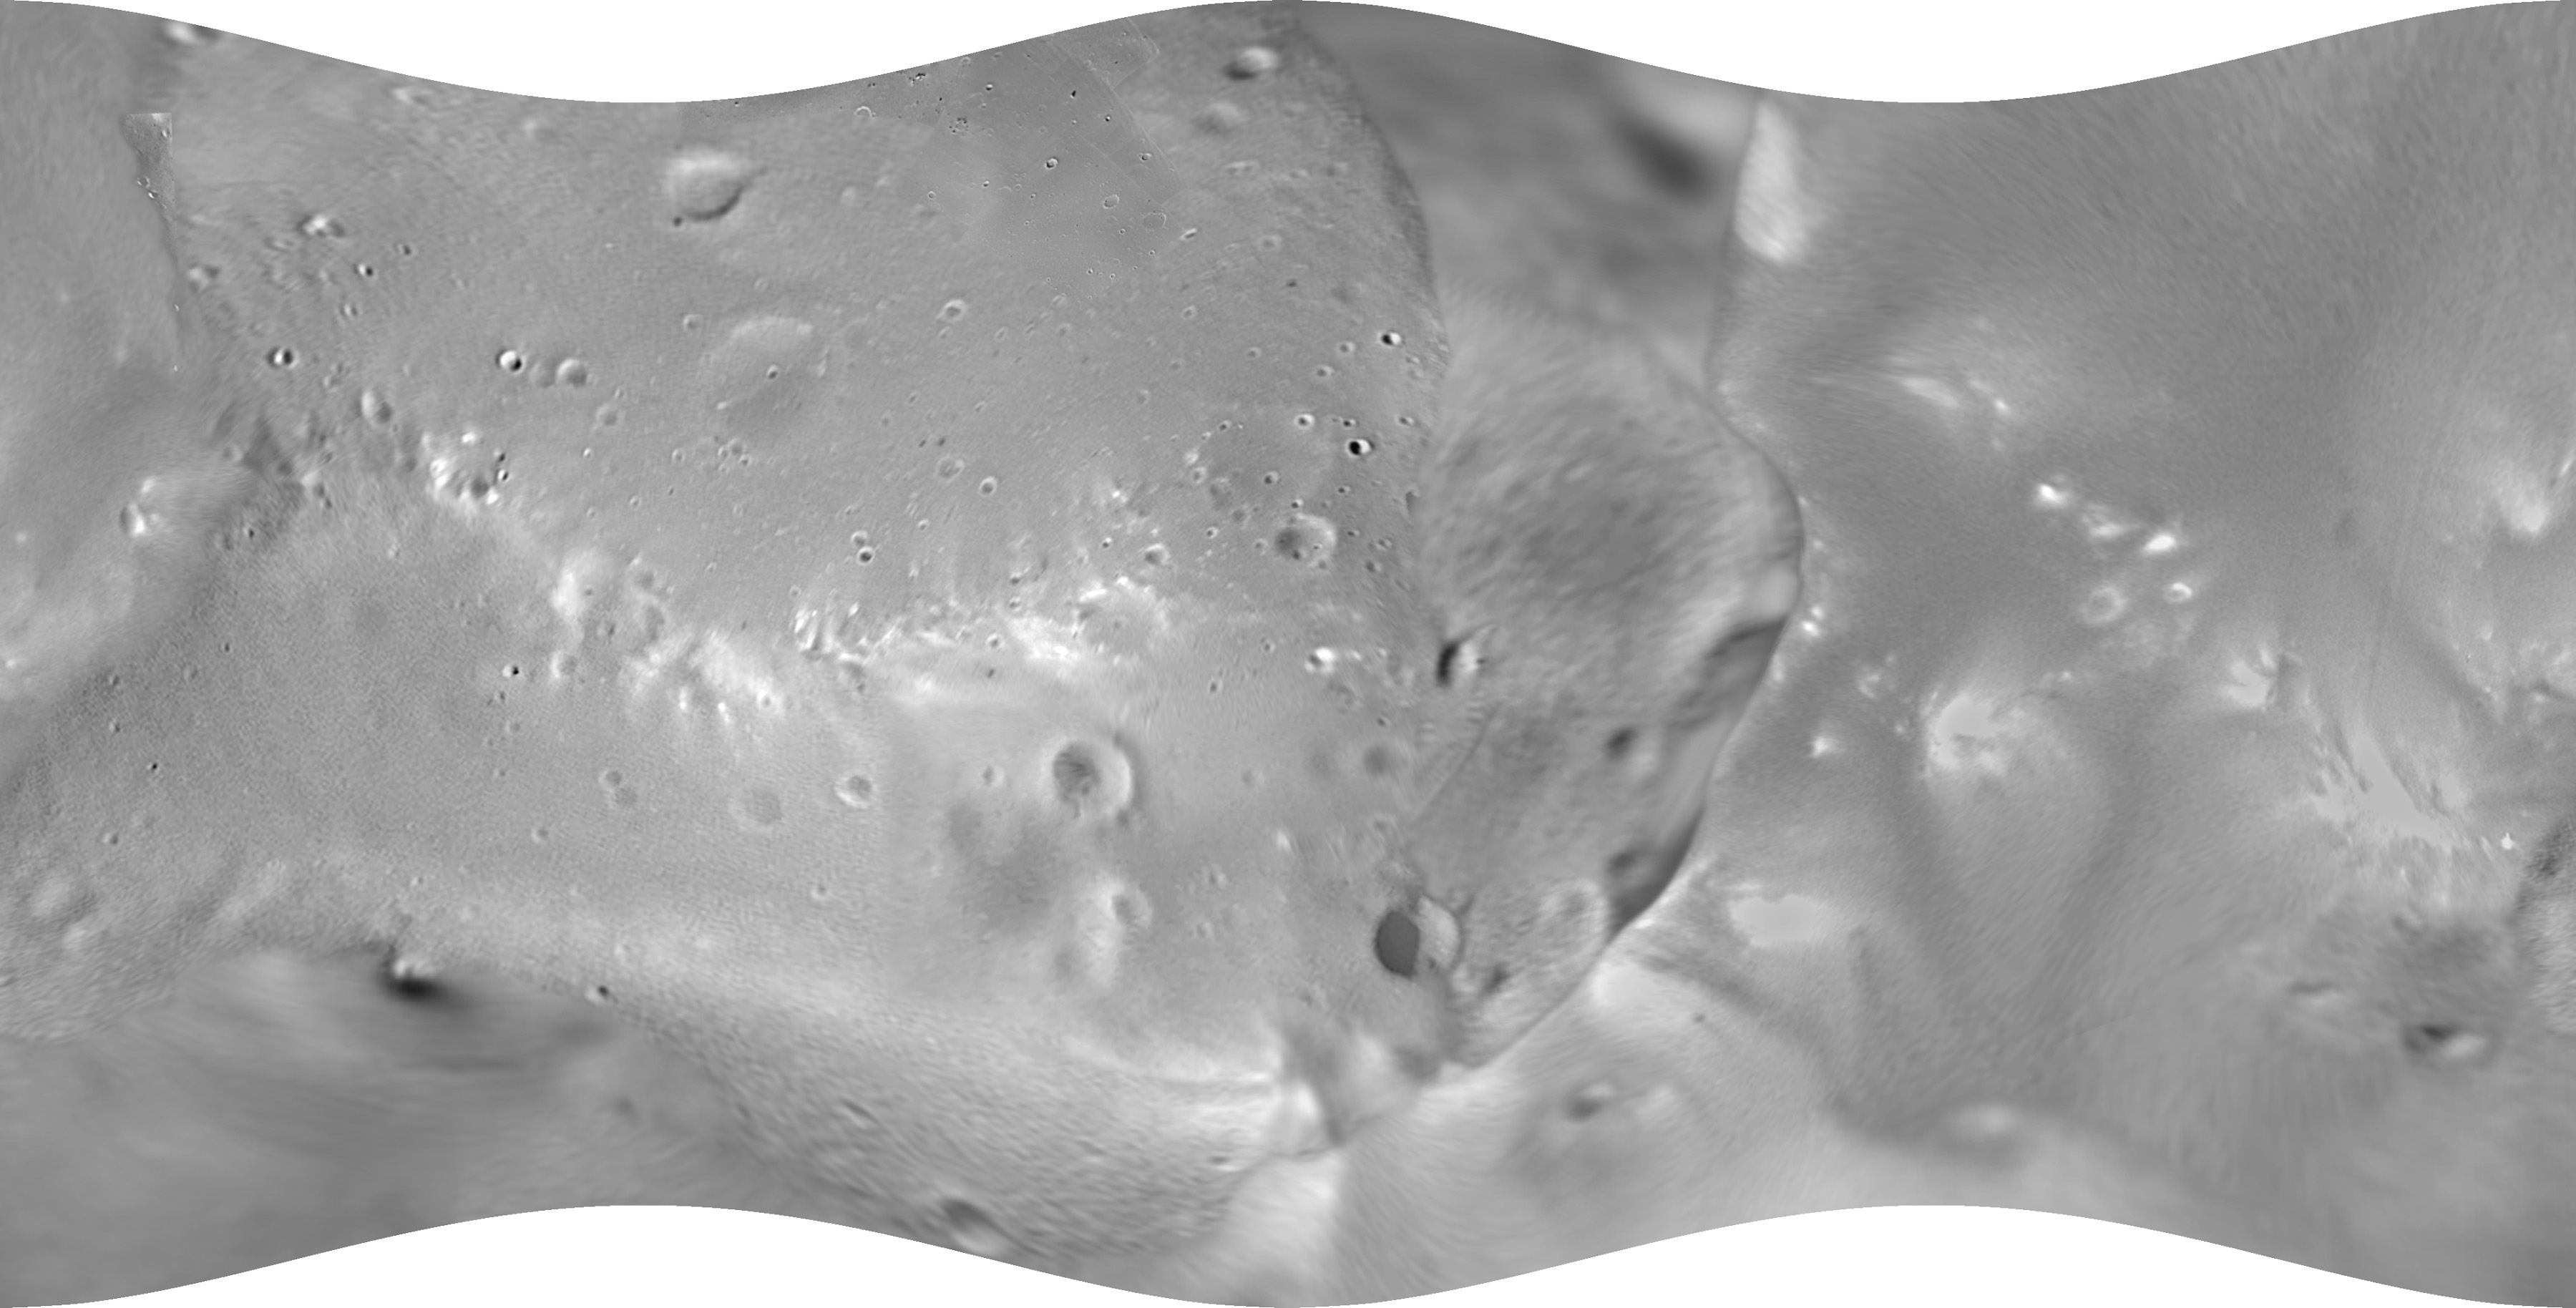
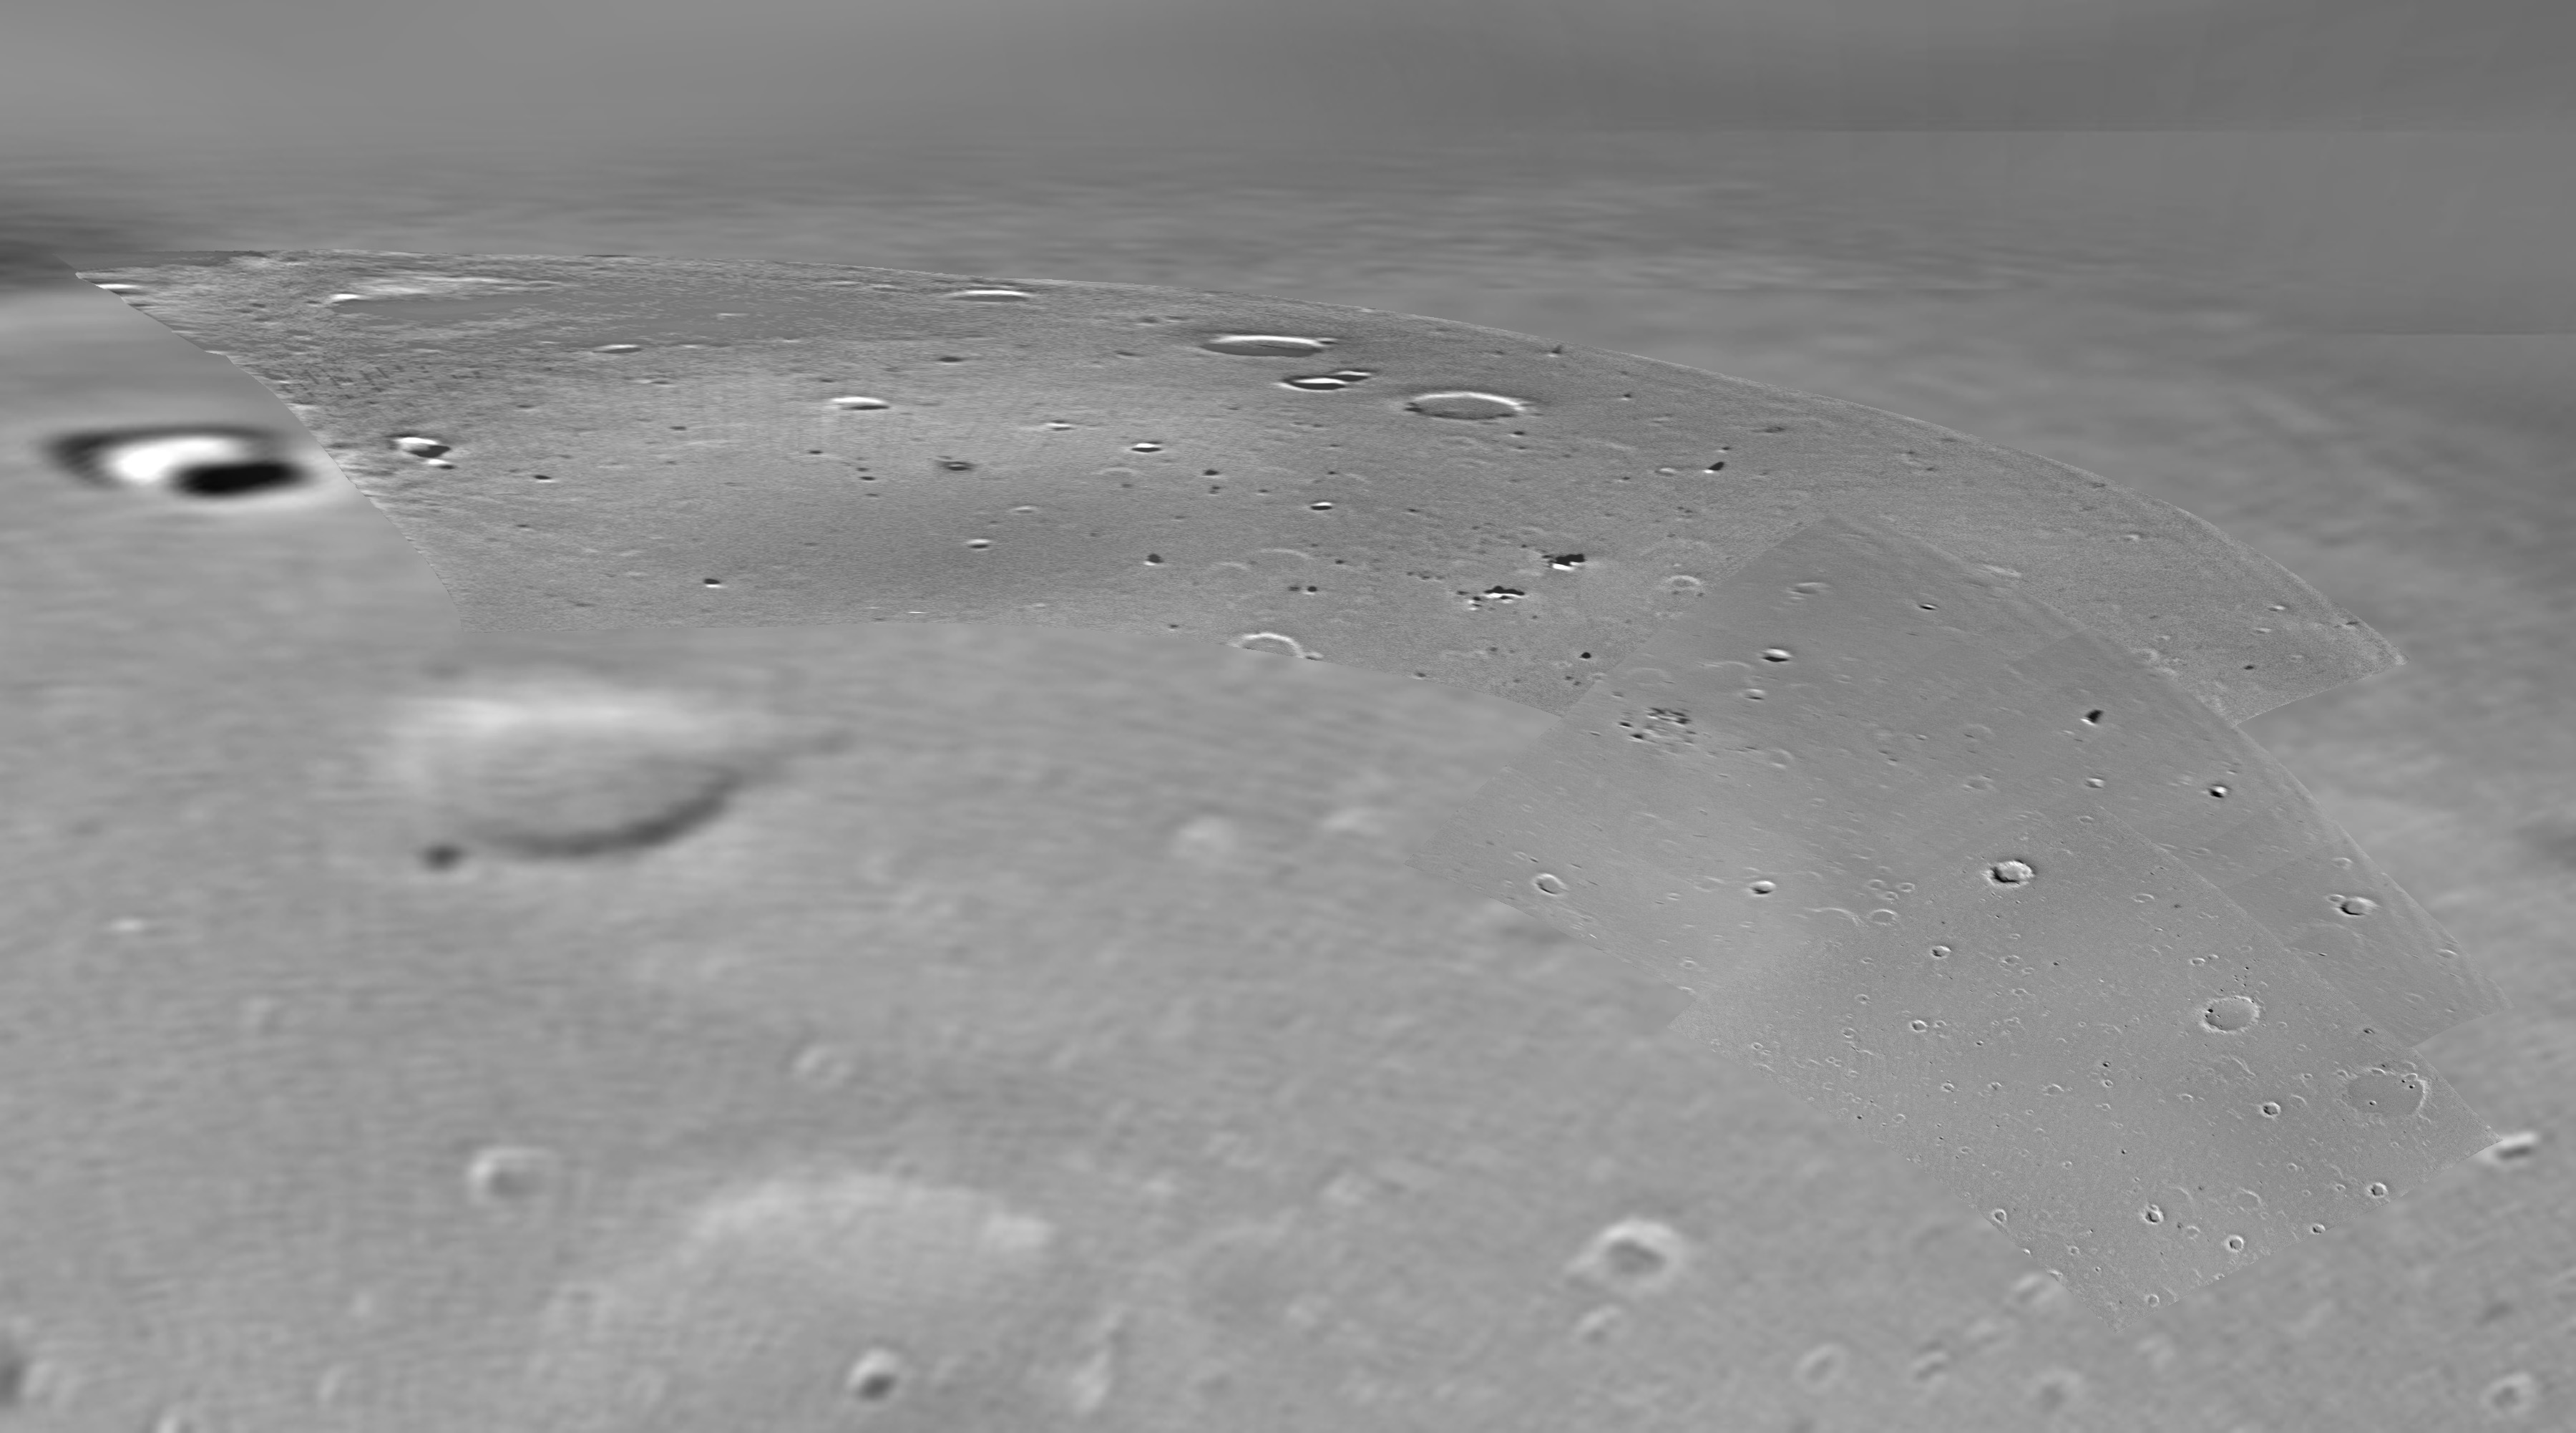
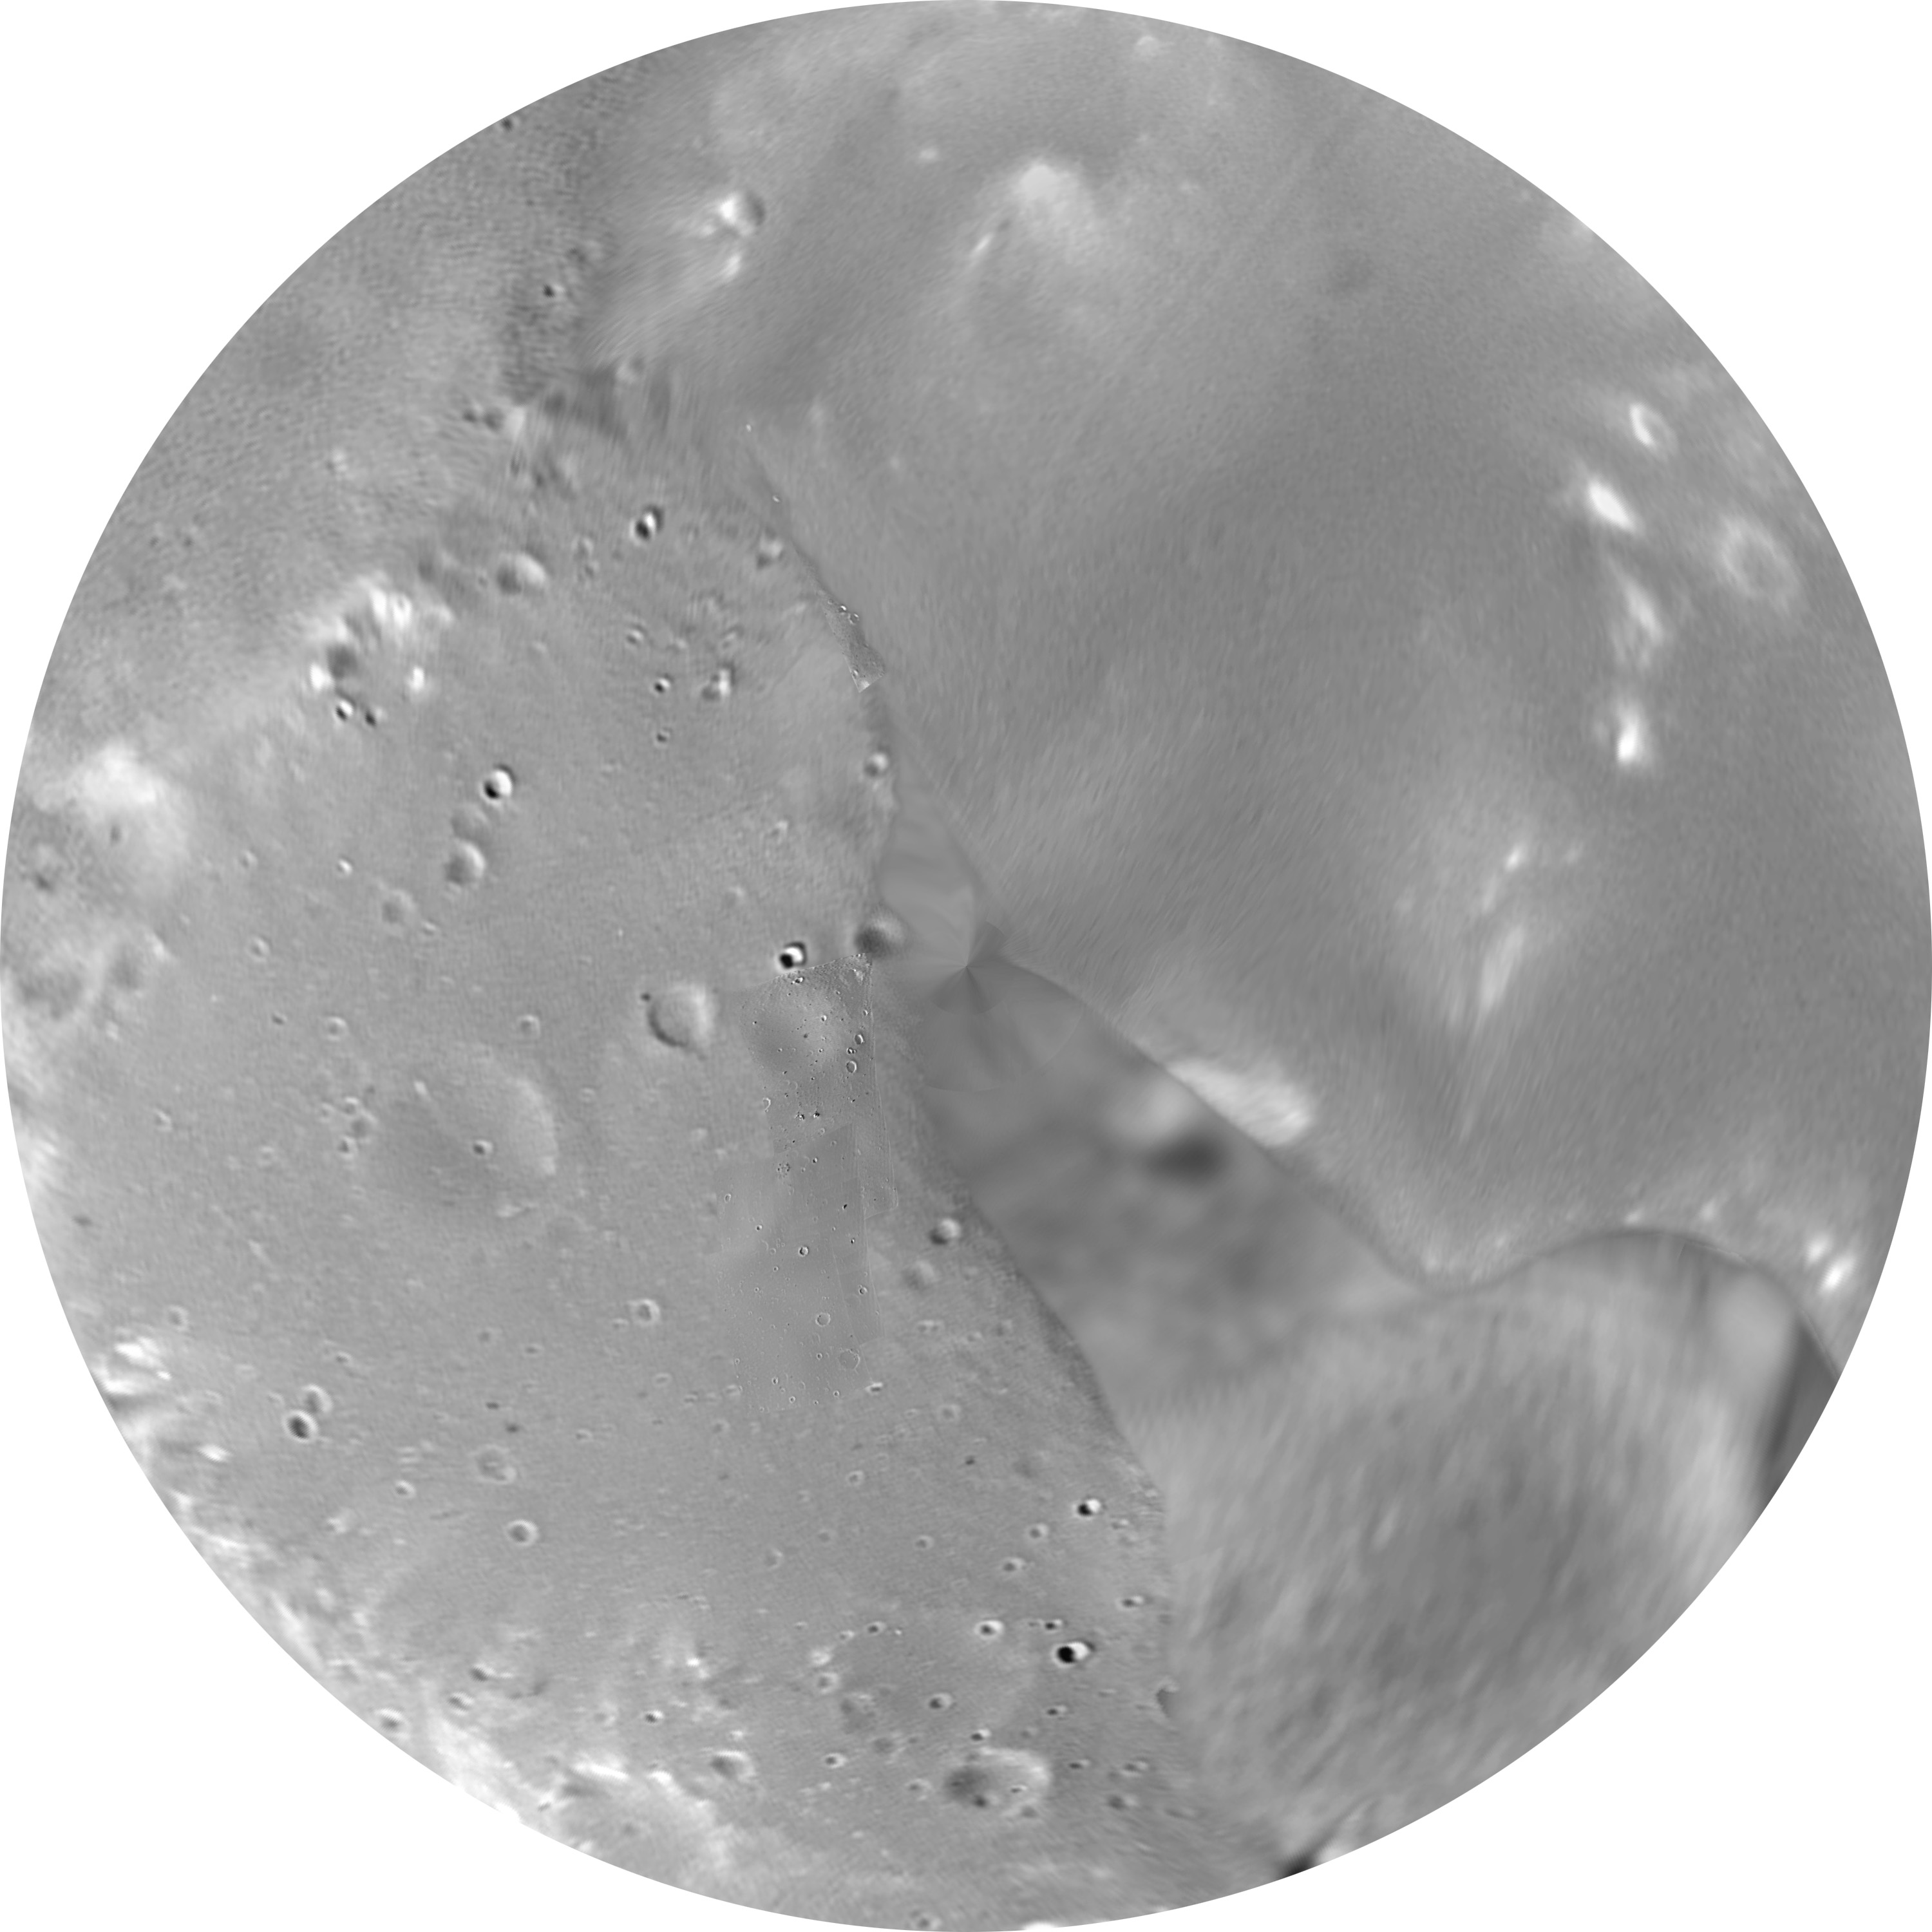
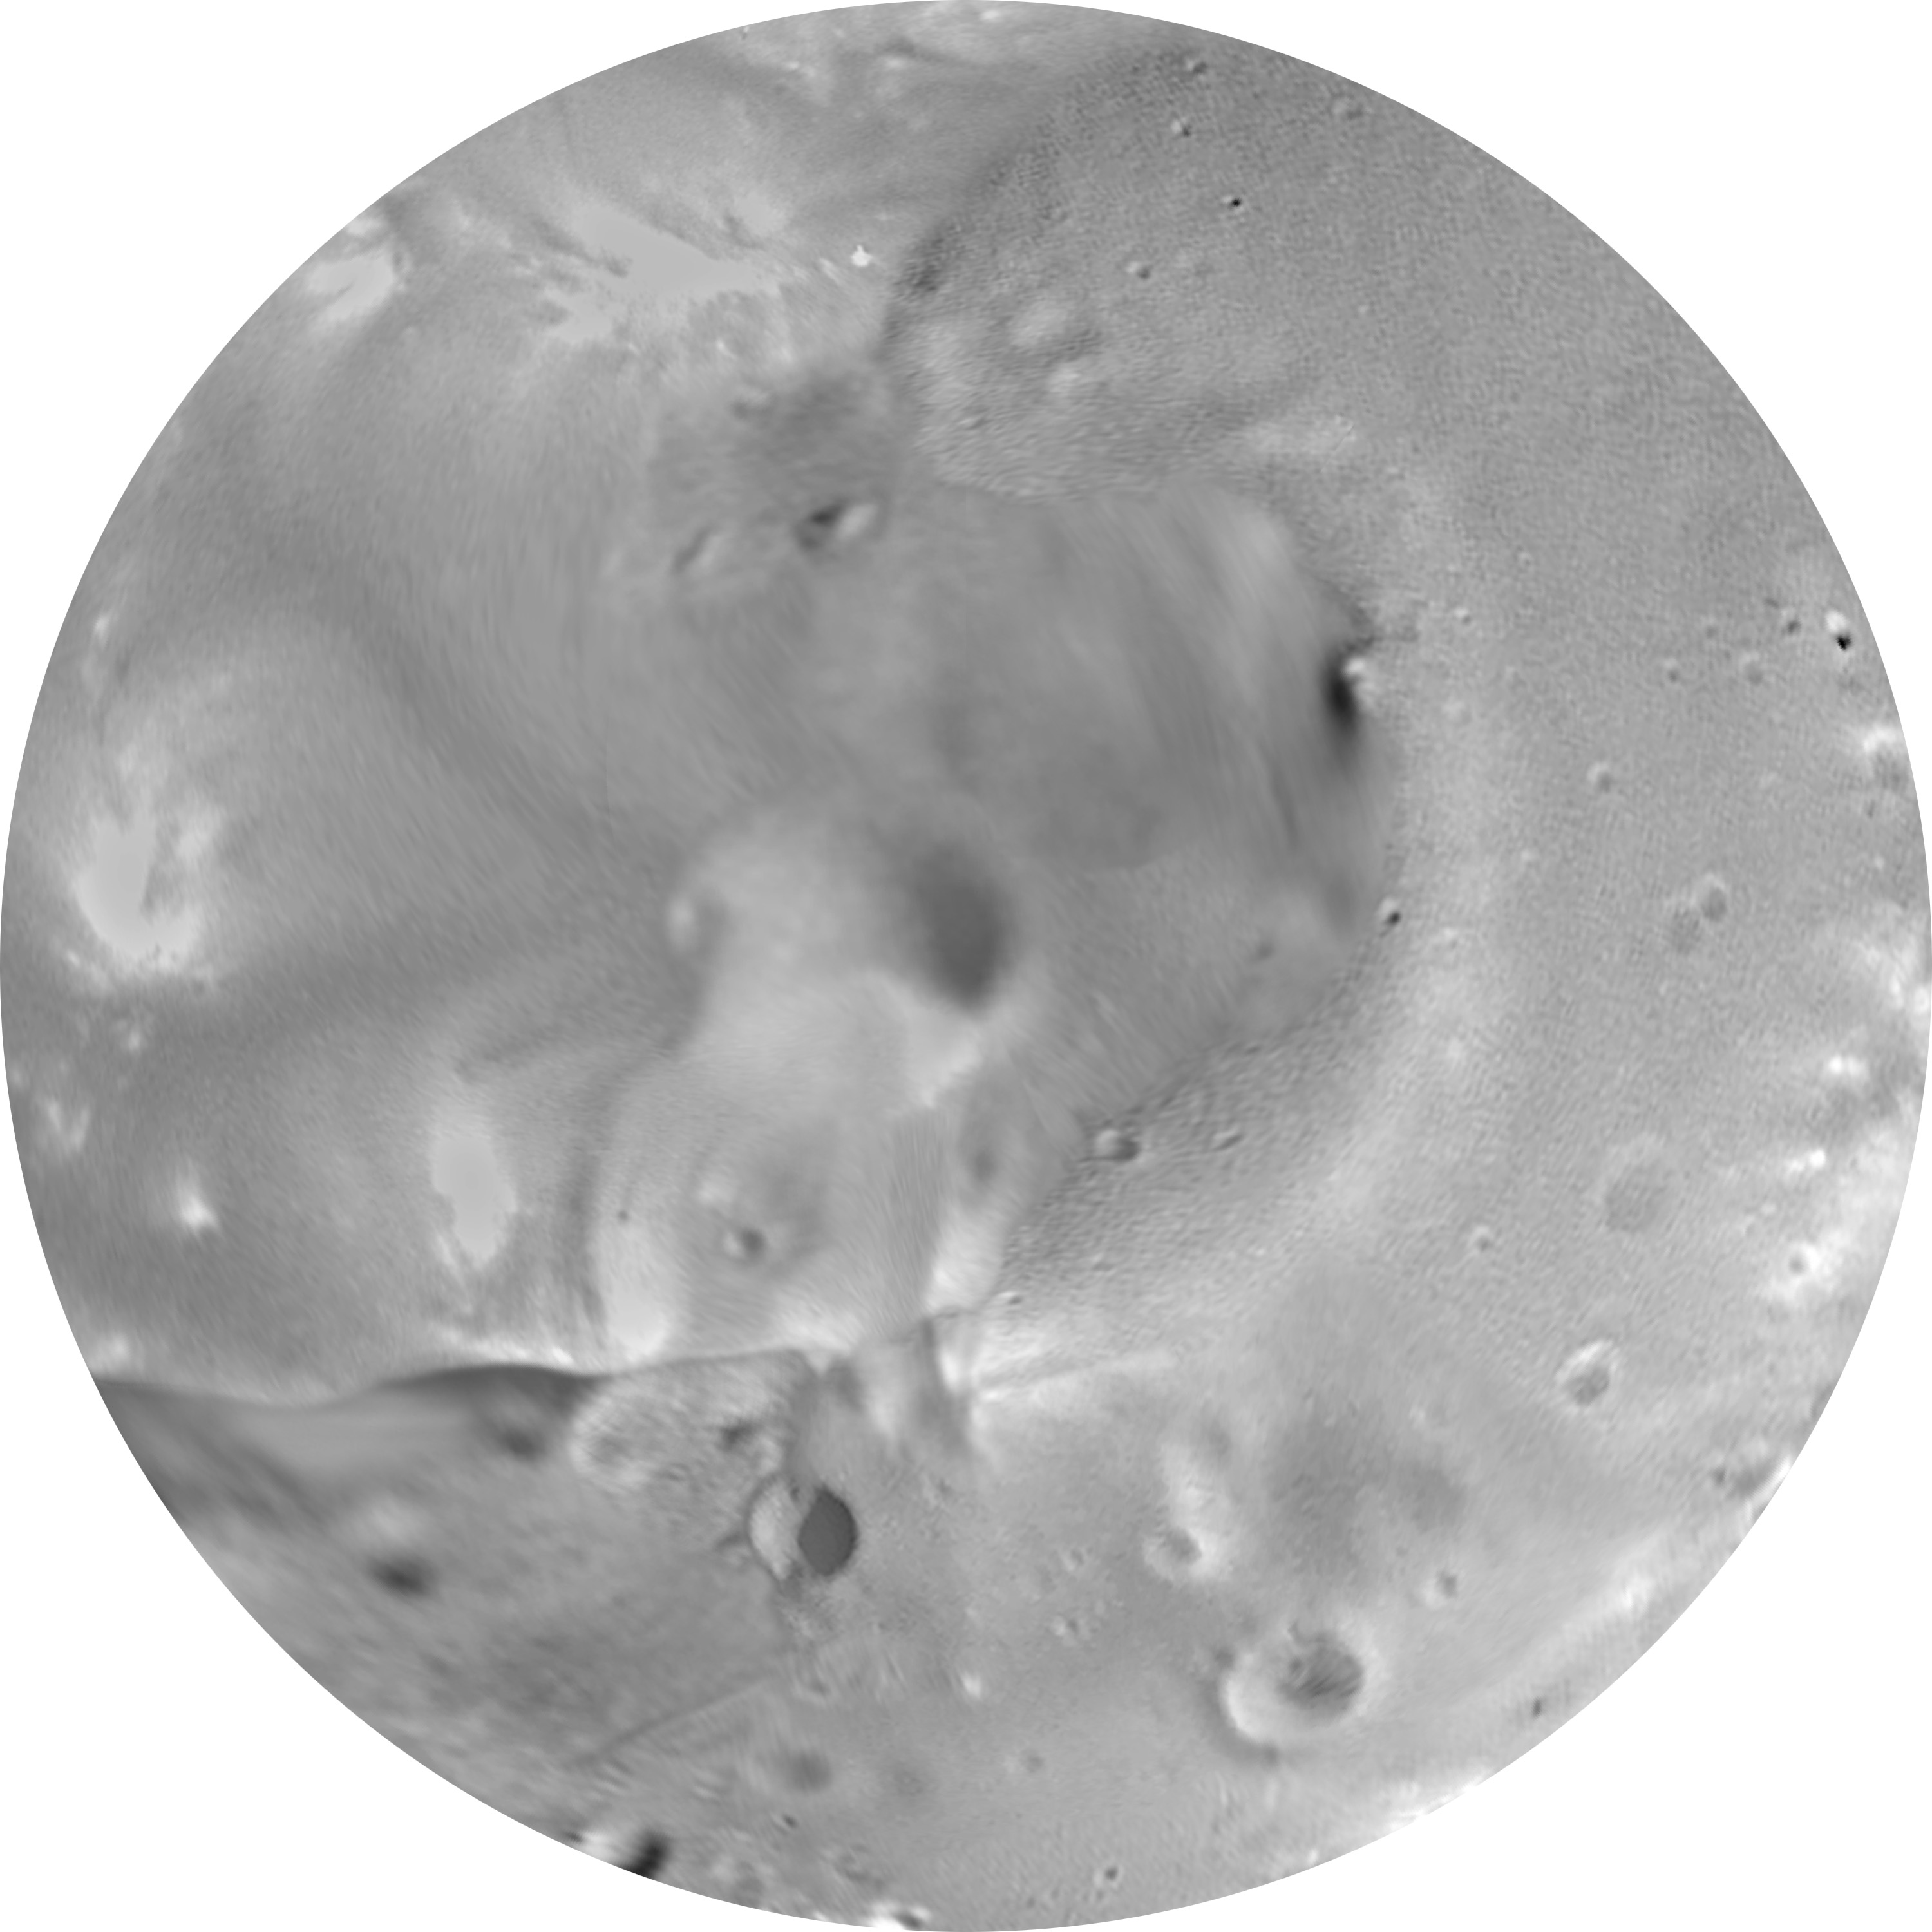
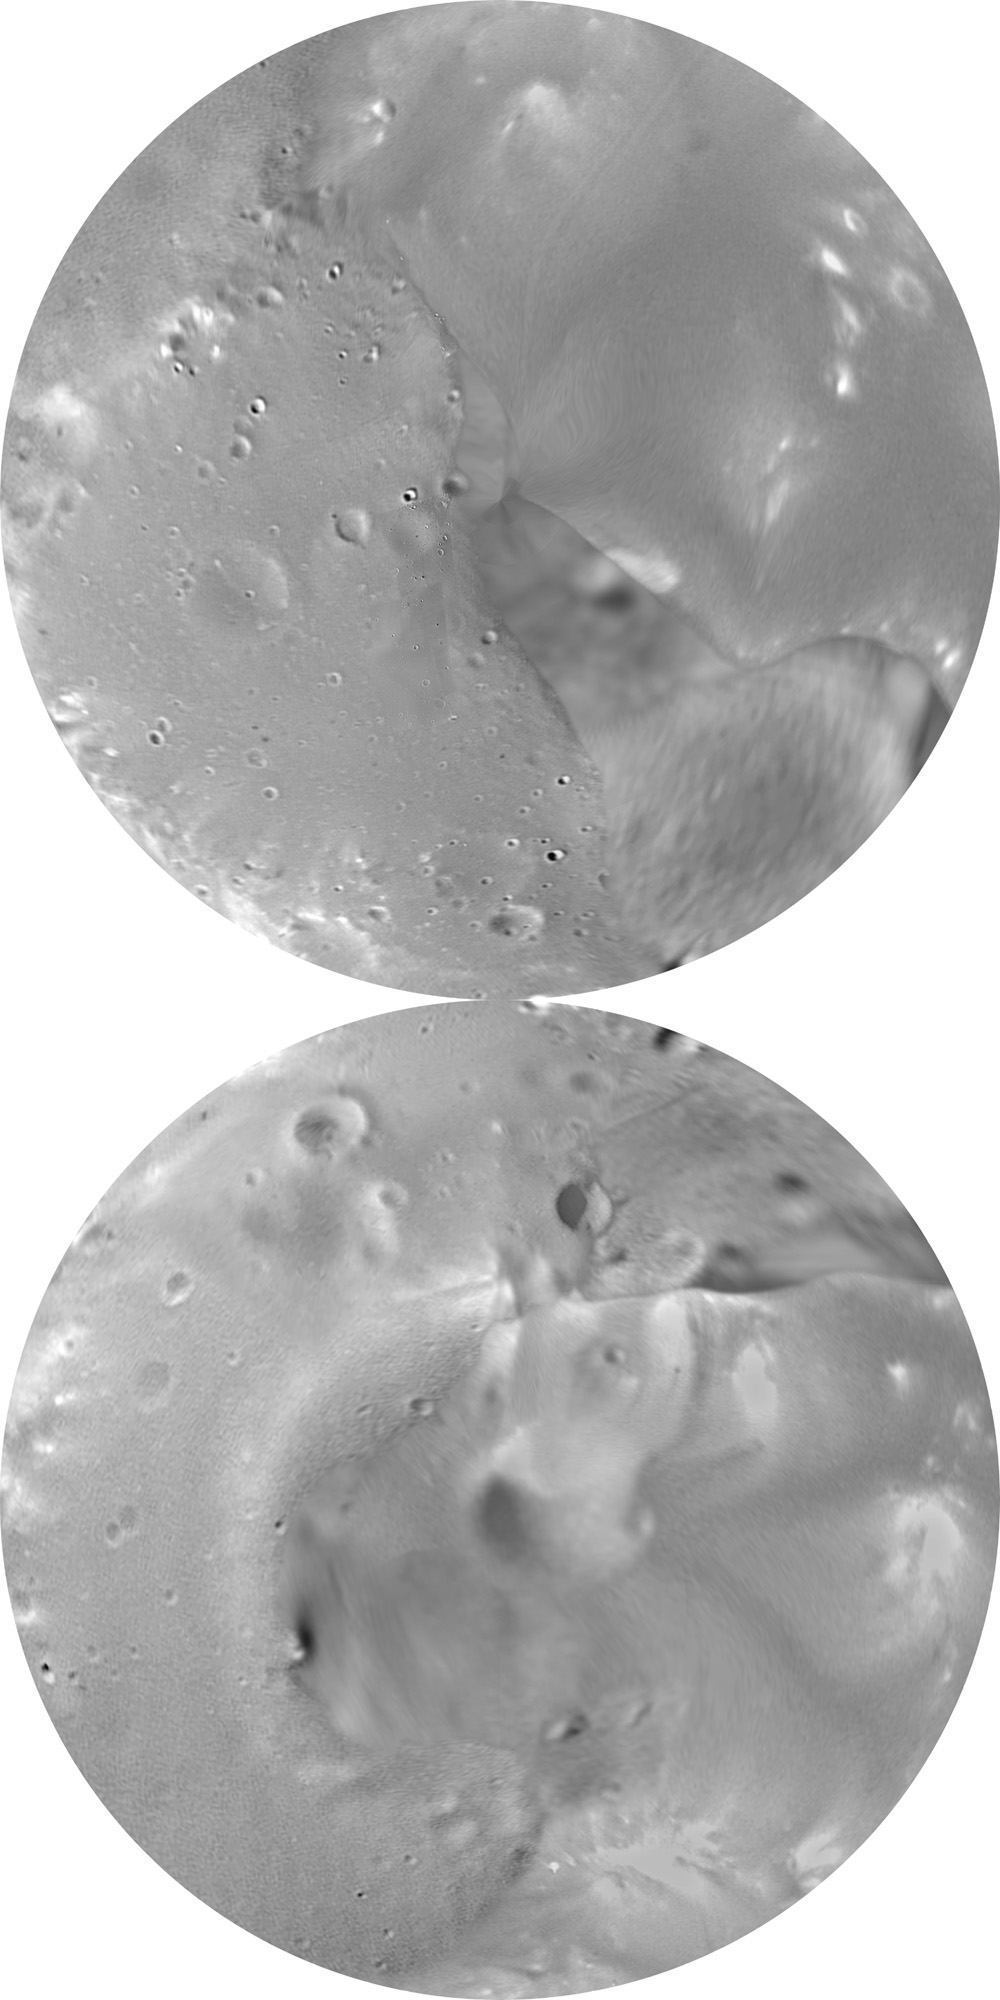
B. Global mosaics in various projections, created by Philip Stooke with
the assistance of Chris Jongkind and Megan Arntz. The Mariner 9 mosaic
was produced with the assistance of John Pfau. Control is based on a shape
model and mosaic by Peter Thomas and colleagues at Cornell University.
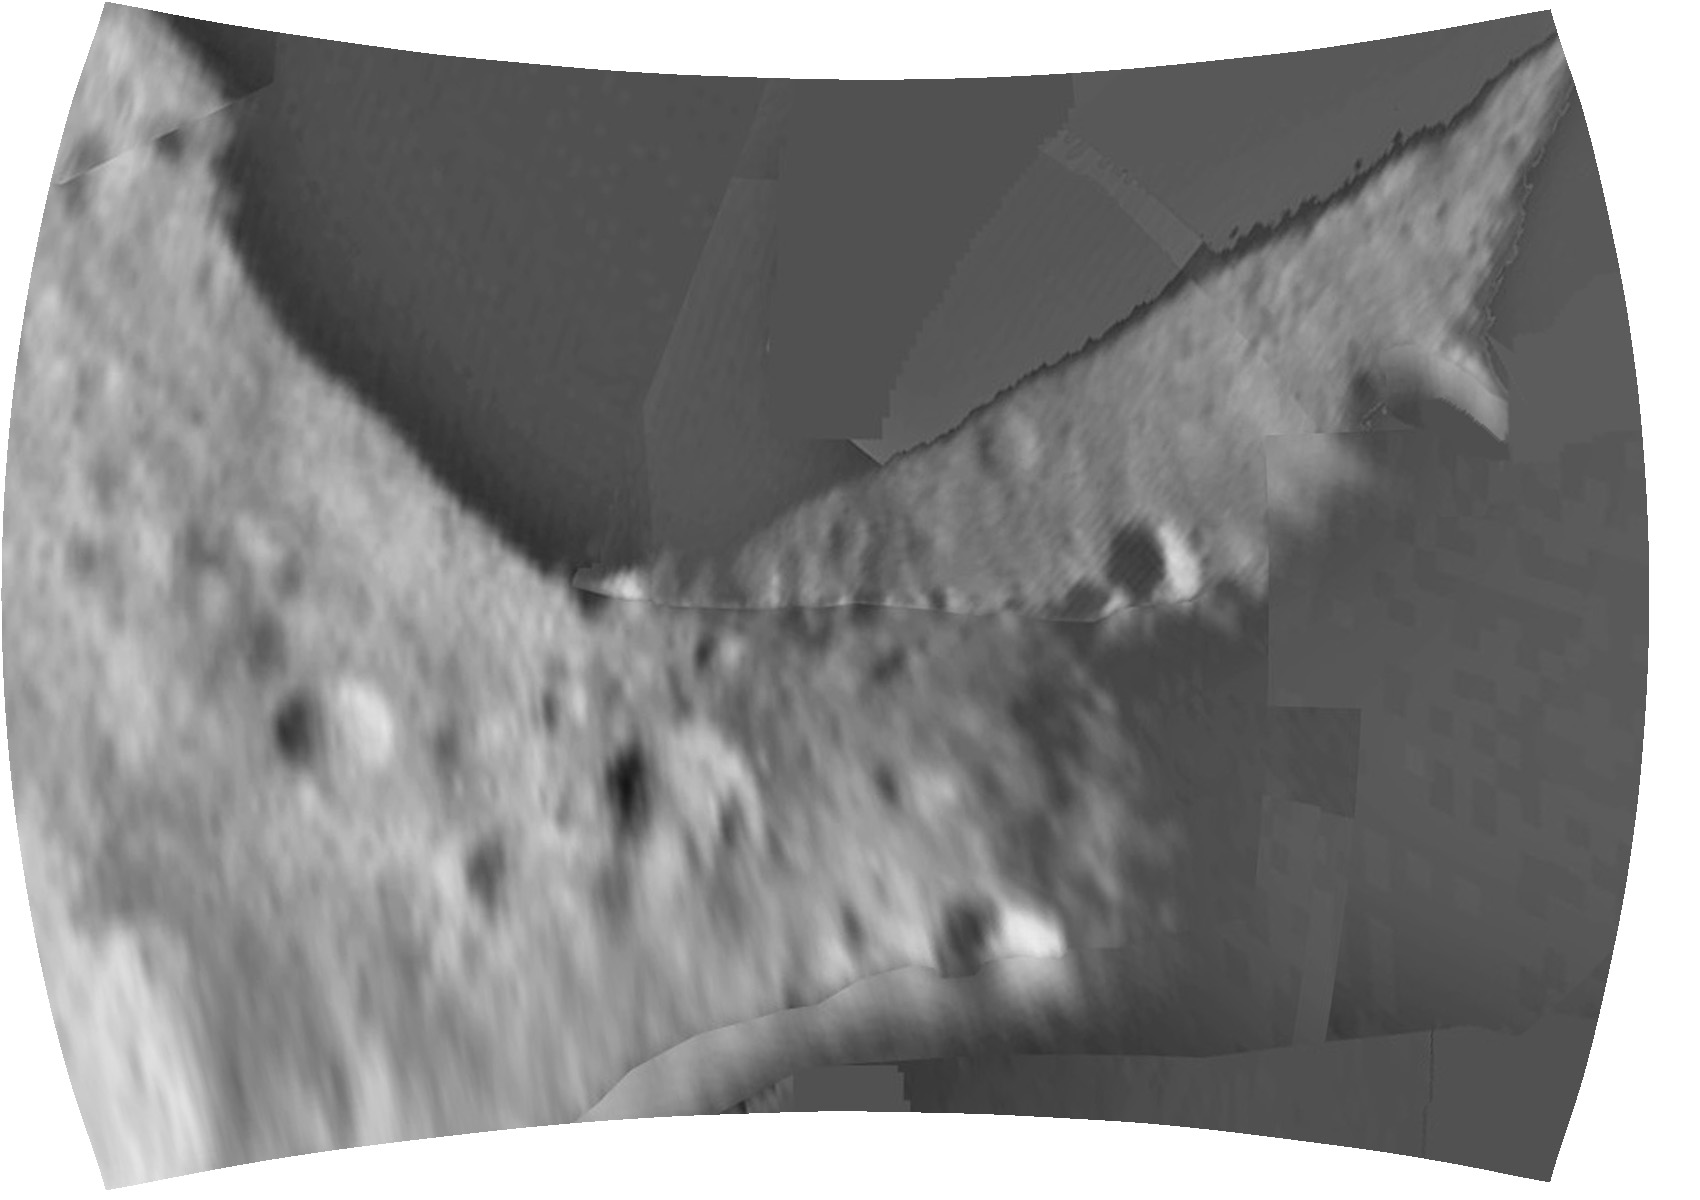
J5 Amalthea
These shaded relief maps were drawn by P. Stooke from Voyager images of
Amalthea, positional control by P. Stooke. The maps are derived from
an original drawing in a different projection which was included on the
Galileo mission web site at JPL. Here, the original drawing has been
converted to Simple Cylindrical projection at 10 pixels/degree, and then
reprojected to other projections.
Note on the Prismographic Projection (P. Stooke, unpublished, 1999):
The spacing between meridians is equal to their spacing (at the equator)
on a triaxial ellipsoid used as a shape model (131 x 73 x 67 km semiaxes).
The spacing between parallels is equal to their spacing along each
meridian on the triaxial ellipsoid. Different variants, approximating
equivalence, equidistance, and conformality, would be possible if
appropriate scale factors are introduced in the y coordinate equations.
In the case illustrated here the y coordinates are divided by the
cosine of the latitude, which increases spacing towards the poles to
give a compromise between equidistance and conformality. The name
"prismographic" indicates that the surface is projected onto a prism
with the same cross section as the body's equator. Cylindrical projections
are a subset of prismographic projections. Extends from 70 degrees north to
70 degrees south.
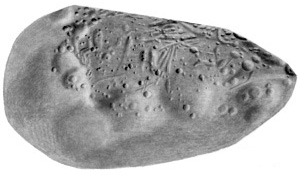
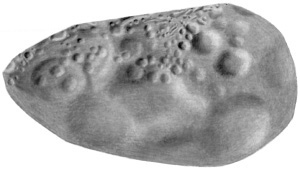
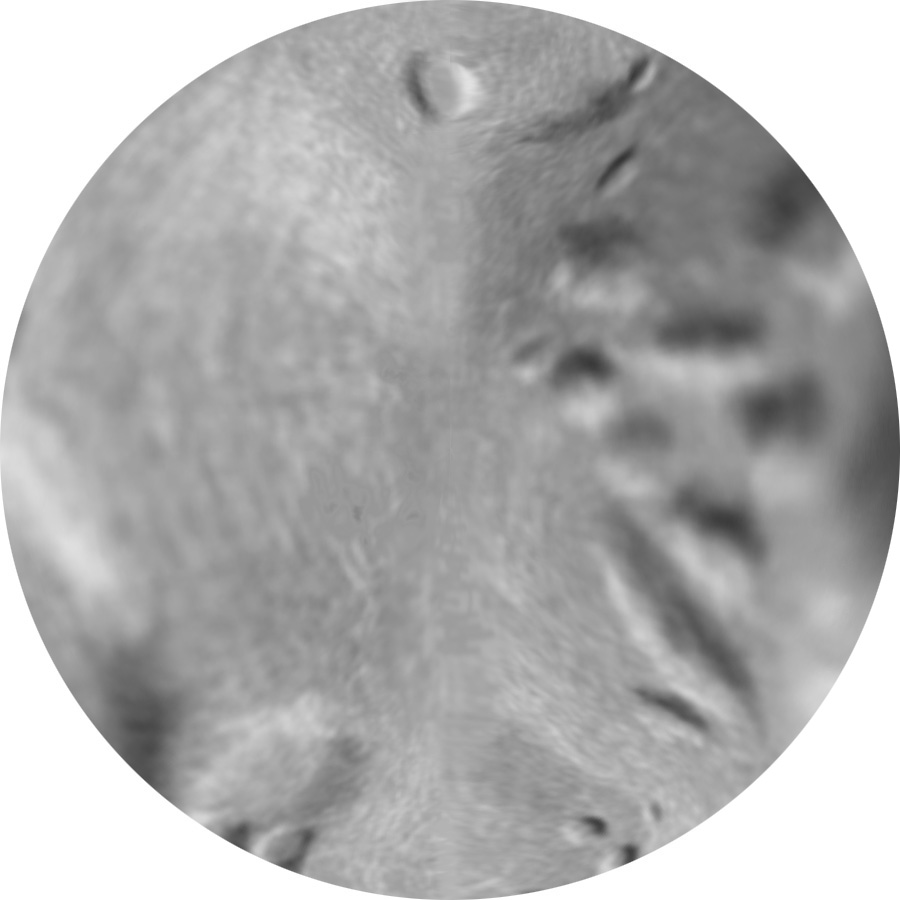
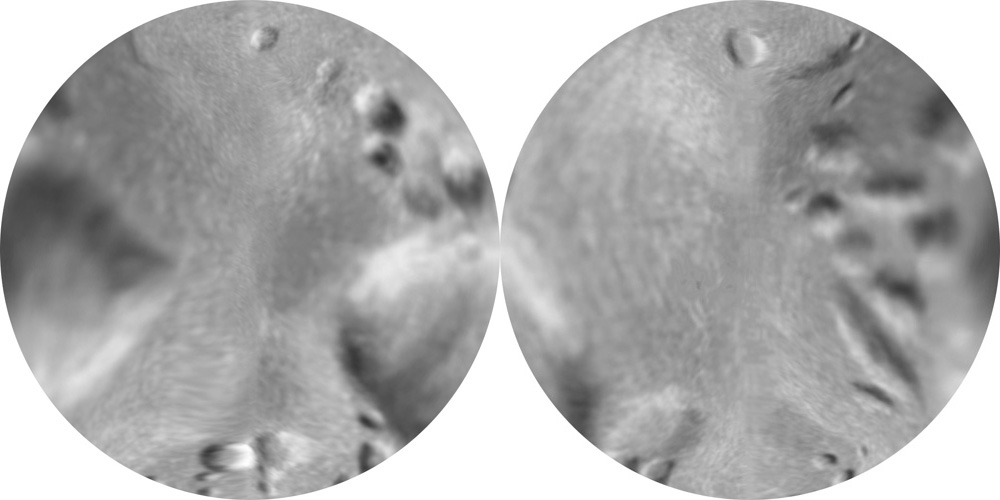
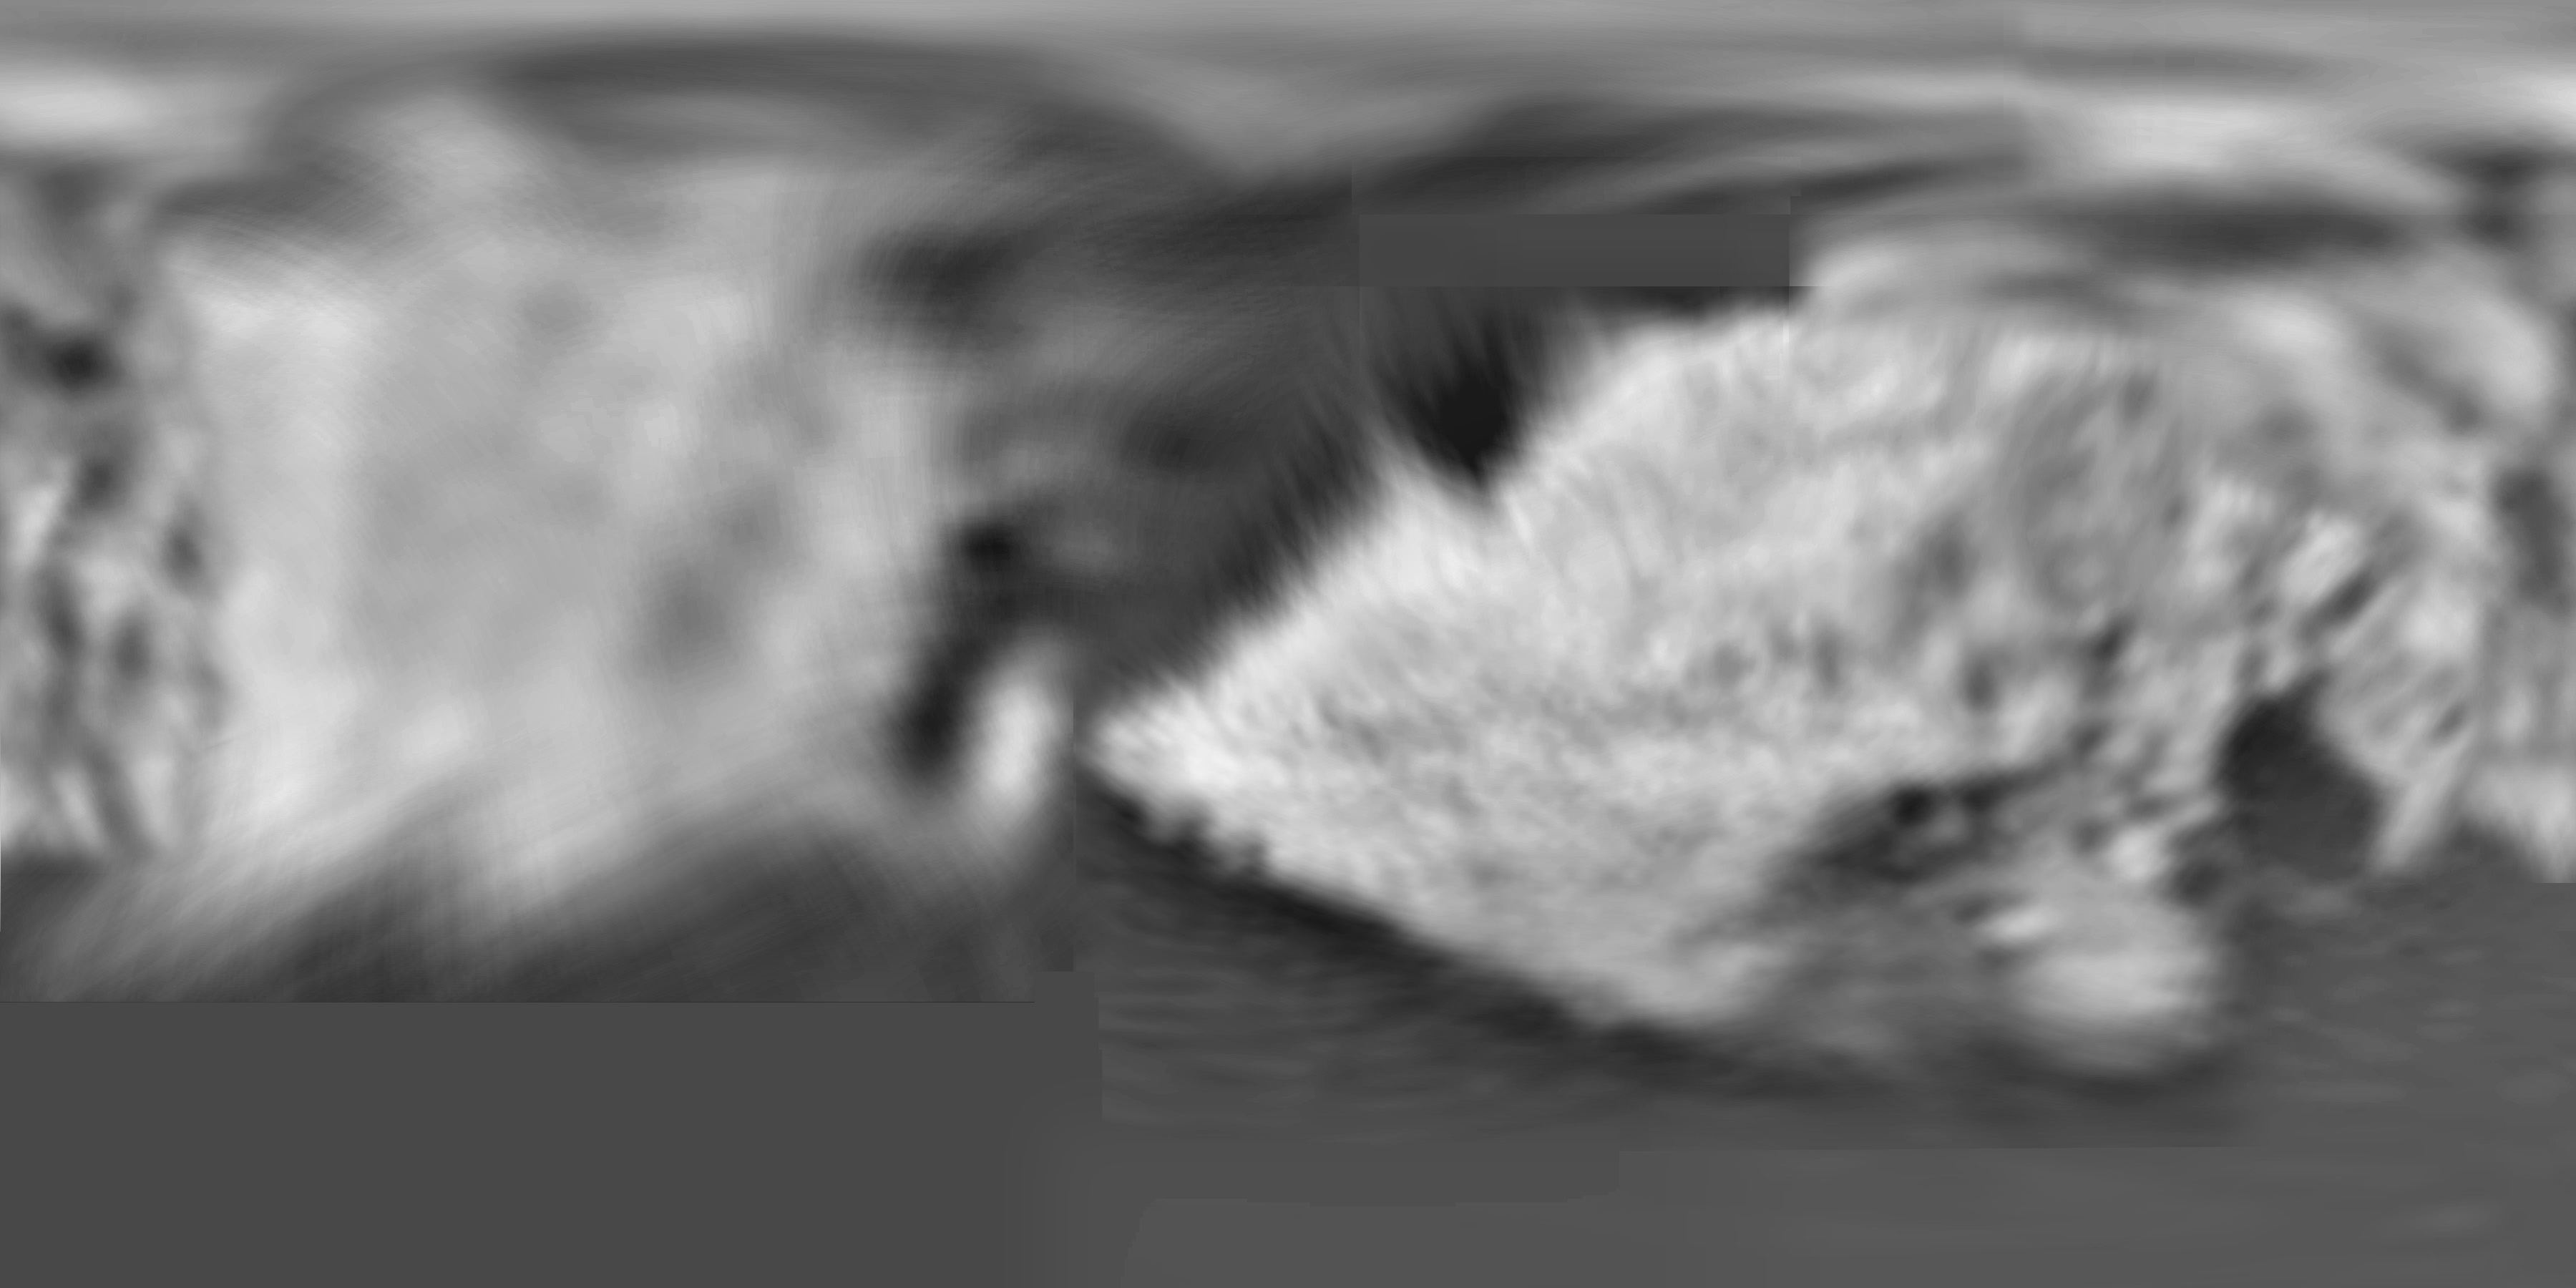
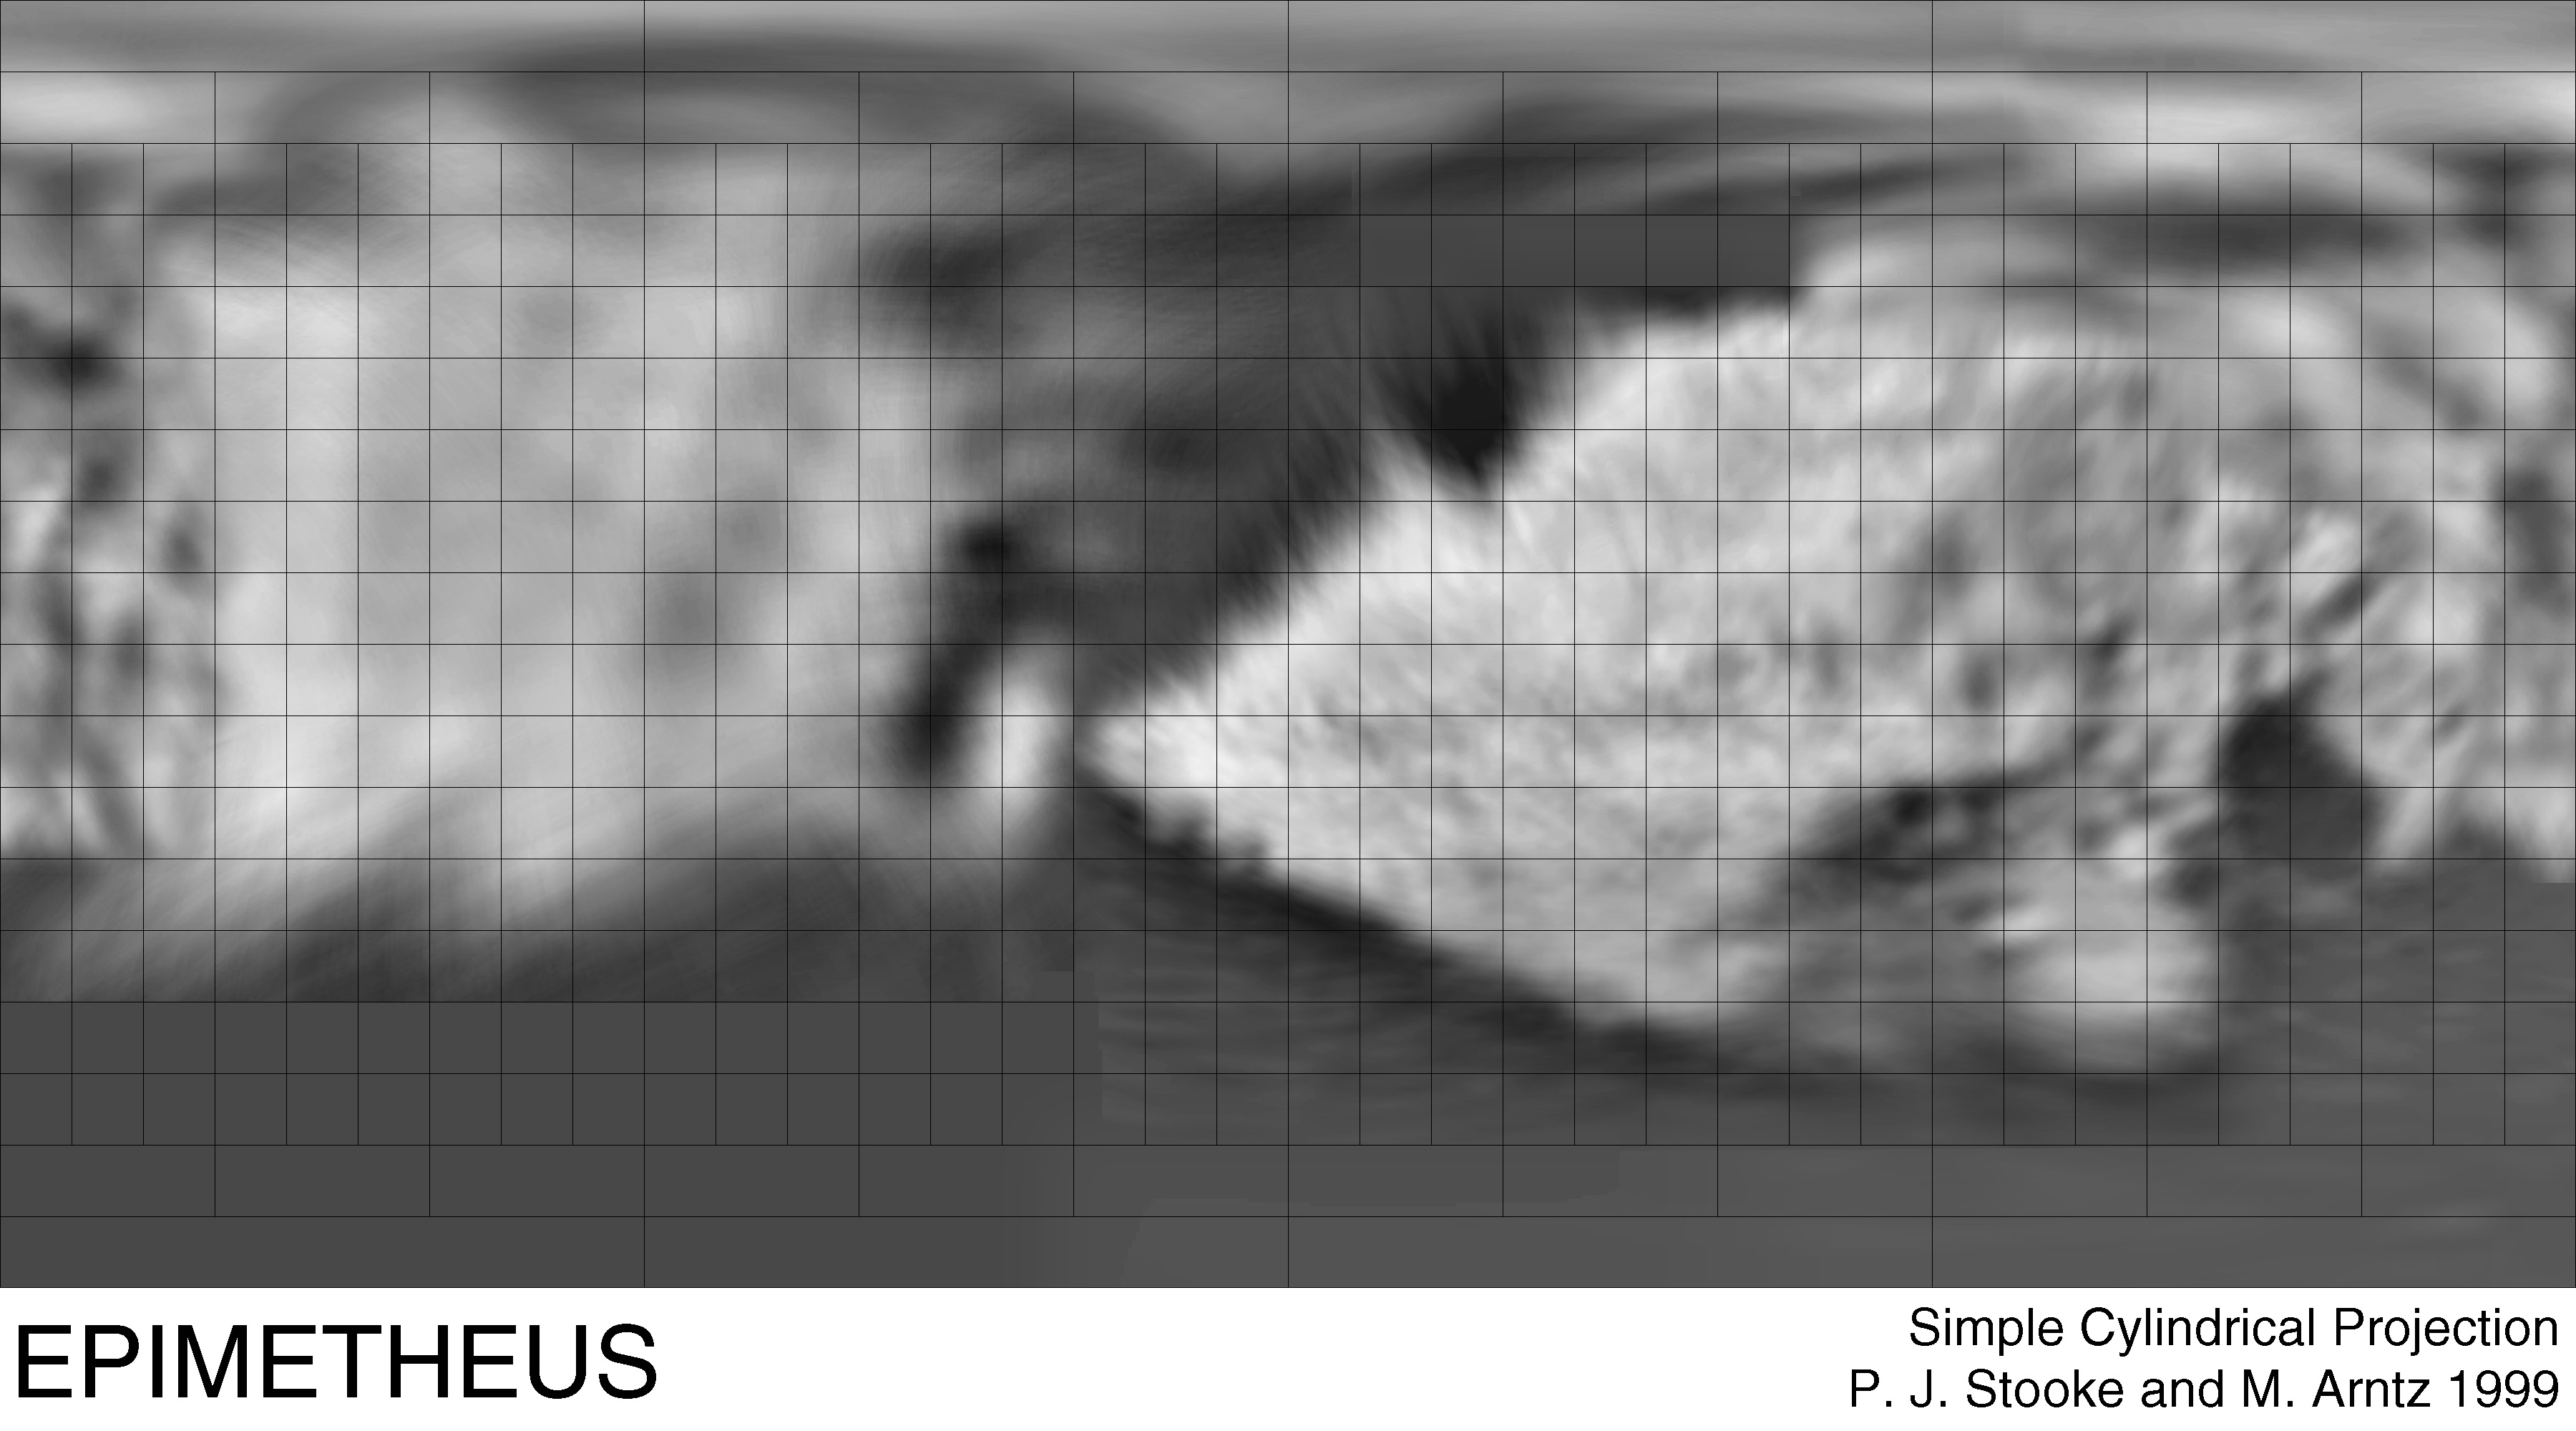
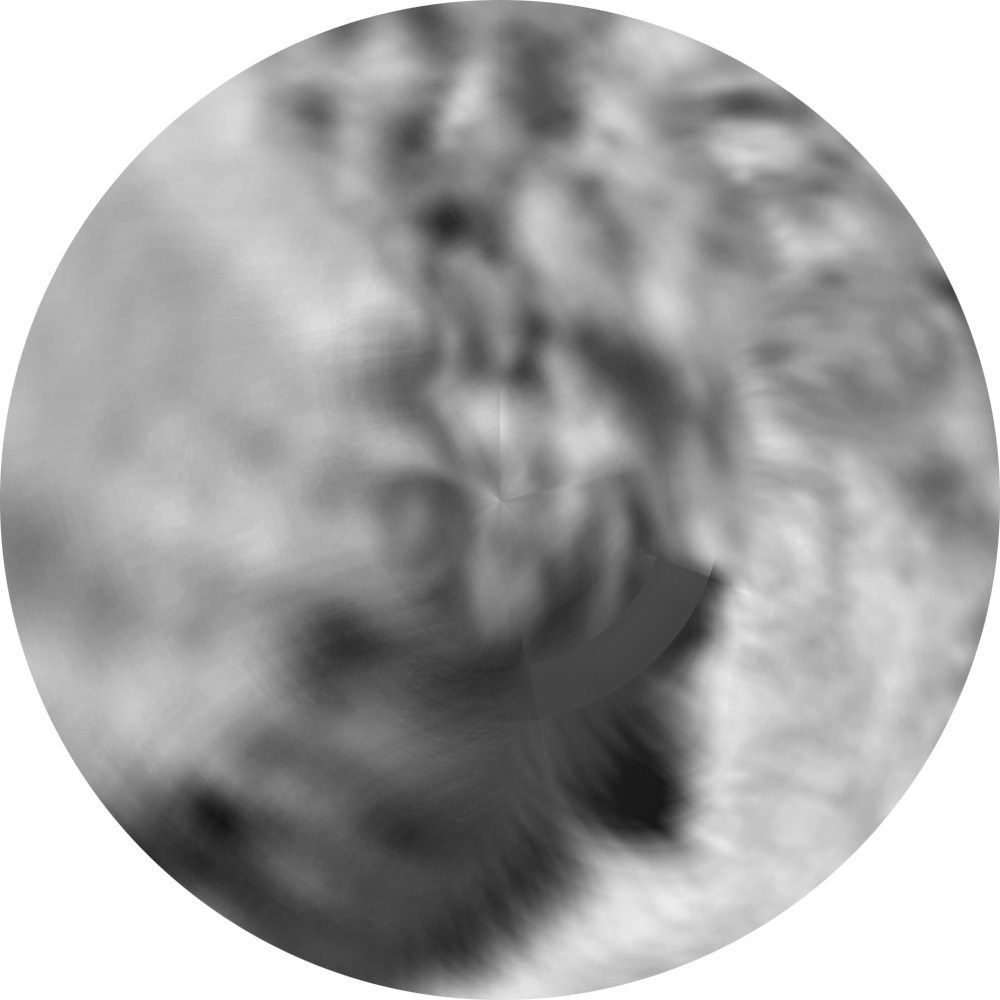
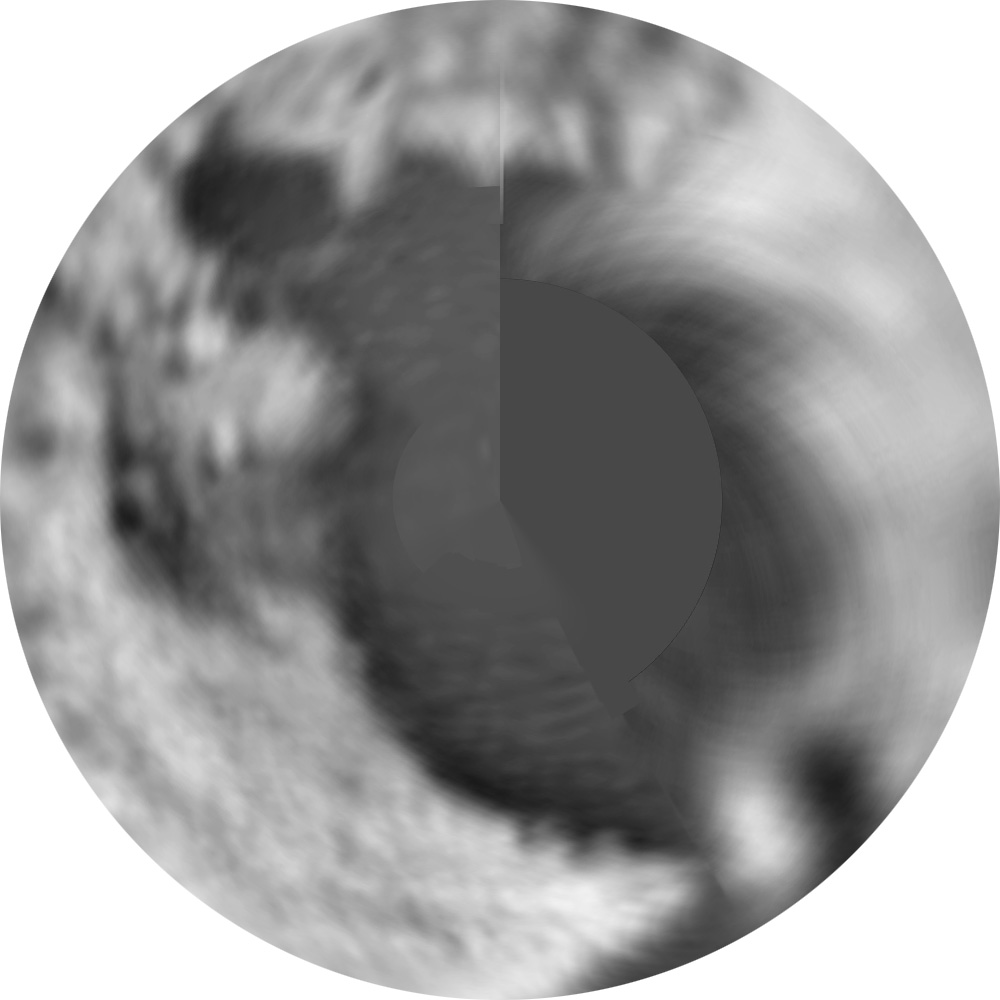
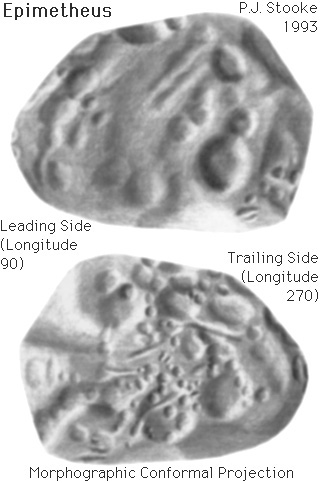
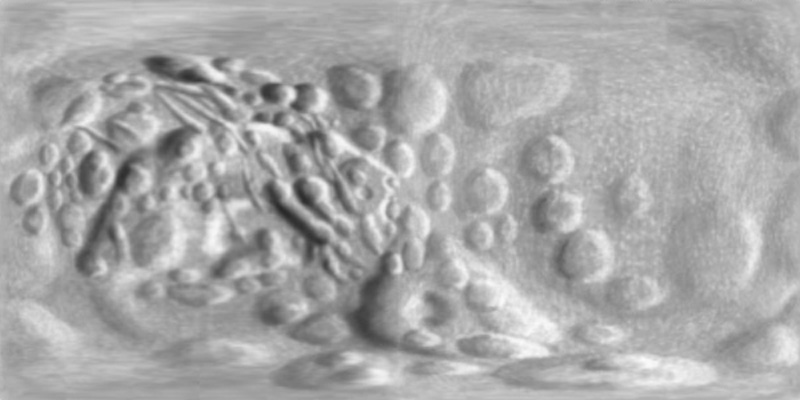
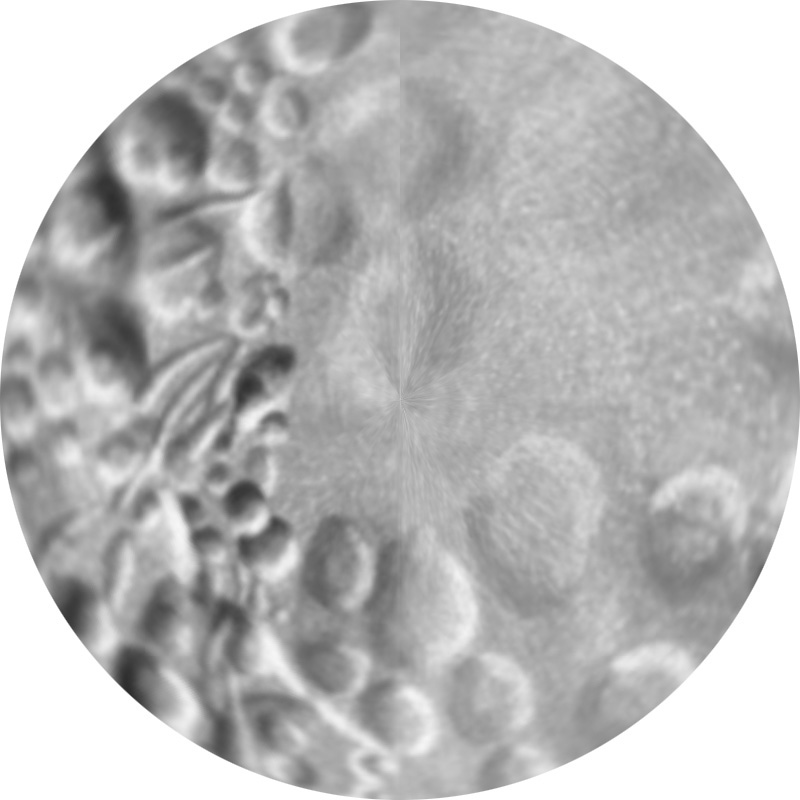
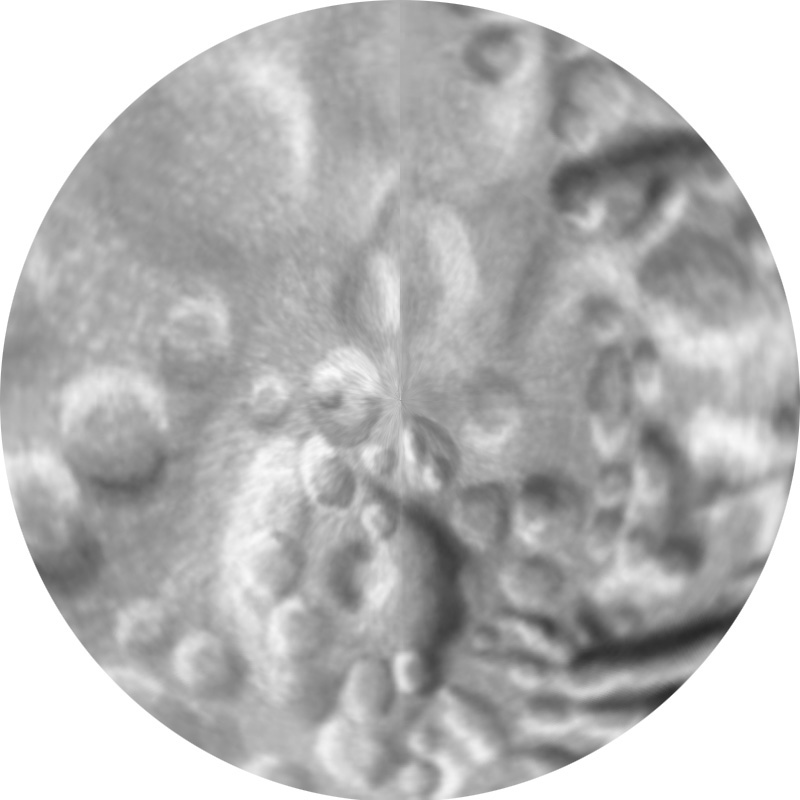
S11 Epimetheus
Maps and mosaics of Epimetheus based on Voyager 1 and 2 data. Control
in the mosaics is by P. Thomas, but in the shaded relief map it is from
an earlier, less reliable shape by P. Stooke.
Note: Morphographic Conformal projection is shaded relief drawing
projected onto the 3D convex hull of the shape, then reprojected
to morphographic conformal (effectively stereographic) projection,
in two hemispheres centered on the equator and at longitudes 90 and 270.
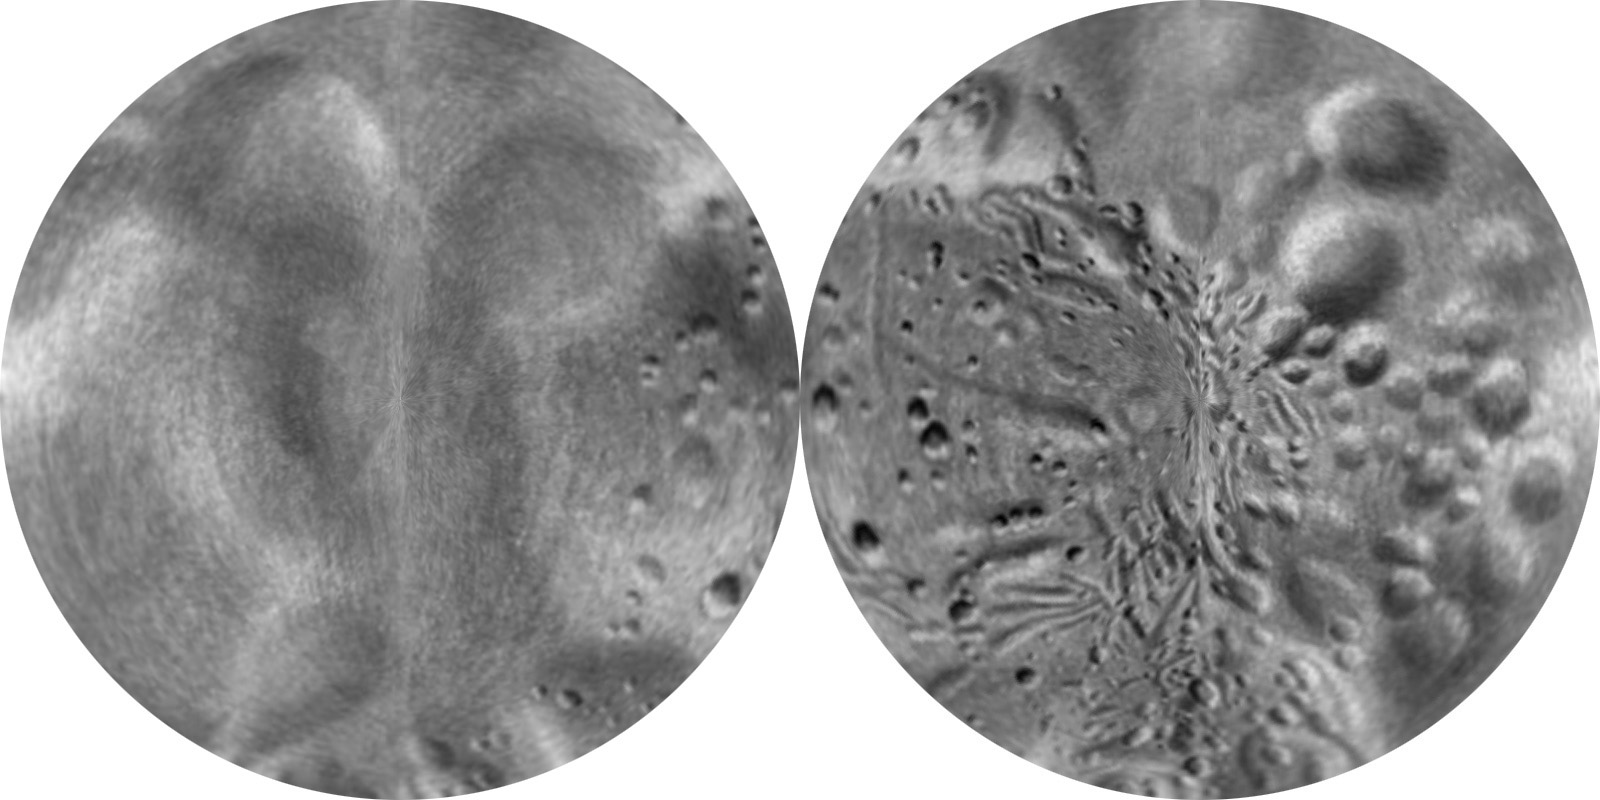
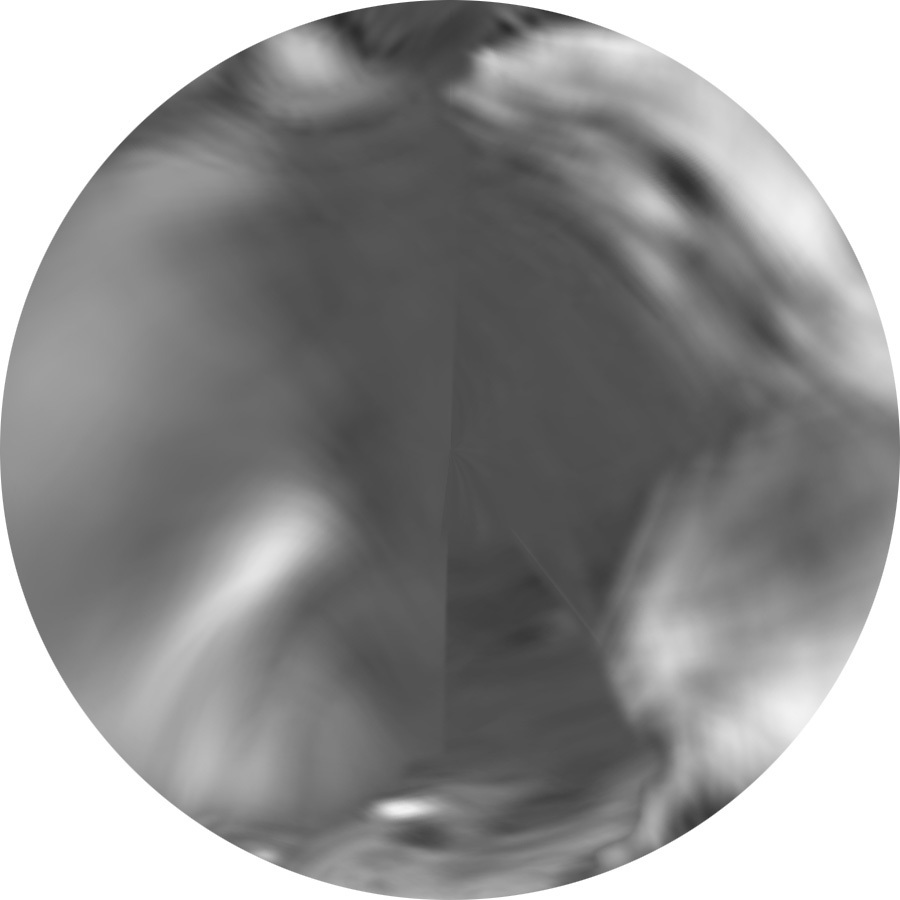
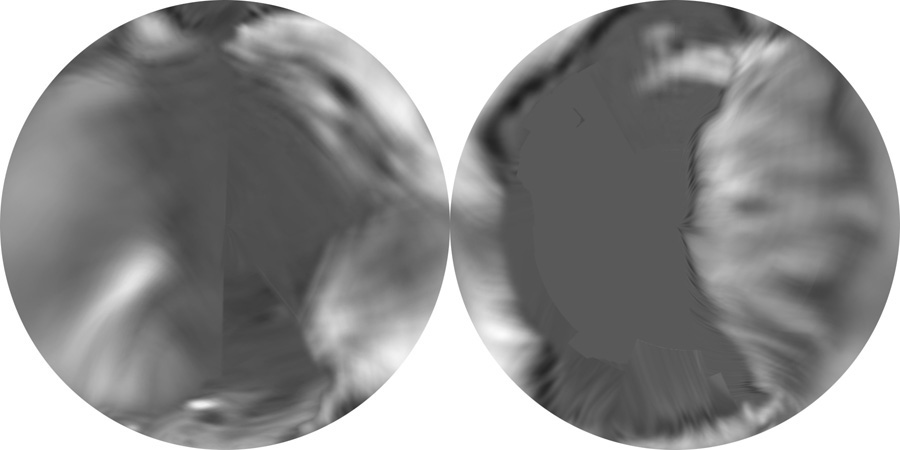
S7 Hyperion
Shaded relief maps of Hyperion, based on Voyager 2 images, using control
by P. Thomas.
Note: Morphographic Conformal projection is shaded relief drawing
projected onto the 3D convex hull of the shape, then reprojected
to morphographic conformal (effectively stereographic) projection,
in two hemispheres centered on the equator and at longitudes 90 and 270.