Dec 31, 2015
Document Author: Carol A. Raymond
Document Custodian: Carol A. Raymond
NATIONAL AERONAUTICS and
SPACE ADMINISTRATION
JET PROPULSION LABORATORY
California Institute of Technology
Pasadena, California
JPL D-31827
DAWN-21-4137
Copyright 2016 California Institute of Technology. U.S. Government sponsorship acknowledged.
DAWN
Science Plan
Prepared By:
Carol A. Polanskey
Dawn Science Operations Manager
Jet Propulsion Laboratory
Approved by:
_________________________________________________________
Carol A. Raymond
Dawn Deputy Principal Investigator
Jet Propulsion Laboratory
_________________________________________________________
Marc D. Rayman
Mission Manager
Jet Propulsion Laboratory
NATIONAL AERONAUTICS and
SPACE ADMINISTRATION
JET PROPULSION LABORATORY
California Institute of Technology
Pasadena, California
===================================================================================
CHANGE       CHANGE DATE       PAGES      CHANGES/NOTES     GENERAL COMMENTS
NUMBER                         AFFECTED
===================================================================================
 -           20 June 2005       All       Initial draft

 -           30 June 2005       All       Preliminary       Reviewed by team

              3  May 2007       All       Initial Release   Updated to reflect
                                                            current pre-launch
                                                            mission profile and
                                                            firm plans for Initial
                                                            Checkout Phase

MCR-113429   12 October 2012   10 - end   Vesta Release     Updated to reflect the
                                                            current Vesta mission
                                                            profile and plans for
                                                            the Vesta approach and
                                                            orbital phases.

 -           26 March 2013      17-18,    PDS Vesta         Corrected errors
                                28-29     Peer Review       reported in the PDS
                                                            Vesta peer review.

 -           12 June 2013       All       Final Vesta       Editorial improvements
                                          Revision

 MCR-116421  31 Dec 2015        All       Revision B        Updated to reflect the
                                          Ceres Release     as-flown Vesta mission
                                                            profile and plans for
                                                            the Ceres phases.
=====================================================================================
2. Dawn Mission Plan, JPL D-25861, Revision D, Version 4.3, Oct 8, 2013.
3. Dawn Science Data Management Plan, JPL D-25901
4. Dawn Science Time-Ordered Listing Software Interface Specification
5. Ammannito, E., De Sanctis, M. C., Capaccioni, F., Teresa Capria, M., Carraro, F., Combe, J.-P., Fonte, S., Frigeri, A., Joy, S. P., Longobardo, A., Magni, G., Marchi, S., McCord, T. B., McFadden, L. A., McSween, H. Y., Palomba, E., Pieters, C. M., Polanskey, C. A., Raymond, C. A., Sunshine, J. M., Tosi, F., Zambon, F. and Russell, C. T. (2013), Vestan lithologies mapped by the visual and infrared spectrometer on Dawn. Meteoritics & Planetary Science, 48:2185�2198. doi:10.1111/maps.12192
6. J.D. Drummond, R.Q. Fungate, J.G. Christou, Full Adaptive Optics Images of Asteroids Ceres and Vesta: Rotational Poles and Triaxial Ellipsoid Dimensions, Icarus, 132 (1998), pp. 80-99
7. J.-Y. Li, J. Crepp, , G. Serabyn, L.A. McFadden, J. Williams, and C. Crow, Search For Satellites Around Asteroids With Coronagraphic High-contrast Imaging On Adaptive Optics, American Astronomical Society, DPS meeting #42, #39.30 (2010)
8. J.-Y. Li, P.C. Thomas, B. Carcich, M.J. Mutchler, L.A. McFadden, C.T. Russell, S.S. Weinstein-Weiss, M.D. Rayman, C.A. Raymond, Improved measurement of Asteroid (4) Vesta�s rotational axis orientation. Icarus, 211, 528-534 (2011)
9. J.-Y. Li, Vesta lighting conditions, personal communication, April 15, 2011.
10. J.-Y. Li, Ceres lighting conditions, personal communication, July 9, 2014.
11. M. K�ppers, et al., Localized sources of water vapour on the dwarf planet (1) Ceres, Nature, 505, 525-527 (2014)
12. L.A. McFadden, Bastien, F.A., Crow, C.A., Hamilton, D.P., Li, J., Mutchler, M.J., Search for Satellites of Vesta: Upper Limits on Size, American Astronomical Society, DPS meeting #41, #53.06 (2009)
13. J.W. Parker, L.A. McFadden, C.T. Russell, S.A. Stern, M.V. Sykes, P.C. Thomas, E.F. Young, Ceres: High-Resolution Imaging with HGA and the Determination of Physical Properties, Adv. Space Res., 38 (2006), 2039-2042
14. C.A. Polanskey, S.P. Joy, C.A. Raymond, Dawn Science Planning, Operations and Archiving, Space Sci. Rev. 163, 511�543 (2011)
15. C.A. Polanskey, S.P. Joy, C.A. Raymond, Efficacy of the Dawn Vesta Science Plan. 12th International Conference on Space Operations 2012. (2012).
16. C.A. Polanskey, S.P. Joy, C.A. Raymond, M.D. Rayman, Architecting the Dawn Ceres Science Plan. 13th International Conference on Space Operations 2014. 10.2514/6.2014-1720 (2014)
17. T.H. Prettyman, et al., Elemental Mapping by Dawn Reveals Exogenic H in Vesta�s Regolith., Science, 338, 242-246 (2012)
18. M.D. Rayman, R.A. Mase. Dawn�s operations in cruise from Vesta to Ceres. Acta Astronautica, 103, 113-118, 64th International Astronautical Congress, Beijing, China, (2014)
19. C.A. Raymond, R. Jaumann, A. Nathues, H.Sierks, T. Roatsch, F. Preusker, F. Scholten, R. W. Gaskell, L. Jorda, H-U. Keller, M. T. Zuber, D. E. Smith, N. Mastrodemos, S. Mottola. The Dawn Topography Investigation. Space Sci. Rev. 163, 487-510 (2011)
20. O. Sainte-Pe, M. Combes, F. Rigant, Ceres Surface Properties by High Resolution Imaging from Earth, Icarus, 105 (1993), pp. 271-281
21. P.C. Thomas, R.P. Binzel, M.J. Gaffey, B.H. Zellner, A.D. Storrs, E. Wells, Vesta: Spin Pole, Size, and Shape from HST Images. Icarus 128, 88-94 (1997)
22. P.C. Thomas, J.W. Parker, L.A. McFadden, C.T. Russell, S.A. Stern, M.V. Sykes, E.F. Young, Differentiation of the Asteroid Ceres as Revealed by its Shape, Nature, 437 (2005), pp. 224-226
ACE          Attitude Control Electronics
ACN          Ahead-Cross-Nadir pointing mode
ACS          Attitude Control Subsystem

ATLO         Assembly, Test, and Launch Operations

AU           Astronomical Unit

BGO          Bismuth Germanate

CBE          Current Best Estimate

CCD          Charged Coupling Device

CSS          Coarse Sun Sensor

CZT          Cadmium Zinc Telluride

ΔDOR         Delta Differential
             One-Way Ranging

DCIU         Digital Control Interface Unit

Dec          Declination

DRAM         Dynamic Random Access Memory

DSC          Dawn Science Center

DSN          Deep Space Network

EOM          End of Mission

EU           Ephemeris Update

FC           Framing Camera

FEE          Front-End Electronics

FOV          Field of View

FP           Fault Protection

FSW          Flight Software

FT           Flight Thruster for the ion propulsion
             subsystem (FT1, FT2 and FT3)

Gb           Gigabit(s)

GRaND        Gamma Ray and Neutron Detector

HAMO         High Altitude Mapping Orbit

HAMO-1       First High Altitude Mapping Orbit (Vesta only)

HAMO-2       Second High Altitude Mapping Orbit (Vesta only)

HED          Howardite, Eucrite, and Diogenite meteorites

HGA          High Gain Antenna

ICO          Initial Checkout

iFOV         Instantaneous Field of View

IR           Infrared (typically referring to the
             VIR infrared detector)

IPS          Ion Propulsion System

ISA          Incident, Surprise, and Anomaly Report

ISB          Integrated Sequence Build

JPL          Jet Propulsion Laboratory

kbps         kilobits per second

LAMO         Low Altitude Mapping Orbit

LGA          Low Gain Antenna

LLSW         Low-Level Software

MCA          Mars Closest Approach

MCR          Mission Change Request

MGA          Mars Gravity Assist

MOS          Mission Operations System

NASA         National Aeronautics and Space Administration

NAV          Navigation

NEAR         Near-Earth Asteroid Rendezvous

OBC          On Board Computer

OMM          Orbit Maintenance Maneuver

OpNav        Optical Navigation

PB           Playback

PDS          Planetary Data System (of NASA)

PLAR         Post-Launch Assessment Review

PP           Planetary Protection

PSF          Point Spread Function

R            Orbital Radius

RA           Right Ascension

RC           Rotation Characterization

RCS          Reaction Control Subsystem

RWA          Reaction Wheel Assembly

SA           Solar Array

S/C          Spacecraft

SciTOL       Science Time-Ordered Listing

SEP          Sun-Earth-Probe Angle

SEQGEN       Sequence Generator software

SLCK         Spacecraft Clock

SOA          Science Opportunity Analyzer

SoftSim      Software Simulator tool for modeling
             spacecraft flight software

SPC          Stereo Photoclinometry

SPICE        Spacecraft, Planet, Instrument, C-matrix,
Events

Stereo       Stereo Photogrammetry

TCM          Trajectory Correction Maneuver

TVC          Thrust Vector Control

TWTA         Traveling Wave Tube Amplifier

UDP          User Defined Program

U/D          Uplink/Downlink

U/L          Uplink

ULC          Unpressurized Logistics Module

VIR          Visible and Infrared mapping spectrometer

VIS          Visible (typically referring to the VIR
             visible detector)

VR           Virtual Recorder

VST          Vesta Scenario Test (simulated on Survey
             orbit on the flight system testbed)
1    Introduction...............................................................

2    Overview of the Dawn Mission...............................................

3    Dawn Mission Science Objectives and Data Collection........................

3.1      Overview...............................................................

3.2      Dawn Science Objectives................................................

3.3      Level-1 Science Objectives.............................................

3.3.1    Baseline Mission Success Criteria......................................

3.3.2    Minimum Mission Success Criteria.......................................

4    Launch to Vesta Cruise Activities..........................................

4.1      Initial Checkout Phase.................................................

4.2      Earth to Mars Cruise...................................................

4.3      Mars Gravity Assist....................................................

4.3.1    Mars Gravity Assist As-Flown Modifications.............................

4.4      Mars to Vesta Cruise...................................................

5    Vesta Science Activities...................................................

5.1      Vesta Science Overview.................................................

5.2      Vesta Approach.........................................................

5.2.1    Vesta Approach Trajectory Overview and Timeline........................

5.2.2    Vesta Approach Pointing Error Estimates................................

5.2.3    Vesta Approach As-Flown Modifications..................................

5.3      Vesta Survey Orbit.....................................................

5.3.1    Vesta Survey Trajectory Overview and Timeline..........................

5.3.2    Vesta Survey VIR Observations..........................................

5.3.3    Vesta Survey FC2 Observations..........................................

5.3.4    Vesta Survey Data Storage Plan and Data Allocations....................

5.3.5    Vesta Survey Pointing Error and Trajectory Error Margin Policies.......

5.3.6    Vesta Survey Resource Adaptation Guidelines............................

5.3.7    Vesta Survey As-Flown Modifications....................................

5.4      Vesta Transfer to the High Altitude Mapping Orbit 1....................

5.5      Vesta High Altitude Mapping Orbit 1 (HAMO-1)...........................

5.5.1    Vesta HAMO-1 Trajectory Overview and Timeline..........................

5.5.2    Vesta HAMO-1 Data Storage Plan and Data Allocations....................

5.5.3    Vesta HAMO-1 Resource Adaptation Guidelines............................

5.5.4    Vesta HAMO-1 As-Flown Modifications....................................

5.6      Vesta Transfer to the Low Altitude Mapping Orbit.......................

5.7      Vesta Low Altitude Mapping Orbit (LAMO)................................

5.7.1    Vesta LAMO Trajectory Overview and Timeline............................

5.7.2    Vesta LAMO Data Storage Plan and Data Allocations......................

5.7.3    Vesta LAMO Resource Adaptation Guidelines..............................

5.7.4    Vesta LAMO As-Flown Modifications......................................

5.8      Vesta Transfer to High Altitude Mapping Orbit 2........................

5.9      Vesta High Altitude Mapping Orbit 2 (HAMO-2)...........................

5.9.1    Vesta HAMO-2 Trajectory Overview and Timeline..........................

5.9.2    Vesta HAMO-2 Data Storage Plan and Data Allocations....................

5.9.3    Vesta HAMO-2 Resource Adaptation Guidelines............................

5.9.4    Vesta HAMO-2 As-Flown Modifications....................................

5.10     Vesta Departure........................................................

5.10.1    Vesta Departure As-Flown Modifications................................

5.11      Vesta As-Flown Results................................................

5.11.1    FC2 As-Flown Summary..................................................

5.11.2    VIR As-flown Summary..................................................

5.11.3    GRaND As-flown Summary................................................

6    Vesta to Ceres Cruise Activities...........................................

6.1      Vesta to Ceres Cruise As-Flown Results.................................

7    Ceres Science Activities...................................................

7.1      Ceres Science Overview.................................................

7.1.1    Impacts of All-RCS Operations on the Ceres Science Plan................

7.2      Ceres Approach.........................................................

7.2.1    Ceres Approach Trajectory Overview and Timeline........................

7.2.2    Ceres Approach OpNav and Science Observations..........................

7.2.3    Ceres Satellite Search Observations....................................

7.2.4    Ceres Approach Ephemeris Related Pointing Error Estimates..............

7.2.5    Ceres Approach Data Storage Plan and Data Allocations..................

7.2.6    Ceres Approach Resource Adaptation Guidelines..........................

7.3      Ceres Rotational Characterization 3 (RC3) Orbit........................

7.3.1    Ceres RC3 Trajectory Overview and Timeline.............................

7.3.2    Ceres RC3 Science Observations.........................................

7.3.3    GRaND Anneal During Ceres RC3..........................................

7.3.4    Ceres RC3 Data Storage Plan and Data Allocations.......................

7.3.5    Ceres RC3 Resource Adaptation Guidelines...............................

7.4      Ceres Transfer to Survey Orbit.........................................

7.5      Ceres Survey Orbit.....................................................

7.5.1    Ceres Survey Trajectory Overview and Timeline..........................

7.5.2    Ceres Survey Science Observations......................................

7.5.3    Ceres Survey Data Storage Plan and Data Allocations....................

7.5.4    Ceres Survey Resource Adaptation Guidelines............................

7.6      Ceres Transfer to High Altitude Mapping Orbit..........................

7.7      Ceres High Altitude Mapping Orbit (HAMO)...............................

7.7.1    Ceres HAMO Trajectory Overview and Timeline............................

7.7.2    Ceres HAMO Science Observations........................................

7.7.3    Ceres HAMO Data Storage Plan and Data Allocations......................

7.7.4    Ceres HAMO Resource Adaptation Guidelines..............................

7.8      Ceres Transfer to Low Altitude Mapping Orbit...........................

7.9      Ceres Low Altitude Mapping Orbit (LAMO)................................

7.9.1    Ceres LAMO Trajectory Overview and Timeline............................

7.9.2    Ceres LAMO Science Observations........................................

7.9.3    Ceres LAMO Data Storage Plan and Data Allocations......................

7.9.4    Ceres LAMO Resource Adaptation Guidelines..............................

7.10      Ceres Mission Summary.................................................

7.11      End of Mission........................................................

8    Science Descope Plan.......................................................

8.1      Vesta Science Descope Plan.............................................

8.1.1    Priority Scheme by Objectives and Level-1 Requirements.................

8.1.2    Tiered Priority Scheme.................................................

8.1.3    Descope Plan for Mission Replan........................................

8.2      Ceres Science Descope Plan.............................................

8.2.1    Priority Scheme by Objectives and Level-1 Requirements.................

8.2.2    Tiered Priority Scheme.................................................

8.2.3    Descope Plan for Mission Replan........................................

9    Science Time-Ordered Listing Spreadsheet Description.......................

10    Appendix..................................................................

10.1      Sequence Load Identification..........................................

10.1.1    Vesta Background Sequences............................................

10.1.2    Ceres Background Sequences............................................

10.2      Mission Change Requests (MCRs)........................................

10.2.1    MCRs Against the Vesta Science Plan (v4.6)............................

10.2.2    MCRs Against the Ceres Science Plan...................................

10.3      Incident, Surprise, and Anomaly (ISA) Reports.........................

10.3.1    Instrument ISAs Initiated During the Cruise Phase.....................

10.3.2    ISAs Associated With Science Data Acquisition During the Vesta Science Phase..

10.3.3    ISAs Associated With Science Data Acquisition During the Ceres Science Phase..

10.4     Safe_Mode and Safe_Comm Summary........................................
Figure 2�1. Dawn Mission Timeline...............................................

Figure 4�1. Initial Checkout Timeline...........................................

Figure 4�2. Mars Gravity Assist GRaND Observation Geometry......................

Figure 5�1. Vesta Mapping Phases Overview.......................................

Figure 5�2. Vesta Lighting Conditions for Baseline Trajectory
and Pole Location (Li, 2011)

Figure 5�3. Vesta Approach Geometry.............................................

Figure 5�4. Vesta RC3 Observation...............................................

Figure 5�5. Summary of Previous Vesta Satellite Search Results..................

Figure 5�6. Vesta Approach Satellite Search Mosaic..............................

Figure 5�7. Vesta Survey Timeline Overview......................................

Figure 5�8. Vesta Survey C1 and C3 VIR Pushbroom Observations...................

Figure 5�9. Vesta Survey C2, C4, C5, and C6 VIR Cubes...........................

Figure 5�10. Vesta Survey FC2 1x3 Mosaics.......................................

Figure 5�11. Vesta Survey Expected FC2 Global Coverage Versus
Phase Angle

Figure 5�12. Vesta HAMO-1 Ground Track and FC2 Images During 4
Orbits

Figure 5�13. Vesta HAMO-1 Mapping Strategy Schematic............................

Figure 5�14. Diogenite and Eucrite Spectra Resampled to FC
Filters

Figure 5�15. Vesta HAMO-1 Selected VIR Observations.............................

Figure 5�16. Vesta HAMO-1 Occultation Durations Versus Time for
Various Pole Locations

Figure 5�17. Vesta Transfer to LAMO Bonus Science Schematic.....................

Figure 5�18. Vesta LAMO 70-Day Timeline (With Extension)........................

Figure 5�19. Vesta LAMO Two Examples of Repeating One-Week
Timelines

Figure 5�20. Vesta LAMO Playback Pass and Gravity Tracking......................

Figure 5�21. Vesta LAMO Clear Filter Image Coverage (Incidence
<80°)

Figure 5�22. Vesta LAMO Color Filter (F2, F3, F4) Image
Coverage (Incidence <80°)

Figure 5�23. FC Filter Wavelength Response and LAMO Pixel Smear
and Point Spread Functions.

Figure 5�24. VIR LAMO Coverage Overview.........................................

Figure 5�25. Vesta HAMO-2 Timeline Overview.....................................

Figure 5�26. Combined Vesta HAMO-1 and HAMO-2 Stereo Coverage...................

Figure 5�27. Vesta HAMO-2 As-Flown ACN Angles per Cycle.........................

Figure 5�28. Vesta HAMO-2 VIR Coverage Including C0a and C0b....................

Figure 5�29. Vesta HAMO-1 FC2 Topography Imaging Coverage.......................

Figure 5�30. Vesta HAMO-2 FC2 Topography Imaging Coverage.......................

Figure 5�31. Vesta LAMO FC2 Imaging Coverage....................................

Figure 5�32. Vesta Survey and HAMO VIR Coverage.................................

Figure 5�33. GRaND Vesta Data Collection Timeline...............................

Figure 7�1. Ceres Mapping Phases Overview.......................................

Figure 7�2. Ceres Lighting Conditions...........................................

Figure 7�3. Dawn Hydrazine Budget...............................................

Figure 7�4. Ceres Hydrazine Usage per Sub-phase.................................

Figure 7�5. Illustration of FC "Reduced FOV"....................................

Figure 7�6. Ceres Approach and RC3 Observation Timing and
Geometry

Figure 7�7. Three Ceres Approach OpNavs.........................................

Figure 7�8. Ceres RC1 and RC2 Observation Geometries with
Instrument FOV

Figure 7�9. Ceres Approach OpNav with Ride-Along Satellite
Search Imaging

Figure 7�10. Ceres Approach Satellite Search 1 Imaging
Strategy

Figure 7�11. Ceres Approach Hypothetical Time Evolution of
Pointing for Satellite Search 1

Figure 7�12. Ceres Approach Dedicated Satellite Search 2 with
Turns to Off-Nadir Pointing

Figure 7�13. Ceres Approach Dedicated Satellite Search Imaging
Strategy

Figure 7�14. Ceres RC3 Orbit Activities and Attitude Profile....................

Figure 7�15. Ceres RC3 Observation Geometry with Instrument
FOV

Figure 7�16. Ceres RC3 South Equatorial Limb Observations with
FC2 and VIR FOV

Figure 7�17. Ceres RC3 North Equatorial Limb Observations with
FC2 and VIR FOV

Figure 7�18. Ceres RC3 Proposed Geometry for the High Phase
Observations

Figure 7�19. Ceres RC3 FC2 High Phase Observations..............................

Figure 7�20. Ceres Transfer to Survey OpNav 9 Geometry with
Instrument FOV

Figure 7�21. Ceres Survey Orbit Attitude Strategy...............................

Figure 7�22. Ceres Survey Planned Coverage for VIR Assuming
Perfect Pointing

Figure 7�23. Ceres Survey Planned Coverage for VIR with SoftSim
Pointing Predictions

Figure 7�24. Ceres Survey VIR Coverage with Perfect and
Predicted Pointing

Figure 7�25. Ceres Survey FC2 Nadir and Limb Observation
Examples

Figure 7�26. Ceres Survey FC2 Clear and Color Filter Imaging
Coverage

Figure 7�27. Ceres HAMO C1 FC2 Full and Reduced FOV.............................

Figure 7�28. Ceres HAMO Attitude Strategy.......................................

Figure 7�29. Ceres HAMO ACN Angles per Cycle....................................

Figure 7�30. Ceres HAMO Topography Coverage After Six Cycles
With Reduced FC2 FOV

Figure 7�31. Ceres HAMO FC2 Color Imaging Strategy..............................

Figure 7�32. Ceres HAMO FC2 Color Imaging Coverage..............................

Figure 7�33. Ceres HAMO Planned Coverage for VIR Assuming
Perfect Pointing

Figure 7�34. Ceres HAMO VIR Coverage with Time and Latitude for
Perfect Pointing

Figure 7�35. Comparison of Gamma Ray Experiments for Missions
at Different Target Distances

Figure 7�36. Ceres LAMO Hydrazine Cost as a Function of Beta
Angle

Figure 7�37. Ceres LAMO Attitude Strategy.......................................

Figure 7�38. Ceres LAMO Four Cycles of FC2 Observations.........................

Figure 7�39. Ceres LAMO FC2 Limb Imaging........................................

Figure 7�40. Ceres LAMO Planned Coverage for VIR Assuming
Perfect Pointing
Table 4�1. Initial Checkout Phase Instrument Activities.........................

Table 4�2. Pre-Mars Cruise Phase Instrument Checkout and
Calibration Activities

Table 4�3. Mars Science and Calibration Activity Timeline.......................

Table 4�4. Mars Gravity Assist Instrument Activities............................

Table 4�5. Mars to Vesta Cruise Instrument Activities...........................

Table 5�1.Vesta Orbit Sub-Phase Parameters......................................

Table 5�2. Vesta Approach Observations..........................................

Table 5�3. Vesta Approach Observation Pointing Errors...........................

Table 5�4. Vesta Survey VR Allocations for Instruments..........................

Table 5�5. Vesta HAMO-1 Pointing and Objectives for Each Cycle..................

Table 5�6. Vesta HAMO-1 VR Allocations for instruments..........................

Table 5�7. Vesta LAMO VR Allocations for instruments............................

Table 5�8. Vesta LAMO Data Allocations..........................................

Table 5�9. Vesta HAMO-2 VR Allocations for instruments..........................

Table 5�10. Vesta Mission Phase Dates and Reconstructed
Trajectory Kernels

Table 5�11. Vesta Mission FC2 Data Return Summary...............................

Table 5�12. Vesta HAMO-1 FC2 Color Filter Data Return...........................

Table 5�13. Vesta Mission VIR Science Data Return Summary.......................

Table 5�14. Vesta Mission GRaND Data Return Summary.............................

Table 6�1. Vesta to Ceres Cruise Instrument Activities..........................

Table 7�1. Ceres Orbit Sub-Phase Parameters.....................................

Table 7�2. Total Planned Spacecraft Turns at Ceres Compared to
the Vesta Mission

Table 7�3. Pointing Error Rates with All-RCS Attitude Control...................

Table 7�4. Ceres Planned FC2 Approach, RC3, and Transfer to
Survey Observations

Table 7�5. Ceres Planned VIR Approach, RC3, and Transfer to
Survey Observations

Table 7�6. Ceres Approach Ephemeris Related Pointing Errors for
Activities

Table 7�7. Ceres Approach Guidelines for FC2 Commanded
Compression Ratios

Table 7�8. Ceres Approach (Cruise 1) VR Allocations for
instruments

Table 7�9. Ceres RC3 FC2 Image Cadence for High Phase
Observations

Table 7�10. Ceres Science VR Allocations for instruments........................

Table 7�11. Ceres RC3 FC2 Data Allocation.......................................

Table 7�12. Ceres RC3 VIR Data Allocation.......................................

Table 7�13. Ceres Survey FC2 Data Allocation....................................

Table 7�14. Ceres Survey VIR Data Allocation....................................

Table 7�15. Dawn Topographic Mapping Constraints................................

Table 7�16. HAMO FC2 Color Filter Selection.....................................

Table 7�17. Ceres HAMO FC2 Data Allocation......................................

Table 7�18. Ceres HAMO VIR Data Allocation......................................

Table 7�19. Ceres LAMO FC2 Data Allocation......................................

Table 7�20. Ceres LAMO VIR Data Allocation......................................

Table 7�21. Comparison of Ceres and Vesta Science Data
Acquisition Plans

Table 8�1. Vesta Science Descope Plan for Mission Re-plan.......................

Table 8�2. Ceres Science Descope Plan for Mission Re-plan.......................

Table 10�1. Vesta Background Sequence Load Bundaries............................

Table 10�2. Ceres Background  Sequence Load Boundaries..........................

Table 10�3. Vesta Mission Change Requests.......................................

Table 10�4. Ceres Mission Change Requests.......................................

Table 10�5. Cruise Phase ISAs...................................................

Table 10�6. Vesta Phase ISAs....................................................

Table 10�7. Ceres Phase ISAs....................................................

Table 10�8. Spacecraft Safe_mode and Safe_comm Entries..........................
This document describes the plans for acquiring Dawn science data on the way to and in orbit about the two protoplanets 4 Vesta and 1 Ceres that are being visited by the Dawn spacecraft. It represents the high level plan for the Dawn mission science operations. The initial version of the plan was delivered during the assembly, test, and launch operations (ATLO) phase, four months before launch, and provided the template for ATLO testing of operations interfaces and procedures. The initial version of the science plan was consistent with Revision B of the mission plan (D-25861) released in June of 2007. An update to the science plan is developed prior to the arrival at each body. The Vesta release of the science plan documents the state of the Vesta science observation plan and mission design as they were understood on May 1, 2011, prior to the execution of the first Vesta approach observations. This version provides an as-flown update to the Vesta mission execution as well as launch and cruise instrument activities that have been completed. The Ceres information in this release, documents the final Ceres observation plan and mission design at the completion of the integrated sequence build (ISB) process. A final version with the actual Ceres mission dates will be released following the end of Ceres operations. The science plan flows down into a set of instrument sequences that are delivered during execution of the ISB process prior to formal spacecraft sequence development.
The Science Plan document defines the activities to be undertaken by each instrument in a time-ordered framework and identifies available resources and resource adaptation guidelines, including data playback to the ground. Resources include time, spacecraft attitude, data transfer, data storage in the instruments and the spacecraft dynamic random access memory (DRAM) system, and data transfer to the ground. A companion document, the Science Data Management Plan (D-25901), details the generation, validation, and transfer of the data archive to the Planetary Data System (PDS). Data handling on the ground is not covered in this document.
Section 2 gives an overview of the Dawn mission and available resources. Section 3 provides an overview of the science objectives and requirements. Section 4 presents details of the instrument data collection in the cruise from Earth to Vesta. Section 5 presents details of the science data collection for Vesta by sub-phase within the framework of the Level-1 science objectives. This information is also described in Polanskey et al. (2011, 2012). Section 6 presents details of the instrument data collection in the cruise from Vesta to Ceres. Section 7 presents details of the science data collection for Ceres by sub-phase within the framework of the Level-1 science objectives. Section 8 discusses modifications to the plan due to contingencies or descoping to the minimum mission, increasing the time at each body, and responding to unexpected anomalies. Section 9 provides a description of the Science Time-Ordered Listing (SciTOL) spreadsheet that defines instrument activities for each mission sub-phase. Section 10 contains appendices of reference material for spacecraft sequences and relevant anomalies.
The overall scientific goal of the Dawn mission is to achieve an understanding of the conditions and processes during one of the solar system�s first epochs. It achieves this by flying to and orbiting the main belt asteroids (protoplanets) Ceres and Vesta, orbiting Vesta for a period of not less than seven months and Ceres for not less than five months. At least one and a half months at Vesta are below a mean altitude of 200km, and at least one month of Ceres is below a mean altitude of 700km.
The launch period for Dawn opened on September 26, 2007 and the spacecraft launched on September 27, 2007 at 11:34:00.372 UTC. Dawn is an ion-propelled spacecraft capable of visiting multiple targets in the main asteroid belt. Dawn arrived at Vesta on July 16, 2011, and departed Vesta on September 5, 2012. In the ISB navigation plan, Dawn arrives at Ceres on March 29, 2015, where Dawn orbits until the end of the baseline mission. Dawn flew by Mars in February 2009 en route to Vesta.
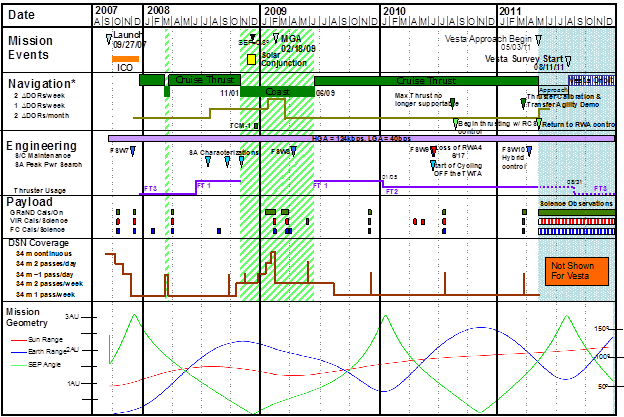
A high-level mission timeline is shown in Figure 2�1 for the launch date of September 27, 2007, the actual Vesta arrival and departure dates. The Ceres arrival date is that which is predicted in the ISB sequences. The top panel shows the major mission events. The bottom panel shows the mission geometry, with the red line indicating the Sun-Dawn range in astronomical units (AU), the blue line indicating the Earth-Dawn range in AU, and the green line indicating the Sun-Earth-Probe (SEP) angle. The instruments on the spacecraft are body mounted so the spacecraft rotates to point the instruments at the targets. All data are stored on board for playback to Earth, and in general only gravity science such as Doppler and range measurements are collected during tracking sessions. All data are transmitted to Earth within a few days of acquisition.
The mission phases covered by the science plan include initial checkout (Launch [L]+1 to L+80 days), interplanetary cruise phases, and Mars gravity assist (Mars closest approach [MCA] -90 to MCA+7 days), as well as the asteroid science orbits. Each science orbit phase begins with an approach sub-phase prior to capture. Approach to Vesta starts 74 days before capture, and Ceres approach starts 67 days before capture. Table 5-1 in Section 5 and Table 7-1 in Section 7 describe the orbit sub-phases at each target body in terms of their durations, beta angles (angle between Sun-body vector and the orbit plane), radii, and periods.
The Dawn spacecraft carries three science instruments. The data from these three instruments, when combined, provides information to characterize Vesta and Ceres. The instrument suite consists of redundant framing cameras (FC1 and FC2), a visible and infrared mapping spectrometer (VIR), and a gamma ray and neutron detector (GRaND). In addition to these instruments, radiometric and optical navigation (OpNav) data are used to determine the gravity field and thus bulk properties and internal structure of the two bodies.
The minimum mission (performance floor) for the Dawn mission reduces the time spent at Vesta and Ceres from seven months and five months, respectively, to four months at each body. At Vesta, the Low Altitude Mapping Orbit (LAMO) is eliminated, and the High Altitude Mapping Orbit (HAMO) will be at least 30 days. No reductions were necessary for the Vesta mission, and the mission duration was ultimately extended to 14 months as a result of the efficient cruise delivery to Vesta and a reduced estimate of the duration of cruise to Ceres. At Ceres, the lowest altitude orbit is eliminated in the minimum mission and the higher-altitude mapping orbit is lowered to 1380km and lengthened to be at least 30 days. It is possible that there will be several extra months available during the science orbit phase at Ceres, just as there was at Vesta. This extra time is used to enhance the science return from all of the instruments, but the priority is to increase the time spent in LAMO and potentially lowering the altitude of LAMO.
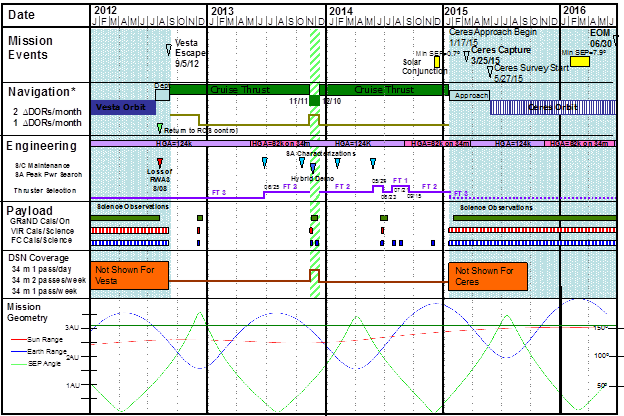
Figure 2�1. Dawn Mission Timeline.
Spacecraft anomalies may significantly reduce the time available for collecting data and affect the efficiency of data collection. Additionally, the significant uncertainty in the orbit transfer times dictate that plans include contingency to accommodate this uncertainty. The Science Descope contingency plan for responding to spacecraft safe mode entries and anomaly response conditions is included in Section 8. Information regarding spacecraft anomalies documented by Incident, Surprise, and Anomaly (ISA) Reports is found in Section 10.3. The list of spacecraft safe mode entries is found in Section 10.4.
In order to achieve the overall scientific goal of understanding conditions and processes acting at an early solar system epoch, the Dawn spacecraft images the surface of Vesta and Ceres to determine their bombardment, thermal, tectonic, and possibly volcanic history. Navigation data and imagery determines if the topography and internal structure of these two complementary protoplanets have remained intact since their formation by measuring the mass, shape, volume, and spin state of Vesta and Ceres. The mineralogical and elemental composition constrain the thermal history and compositional evolution, which is determined from infrared, gamma ray, and neutron spectroscopy. This provides additional context for meteorites, which are asteroid samples already in hand. Spectral information is used to search for water-bearing minerals.
To achieve the overall goal of the Dawn mission, a set of science objectives has been established that can be met by the instrument suite. These objectives are listed below.
The objectives primarily answered by the framing cameras are:
1. To determine the origin and evolution of Vesta and Ceres by mapping the extent of geologic processes on the asteroid surfaces, and by using the cratering record to establish a relative chronology of the crustal units and population of impactors in the early solar system
2. To map the shape, determine the spin state, and establish the degree of cratering of the asteroids visited
3. To map the topography of Vesta and Ceres
4. To search for dust and satellites in the environment of the asteroids visited
The framing cameras will also contribute to answering some of the broader objectives:5. To provide a geologic, compositional, and geophysical context for the Howardite-Eucrite-Diogenite (HED) meteorites.
6. To provide an opportunity to identify Ceres-derived meteorites in their geologic context.
The visible and infrared spectrometer scientific objectives are:
1. To provide a geologic, compositional, and geophysical context for HED meteorites
2. To provide an opportunity to identify Ceres-derived meteorites in their geologic context
3. To map the thermophysical properties of Vesta and Ceres
4. To determine the origin and evolution of Vesta and Ceres by mapping the mineralogical composition and its spatial variation across the asteroidal surface
The gamma ray and neutron spectrometer scientific objectives are:
1. To map the major elemental composition of O, Si, Fe, Mg, Ti, Al, Ca, and H on Vesta and Ceres
2. To map the trace elements U, Th, K, Gd, and Sm on Vesta and Ceres
3. To provide a geologic, compositional, and geophysical context for the HED meteorites
The gravity science scientific objectives are:
1. To determine the masses of the asteroids visited
2. To measure the bulk density of Vesta and Ceres, in conjunction with topography, and determine heterogeneity
3. To determine the gravitational fields of Vesta and Ceres
The Dawn mission achieves the scientific objectives listed above by meeting the science measurement requirements listed below. These requirements constitute the baseline and minimum mission success criteria (Level-1 requirements) that are established in Appendix 9 of the NASA Discovery Program Plan, appropriate to the baseline and minimum mission respectively.
The full capability of the Dawn mission shall be to:
1. Determine the bulk density of Vesta and Ceres to better than 1%.
2. Determine the spin axis orientations of Vesta and Ceres to better than 0.5 degrees.
3a. Determine the gravity field of Vesta to ≤ 90 km half-wavelength resolution.
3b. Determine the gravity field of Ceres to ≤ 300 km half-wavelength resolution.
4a. Obtain images of ≥ 80% of the surface of Vesta with a sampling of ≤100 m per pixel, and a signal-to-noise ratio of at least 50 in the clear filter and in ≥ 3 color filters.
4b. Obtain images of ≥ 80% of the surface of Ceres with a sampling of ≤200 m per pixel, and a signal-to-noise ratio of at least 50 in the clear filter and in ≥ 3 color filters.
5a. Obtain a topographic map of ≥ 80% of the surface of Vesta, with a horizontal spatial resolution of ≤ 100 m, and a vertical accuracy of ≤ 10 m.
5b. Obtain a topographic map of ≥ 80% of the surface of Ceres, with a horizontal spatial resolution of ≤ 200 m, and a vertical accuracy of ≤ 20 m.
6a. Measure and map the abundances of major rock-forming elements to ±20% precision with a spatial resolution equal to ~1.5 times the mapping altitude for the uppermost ~1 meter of the surface of Vesta and Ceres over the entire body.
6b. Measure and map the abundance of hydrogen in the top ~1 meter of Vesta and Ceres.
6c. Estimate the abundances and distribution of the radioactive elements Th, U and K and for the entire surface of Vesta and Ceres to ~1 meter depth.
7a. Measure and map the mineral composition of Vesta by obtaining ≥10000 high spectral resolution frames* from its surface at wavelengths between 0.25 and 5 microns with a spectral resolution of 2-10 nm. At least half of these spectral frames will be at a spatial resolution ≤ 200 m, and the remainder at a spatial resolution ≤ 800 m.
7b. Measure and map the mineral composition of Ceres by obtaining ≥8000 high spectral resolution frames from its surface in the visible and infrared (0.4 � 5 microns) with a spectral resolution of ≤ 10 nm and a signal to noise ratio of at least 5. At least half of these spectral frames will provide localized coverage from the High or Low Altitude Mapping Orbits (< 2,000 km altitude), and the remainder will provide regional-scale coverage from the Survey Orbit (< 5,000 km altitude).
The text in italics is an update to the VIR Level-1 requirements for Ceres.
* A spectral frame is defined as a two dimensional array with a line of spatial pixels in one dimension and a line of spectral samples in the other dimension.
The minimum capability of the Dawn mission shall be to:
1. Determine the bulk density of Vesta and Ceres to better than 1%.
2. Determine the spin axis orientations of Vesta and Ceres to better than 0.5 degrees.
3a. Determine the gravity field of Vesta to ≤ 200 km half-wavelength resolution.
3b. Determine the gravity field of Ceres to ≤ 400 km half-wavelength resolution.
4a. Obtain images of ≥ 80% of the surface of Vesta with a sampling of ≤ 100 m per pixel, and a signal-to-noise ratio of at least 50 in the clear filter and in ≥ 3 color filters.
4b. Obtain images of ≥ 80% of the surface of Ceres with a sampling of ≤ 200 m per pixel, and a signal-to-noise ratio of at least 50 in the clear filter and in ≥ 3 color filters.
5a. Obtain a topographic map of ≥ 80% of the surface of Vesta, with a horizontal spatial resolution of ≤ 100 m, and a vertical accuracy of ≤ 25 m.
5b. Obtain a topographic map of ≥ 80% of the surface of Ceres, with a horizontal spatial resolution of ≤ 200 m, and a vertical accuracy of ≤ 50 m.
6. Fully achieve either the objectives of (1) obtaining reflectance spectra at Vesta and Ceres, or (2) determining elemental abundances at Vesta and Ceres.
Seven days of non-thrusting coast periods per year are designated for activities incompatible with optimal thrusting, including a subset of the instrument calibration activities. These periods are used to perform functional, performance, and calibration tests of the instruments using stellar and planetary targets. The FC flight software (both the Low Level Software [LLSW] and the User Defined Program [UDP] Library) is updated as new capabilities or patches are required. The nine to 14 days of coasting are split into two similar periods at approximately six-month intervals. The FCs perform a functional test in each period and an extended calibration test once a year. VIR performs calibrations at each opportunity using stars, star clusters, and planets. GRaND has the opportunity to make adjustments to instrument parameters and to anneal the Bismuth Germanate (BGO) crystal. Continuous tracking is not required during calibrations.
The cruise to Vesta is divided into two phases, Earth to Mars cruise and Mars to Vesta cruise, separated by the Mars gravity assist phase (MGA). Following the Vesta science orbit phase there is an additional Vesta to Ceres cruise phase, which is described in Section 6.
The initial checkout (ICO) mission phase is for preparing for long-term ion thrusting. A secondary objective is turning on and performing initial checkout of the instruments using ground-in-the-loop commanding. Instrument checkouts during the 80-day period following launch are not exhaustive; only a minimal set of checkout activities are performed during the ICO to minimize interference with critical spacecraft checkouts. The plan is for each instrument to perform a functional, performance, and calibration test during ICO, and to perform interference and stray light tests during the post-ICO early cruise phase. A timeline of ICO instrument activities is shown in Figure 4�1.
For the timeline shown in Figure 4-1, activities are color-coded according to the sequence build schedule. The horizontal axis is time in days post launch. The amount of radiometric tracking is shown along the bottom of the plots with a label for the amount of tracking per day. FC2 was designated as the prime camera pre-launch, however, to facilitate a smooth transition in the event of a failure, the backup framing camera, FC1, is fully checked prior to Vesta arrival with appropriate margin. VIR and FC instrument activities are performed after L+20 days to avoid contamination of optical surfaces by spacecraft outgassing. GRaND activities are required to be performed no earlier than L+7 days to mitigate against arcing at high voltage due to the presence of outgassing residue. Instrument activities during ICO are not sensitive to launching on any particular day during the 21-day launch period because the planned activities can accommodate slightly degraded pointing, and are not highly sensitive to Sun-Earth-Probe (SEP) angle.
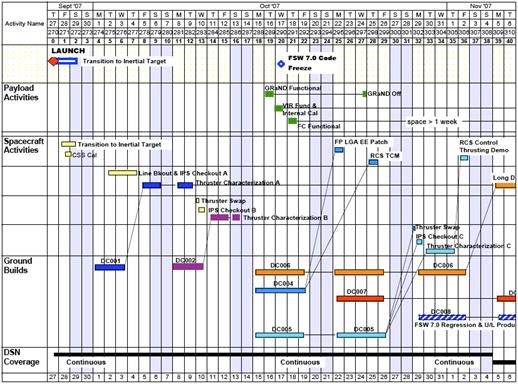
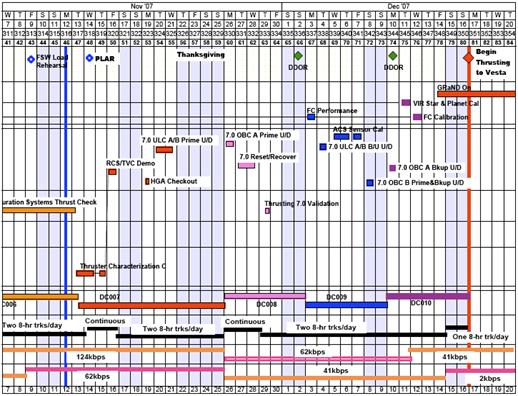
Figure 4�1. Initial Checkout Timeline.
Instrument checkout activities are not deemed critical activities during the prime ICO phase. If problems arose in completing the activities necessary to begin thrusting, instrument checkout activities would have been deferred until early cruise or later. This was the case with the stray light and interference tests and the FC1 performance and calibration, which were deferred to cruise. Table 4�1 lists the actual dates and background sequence assignments of the ICO instrument activities.
=========================================================================== Background Initial Sequence Checkout Instrument Activities Start Date End Date dc003 GRaND Functional Test 10/16/2007 10/21/2007 dc003 VIR Functional Test 10/17/2007 10/17/2007 dc003 FC2 Functional Test 10/18/2007 10/18/2007 dc009 FC2 Performance Test 12/03/2007 12/03/2007 dc010 FC1 Functional Test 12/10/2007 12/10/2007 dc010 VIR Calibration 12/11/2007 12/11/2007 dc010 FC1 CCD Calibration (Mini-Cal) 12/12/2007 12/12/2007 dc010 FC2 Calibration 12/13/2007 12/13/2007 ===========================================================================
Table 4�1. Initial Checkout Phase Instrument ctivities.
The FC1 activities in background sequence dc013 were deferred from ICO. The FC flight software (FSW) update (LLSW & UDP Library) are the first in a series of planned FSW updates for the camera. FC FSW updates are also planned prior to Vesta and Ceres orbital operations. The VIR star and planet calibration observed Canopus for 4 hours followed by a 3-hour observation of Mars. The FC mini-calibrations (Mini-Cals) in background sequence dc018 are the first execution of the standard semi-annual non-pointed checkout sequences. Dates for the Earth-to-Mars cruise activities are listed in Table 4�2.
===========================================================================
   Background                                             Start       End
   Sequence   Earth to Mars Cruise Instrument Activities  Date        Date
   dc013      FC1 Performance Test                        02/21/2008  02/21/2008
   dc013      FC1 Calibration                             02/22/2008  02/22/2008
   dc014      GRaND Background                            04/01/2008  04/10/2008
   dc014      VIR Star & Planet Calibration               04/02/2008  04/02/2008
   dc014      FC1 LLSW & UDP Library Update (3.03.02)     04/03/2008  04/03/2008
   dc014      FC2 LLSW & UDP Library Update (3.03.02)     04/03/2008  04/03/2008
   dc018      FC1 Mini-Cal                                08/26/2008  08/26/2008
   dc018      FC2 Mini-Cal                                08/26/2008  08/26/2008
   ===========================================================================
Table 4�2. Pre-Mars Cruise Phase Instrument Checkout and Calibration Activities.
The purpose of the MGA is to change the spacecraft trajectory to ensure adequate mass and power margins for the designed trajectory. The MGA has the potential to add to the scientific return of the mission by providing an opportunity for instrument calibration, and a readiness exercise for asteroid operations. Mars provides an absolute calibration of the GRaND instrument, and presents a valuable extended source for calibrating VIR and FC2. Unique and potentially valuable spectroscopy is performed by VIR. The Mars observations are also the first flight use of the science Cheby pointing mode. These pointed activities were expected to provide insight into the behavior and accuracy of the Cheby pointing mode and its application to asteroid operations. While valuable to operations, none of these activities are critical to achieving the goals of the mission.
An overview of the Mars observations is given in the timeline shown in Table 4�3. The reference trajectory used to develop the timeline is defined by the SPICE kernel dawn_ref_081031-090601_081201_dc022p1_v1.bsp with Mars Closest Approach (MCA) = 2009-049T00:27:04.374 or Feb 18, 2009, 00:27:04.374. The actual MCA time was 00:27:57.6 UTC. To satisfy sun-pointing constraints, the spacecraft +Z axis could not be pointed directly to Mars center during approach. The Mars approach observation geometry for GRaND is illustrated in Figure 4�2. The green triangle is the sub-spacecraft point and the orange triangle is the sub-reflection point.
===========================================================================
   Start Time relative to
   Mars Closest Approach    Mars Science and Calibration Activity Description (da023)
   MCA-2:31                 GRaND Closest Approach (using RA/Dec waypoints)
   MCA-0:07                 FC2 Smeared Flats and Extra Charge
   MCA+0:51                 VIR Mars Terminator
   MCA+2:00                 FC2 OpNav 1
   MCA+2:42                 FC2 Smeared Flats and Extra Charge (Mars center)
   MCA+3:05                 VIR South Pole (lit and dark)
   MCA+3:53                 FC2 OpNav 2 (2x2 mosaic)
   MCA+5:00                 FC2/VIR Cross Calibration (multicolor imaging)
   MCA+5:15                 FC2 Infield Stray Light
   MCA+6:40                 FC2 Departure Movie (26 hours - Mars center) -
                            includes VIR Cube at MCA+10:30
   MCA+33:40                FC2 Out of Field Stray Light
   MCA+35:30                First Mars data playback
   MCA+63:55                FC2 OpNav 3
   ===========================================================================
Table 4�3. Mars Science and Calibration Activity Timeline.
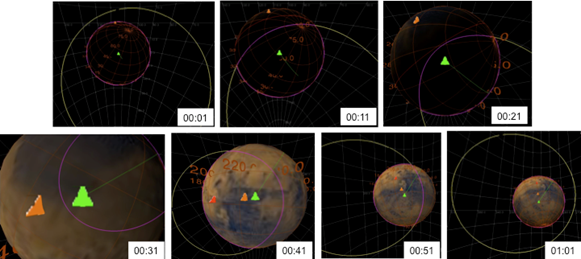
Figure 4�2. Mars Gravity Assist GRaND Observation Geometry.
The MGA Phase begins 90 days before MCA and consists of four background sequences that span the period of optimal coast around MCA, dc023 to dc026. MGA instrument activities are listed in Table 4�4.
   ===========================================================================
   Background  Mars Gravity        Instrument
   Sequence    Assist              Activities                         Start Date      End Date
   dc022       GRaND               Background   e01/20/2009           02/18/2009
   dc022       GRaND               Adjust & SCLK Mitigation           01/24/2009      01/24/2009
   dc023       GRaND               Mars Fly-by                        02/18/2009      02/18/2009
   dc023       FC2                 Mars Fly-by                        02/18/2009      02/18/2009
   dc023       VIR                 Mars Fly-by                        02/18/2009      02/18/2009
   dc024       GRaND               Background                         03/03/2009      03/27/2009
   dc024       FC2                 Filter Wheel Initialization        03/23/2009      03/23/2009
   dc024       VIR                 Cover Closed Verification          03/26/2009      03/26/2009
   dc024       FC2                 Stray Light Test                   04/01/2009      04/01/2009
   dc026       VIR                 Post Safe_comm Check Out           05/27/2009      05/27/2009
   ===========================================================================
Table 4�4. Mars Gravity Assist Instrument Activities.
Aside from the GRaND data collected in the vicinity of the MGA and five early FC2 images, none of the remaining Mars observations were successfully returned to the ground. The Dawn spacecraft entered one of Dawn�s safe modes 14 minutes after MCA on February 18, 2009 00:41:58.796 UTC as a result of an unexpected behavior of one of the star tracker error flags following the star tracker occultation by Mars (see Appendix 10.4). Only the data that were already in the spacecraft VRs could be returned to the ground since the other Mars data collected were lost when the instruments were powered off by fault protection. No VIR science data was returned. Several instrument activities were added to the dc024 and dc026 sequences to verify the health of VIR and FC2 after the spacecraft was returned to nominal operations.
Table 4�5 lists the Mars to Vesta cruise activities. In addition to routine maintenance, the instruments also validate operating modes needed at Vesta, perform special calibrations, and update flight software. GRaND performs a 5-day annealing of the cadmium zinc telluride (CZT) crystal used for one of its detectors prior to Vesta operations. Prior to the actual anneal activity, a short anneal demonstration in dc041 verified that the anneal heaters and thermostat operated as expected. Two additional FC FSW updates are performed during cruise to complete preparations for Vesta operations.
   ===========================================================================
                          Mars to Vesta Cruise
   Background  Sequence   Instrument Activities                       Start Date      End Date
   dc034       GRaND      Background                                  11/30/2009      12/07/2009
   dc034       VIR        Geometric Calibration #1                    11/30/2009      12/01/2009
   dc034       FC2        LLSW & UDP Library Update (3.04.02)         12/01/2009      12/01/2009
   dc034       FC1        LLSW & UDP Library Update (3.04.02)         12/02/2009      12/02/2009
   dc038       VIR        Geometric Calibration #2 with FC2           04/25/2010      04/26/2010
   dc038       VIR        Mass Memory Reconfiguration                 05/09/2010      05/11/2010
   dc041       GRaND      Background                                  07/19/2010      07/26/2010
   dc041       FC1        UDP Library Patch (3.04.02.01)              07/20/2010      07/20/2010
   dc041       FC2        UDP Library Patch & Calibration             07/20/2010      07/20/2010
   dc041       GRaND      Anneal Demonstration                        07/20/2010      07/20/2010
   dc041       VIR        Geometric Calibration #3 with FC2           07/21/2010      07/21/2010
   dc048       GRaND      Anneal                                      03/15/2011      03/20/2011
   dc048       VIR        Functional Test & Redundant Heater Demo     03/15/2011      03/15/2011
   dc048       FC2        FSW & UDP Library Update (3.05.01)          03/15/2011      03/15/2011
   dc048       FC2        Non-Pointed Checkout                        03/15/2011      03/15/2011
   dc048       FC1        FSW & UDP Library Update (3.05.01)          03/16/2011      03/16/2011
   dc048       FC1        Non-Pointed Checkout                        03/16/2011      03/16/2011
   dc048       GRaND      Background                                  03/21/2011      03/28/2011
   ===============================================================
Table 4�5. Mars to Vesta Cruise Instrument Activities.
Science data collected during the approach sub-phase, and in each of the science orbit sub-phases, satisfy the science objectives and measurement requirements specified above and in Appendix 9 to the Discovery Program Plan. The science orbit sub-phases are: Survey orbit, High Altitude Mapping Orbit-1 (HAMO-1), Low Altitude Mapping Orbit (LAMO), and High Altitude Mapping Orbit-2 (HAMO-2). The parameters of the Vesta orbit sub-phases are given in Table 5-1 and shown in Figure 5-1. The detailed timing of each phase is listed in Appendix 10.1.
The Survey orbit sub-phase provides the best global coverage for VIR spectral mapping and an overview of Vesta for the planning of subsequent sub-phases. The Survey orbit sub-phase lasts 21 days and starts at the end of the Vesta Approach sub-phase when the spacecraft establishes a circular polar orbit at a radius of 3000km. The HAMO sub-phases are primarily used for the optical mapping and reflectance spectral sampling of Vesta�s surface. The required Level-1 science for the HAMO sub-phases are multi-color surface maps (clear and three filters) of 80% of the surface, a topographical map of 80% of the surface, and acquire at least 5000 VIR spectral frames. The first HAMO sub-phase, HAMO-1, takes 34 days to complete and starts at the conclusion of the Survey to HAMO-1 transfer when the spacecraft achieves a circular near-polar orbit at 950km mean radius. The LAMO sub-phase provides gamma ray and neutron spectra and highest-resolution gravity field measurements. The baseline LAMO sub-phase lasts 70 days and begins when the spacecraft establishes a circular polar orbit with a 475km mean radius. Any remaining design and operations margin are used to extend the duration of LAMO. Following LAMO, a second HAMO sub-phase, HAMO-2, also at 950km mean radius acquires images of areas that are not well illuminated during HAMO-1. This increases the percentage of the surface mapped sufficiently well to achieve the topography Level-1 Science requirements. During Vesta departure, the spacecraft briefly stops thrusting above the Survey Orbit, acquiring data in the newly illuminated northern hemisphere. The lighting conditions for each sub-phase (represented by striped boxes) are shown in Figure 5�2.
Table 5�1.Vesta Orbit Sub-Phase Parameters.
   ===========================================================================
   Sub-phase                               Duration (days) Beta Angle (deg)  Orbit Radius (km)  Orbit Period (hrs)
   Vesta Approach to Survey Orbit          100.1           -                 -                  -
   Vesta Survey Orbit                      20.5            10                2997               69.0
   Transfer from Survey Orbit to HAMO-1    28.5            -                 -                  -
   Vesta HAMO-1                            34.1            30                947                12.3
   Transfer from HAMO-1 to LAMO            40.4            -                 -                  -
   Vesta LAMO                              70.0            45                475                4.0
   Design Margin  (extended LAMO)          4.0             -                 -                  -
   Operations Margin  (extended LAMO)      40.0            -                 -                  -
   Ceres cruise duration reduction         26.6            -                 -                  -
   Total Vesta LAMO                        140.6           -                 -                  -
   Transfer from LAMO to HAMO-2            44.9            -                 -                  -
   Vesta HAMO-2                            40.3            45-40             947                12.3
   Vesta Departure                         41.6            -                 -                  -
   TOTAL                                   490.8           -                 -                  -
   ===========================================================================
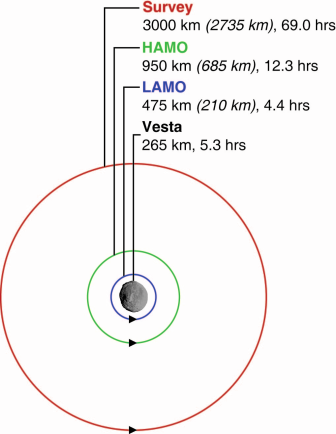
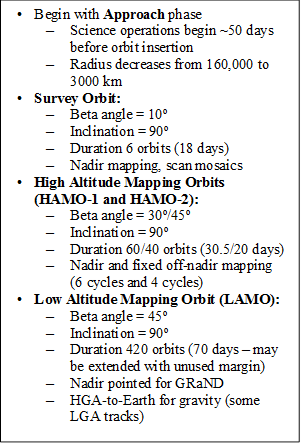
Figure 5�1. Vesta Mapping Phases Overview.
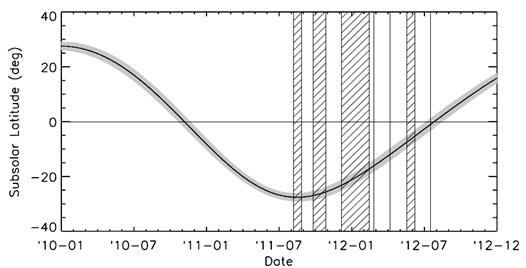
Figure 5�2. Vesta Lighting Conditions for Baseline Trajectory and Pole Location (Li, 2011).
The Vesta Science Plan development is guided by the following constraints and mitigations:
Constraint 1: Orbit prediction will be uncertain until very late in the sequence development process.
Mitigations for Constraint 1:
- Minimize observations targeted to specific features and focus on generic mapping.
- Link plan segments to geometric epochs that can readily be updated.
- Allow the maximum possible time for completion of all spacecraft turns (assume slews on the slowest spacecraft axis).
- Allow late updates to the ephemeris, epochs, and pointing if needed.
Constraint 2: The flight system does not easily support retransmission of science data from the spacecraft; therefore data lost due to Deep Space Network (DSN) problems must be reacquired.
Mitigations for Constraint 2:
- Build functional redundancy into the science data acquisition plan to avoid late changes to the plan to reacquire lost data.
- Create modular activity periods (cycles) that can be repeated or re-ordered.
Planning begins by balancing the surface coverage that can be obtained over a mapping sub-phase and the data volume that can be returned during the available playback passes. Engineering activities are included per mission requirements. The plan is then iterated with the instrument teams until the plan fits within the required margin requirements.
The primary activity of the Approach sub-phase is the collection of OpNav data using FC2. While these data are primarily for engineering uses, they are useful for determining Vesta�s albedo and the appropriate exposure durations for the various science observations during approach. VIR also collects data during several OpNav imaging opportunities in order to understand the instrument response to an extended body and the integration times required for other Vesta observations.
An additional activity during the Approach phase is exercising the data processing streams for the instruments, mainly VIR, FC2 and FC1, to verify that quick-look products are produced on the required timelines and checking and improving the calibration parameters.
The Vesta approach reference trajectory used to produce the analysis products shown here is dawn_ref_110419-110503_110404_da001_BGonly_v1.bsp and the near-approach geometry is shown in Figure 5�3. The panels in this figure are phase angle in degrees (top), distance from the spacecraft to Vesta center in kilometers (middle), and sub-spacecraft latitude in degrees (bottom). Vertical bars indicate various OpNav or science activities, with activity labels found either at the top of the figure or between the top and middle panels. Red bars indicate VIR ride-along observations and blue bars indicate ride-along satellite searches. GRaND is on throughout approach, collecting background counting rate data. Additional details regarding approach activities are provided in Table 5�2. Instrument pixel scale does not include smear.
Table 5�2. Vesta Approach Observations.
   ===========================================================================
   Observation                         Date(yyyy-mm-dd)      Duration (hh:mm)  Phase Angle (deg)     Vesta Distance (103 km)       FC2 Pixel Scale (km)     VIR Pixel Scale (km)
   OpNav 1                             2011-05-03            00:30             43                    1200                          115                      300
   OpNav 2 w/VIR                       2011-05-10            01:30             42                    1000                          93                       250
   OpNav 3                             2011-05-17            00:30             42                    810                           76                       205
   OpNav 4                             2011-05-24            00:30             41                    650                           61                       164
   OpNav 5                             2011-06-01            00:30             39                    480                           45                       122
   OpNav 6 w/VIR                       2011-06-08            01:40             37                    350                           33                       89
   OpNav 7                             2011-06-14            01:00             34                    270                           25                       68
   OpNav 8                             2011-06-17            01:00             33                    230                           22                       58
   OpNav 9                             2011-06-20            01:00             31                    190                           18                       48
   OpNav 10                            2011-06-24            01:00             29                    150                           14                       38
   OpNav 11                            2011-06-28            02:00             27                    120                           11                       30
   RC1                                 2011-06-30            05:30             25                    100                           9.5                      25
   OpNav 13                            2011-07-04            02:00             24                    75                            7.1                      19
   OpNav 14                            2011-07-06            02:00             23                    61                            5.8                      16
   Satellite Search Mosaics 1 & 2      2011-07-09            05:00             25                    45                            4.3                      11
   RC2                                 2011-07-10            05:30             25                    44                            4.2                      11
   Satellite Search Mosaics 3 & 4      2011-07-10            05:00             25                    43                            4.1                      11
   OpNav 16                            2011-07-13            02:00             32                    30                            2.8                      7.6
   OpNav 17                            2011-07-17            02:00             57                    16                            1.5                      4.1
   OpNav 18 w/VIR                      2011-07-18            02:10             78                    11                            1.0                      2.8
   OpNav 19 w/VIR                      2011-07-23            03:00             62                    5.3                           0.50                     1.3
   RC3 (Equator)                       2011-07-24            05:30             28                    5.5                           0.52                     1.4
   RC3b (South)                        2011-07-25            05:30             11                    5.8                           0.55                     1.5
   OpNav 21                            2011-07-26            01:15             60                    6.0                           0.57                     1.5
   OpNav 22                            2011-07-31            01:15             14                    4.1                           0.39                     1.0
   OpNav 23                            2011-08-03            01:15             80                    3.0                           0.28                     0.76
   C0 Equatorial Mosaic                2011-08-03            06:00             30                    3.0                           0.28                     0.76
   ===========================================================================
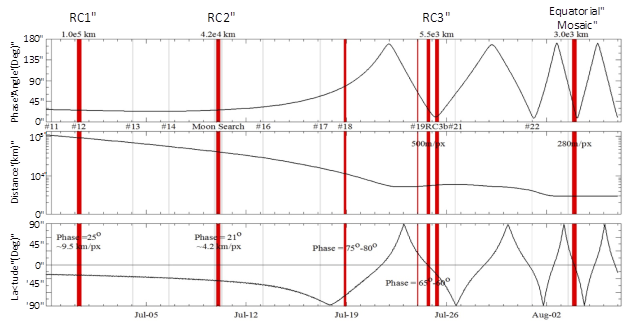
Figure 5�3. Vesta Approach Geometry.
The primary science observations during the Approach sub-phase are the three FC2 rotation characterization (RC) maps obtained at increasing resolution as the spacecraft approaches Vesta. The resolution of these maps increases from ~32km/pixel in the first RC (RC1) to ~6.5km/pixel in the second RC (RC2) to ~0.5km/pixel in the last RC (RC3) map. These resolutions equate to 2x, 4x, and 64x Hubble resolution. Clear filter images are acquired every 10°of Vesta longitude (8m 54s) using two different exposure times. One exposure time is optimized to resolve Vesta surface features and the other is optimized to resolve the background star field. The best pre-approach estimate of the Vesta rotational pole location is RA=305.8°±3.1°, DEC=41.5°±1.5° (Li et al., 2011). The stated error bars are one sigma. The RC observations incrementally improve the knowledge of the Vesta pole position during approach in order to improve the trajectory design.
In addition to the clear filter imaging, VIR obtains full-disc spectra. FC2 acquires a full pass through all color filters every 30° of longitude. The Approach phase data provides a range of illumination angles for testing exposure times, initializing the topographic model, and providing data aiding in finalization of the plans for HAMO-1, LAMO, and HAMO-2. Figure 5�4 shows the RC3 observation. Vesta is shown with the false texture map developed by the OpNav team to simulate the Vesta topography in support of planning analyses. The spacecraft ground track is shown in green, the sub-spacecraft and sub-solar points are the black and red triangles respectively, and the terminator is the red line. The FC2 footprint is the larger box, and the VIR footprint is the smaller box. These footprints are yellow when on the background sky and magenta when on Vesta. Note that while the spacecraft is in a polar orbit, the spacecraft ground track traces around the equator in this figure because the Vesta rotation period of 5.3 hours is significantly less than the spacecraft orbit period of several days.

Figure 5�4. Vesta RC3 Observation.
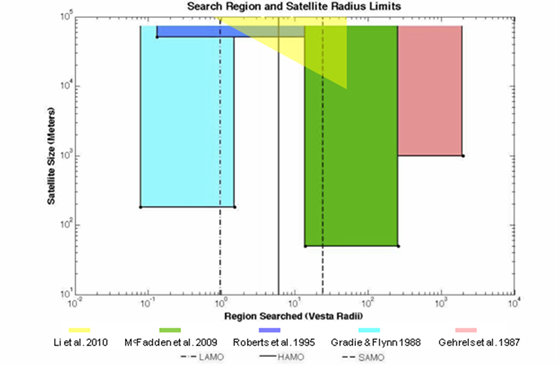
Figure 5�5. Summary of Previous Vesta Satellite Search Results.
During the Vesta Approach period, a satellite search is executed in the near-Vesta environment. Preliminary analysis showed that a framing camera search for satellites, using 2x2 image mosaics and covering the entire Hill sphere, requires a Vesta range of approximately 1.4x10⁶km during the pre-Approach cruise sub-phase. Further analysis showed that using Hubble Space Telescope was better for searching for any satellites of Vesta. The Hubble images indicated no satellites larger than 50m with Vesta�s albedo in the Hill Sphere, excluding the region inside of 15 Vesta radii (McFadden et al., 2009). A search closer to Vesta was conducted using the 200" Hale Telescope at the Palomar Observatory, employing a coronagraph to block light from Vesta (Li et al., 2010). The results of this investigation indicated no satellites larger than 100km within LAMO, larger than 20km within HAMO, larger than 5km within the Survey orbit, and none larger than 1km within the image field of view (FOV). To date, no Vesta satellites have been identified. Figure 5�5, modified from McFadden et al. (2009), summarizes the regions searched and the limiting satellite sizes from the various studies through 2010.
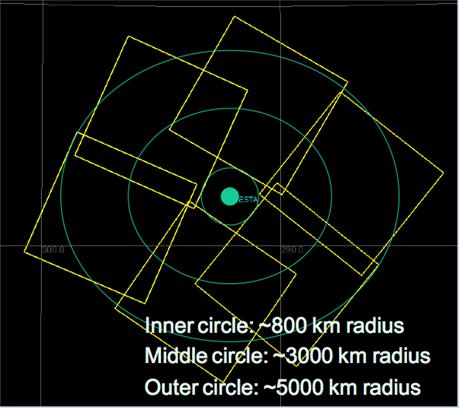
Figure 5�6. Vesta Approach Satellite Search Mosaic.
Dawn searches within the operational sphere inside of the 5000km range for Vesta satellites that are smaller than the detection limits of the previous studies. The Dawn satellite search observations occur during RC2 mapping. The target region is searched using a series of 3x2 mosaics using multiple exposure durations. The mosaics are repeated with time offsets on the order of 10, 100, and 1000 minutes to provide limited information about an orbit plane and radius of any object detected. Figure 5�6 shows an example of one of the 3x2 mosaics used in this search. Vesta is shown along with the RA/DEC grid and six FC2 sky prints (yellow squares). Each image station is 21 minutes long and consists of 4 sets of images with exposure durations of ~5s, ~20s, and ~4m30s. A region of roughly one Vesta diameter (3σ pointing error) around the asteroid is excluded from the mosaic in order to keep the asteroid out of the image during these long exposure images. The spacecraft requires 10 minutes to turn and settle between mosaic stations. Immediately after the first mosaic completes, a second mosaic is performed. Following the second mosaic is the 5.5-hour RC2 map. During RC2, four sets of four Vesta centered satellite search images are rapidly acquired using a moderate 1.5s exposure duration. These images will be co-added on the ground to effectively increase the exposure duration allowing for the possibility of detecting satellites in the inner exclusion region. Following RC2, the final mosaic is acquired.
Table 5�3 gives the predicted one-sigma pointing error associated with each of the approach activities in units of milliradians as well as FC2 and VIR pixels. Rows color coded in orange indicate observations that include VIR ride-along data. Columns two through four give the total pointing error in units of milliradians, FC2 pixels, and VIR pixels, assuming there is no ephemeris update (EU) on the spacecraft. The last column gives the apparent size of Vesta in VIR pixels (neglecting smear) assuming the onboard spacecraft ephemeris used is the one available at the time of the Pass 1 input to the sequencing process. Columns five through seven give the same information assuming that an EU is made during the uplink opportunity immediately prior to the observation. Columns eight and nine give the estimated pointing error in the direction of the VIR mirror scan.
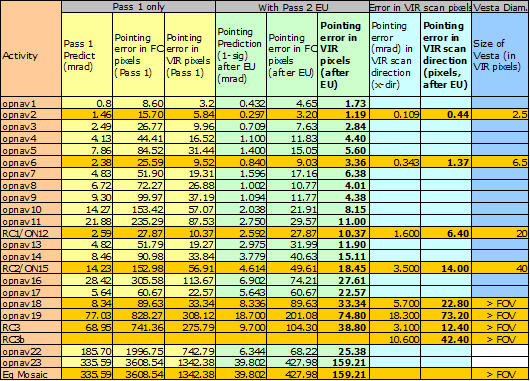
Table 5�3. Vesta Approach Observation Pointing Errors.
The primary modification of the approach plan was in response to the spacecraft safing event on June 27, 2011. The safing occurred three days prior to RC1, eliminating OpNav 11 (see Appendix 10.4); however, a rapid recovery allowed RC1 to execute as planned. The redesigned approach trajectory successfully achieved Vesta arrival on schedule although OpNav 14 was removed to provide additional thrusting time. The remaining FC2 activities executed as originally planned.
During RC1 execution, VIR reset while acquiring the third of 10 planned cubes, presumably as a result of a single event upset. Because the root cause of the reset was not immediately evident coupled with the knowledge that VIR or FC2 resets can invoke a spacecraft fault protection response on the flight system if the spacecraft attitude places the +Z axis of the spacecraft near the sun following a reset, all VIR ride-along observations with OpNav and the VIR RC2 sequence were removed from the plan. The revised approach thrusting profile following the previous safing recovery relied on thrusting with +Z near the sun for substantial portions of the approach trajectory so the VIR activities were considered to pose a risk. Following RC1, VIR participated in only OpNav 19, RC3, RC3b and the C0 equatorial mosaic approach activities. Standard VIR operations resumed at the start of the Survey orbit when the risk of being at an undesirable attitude for a VIR reset was retired. See Appendix 10.3 for other anomalies.
The science goals of the Survey orbit are obtaining global coverage with VIR and creating overlapping global images with FC2 in multiple filters. The Survey map constitutes the primary VIR global reference set. The FC2 maps are three to four frames each. The dispersion in viewing angle across the FC2 FOV at the Survey altitude provides both global stereophotogrammetry (Stereo) and stereophotoclinometry (SPC) coverage between adjacent overlapping images. These VIR and FC2 global maps are used to define regions of interest investigated at lower altitudes. The FC2 data contributes significantly to the development of the topographic model. Cross-calibration of the VIR and FC2 instruments are facilitated by concurrent imaging in this sub-phase.
The Vesta Survey reference trajectory is dawn_ref_110810-110827_100324_isb_survey.bsp. This trajectory and the observations that follow are based on the Thomas et al. (1997) pole. More recent Hubble Space Telescope observations of Vesta by Li et al. (2011) provide a different pole solution. Analysis of the impact of changing the science planning to use a spacecraft ephemeris based on the Li et al. (2011) pole indicates that the science objectives of the Survey observations are preserved, although there are minor differences in the illumination conditions. The reference trajectory does not reflect the mission change of adding a seventh orbit to Survey in order to provide the navigation team (NAV) with time to design the transfer to HAMO-1 trajectory and thrust plan. A timeline of activities during seven orbits at the Survey radius of 3000km is shown in Figure 5�7.
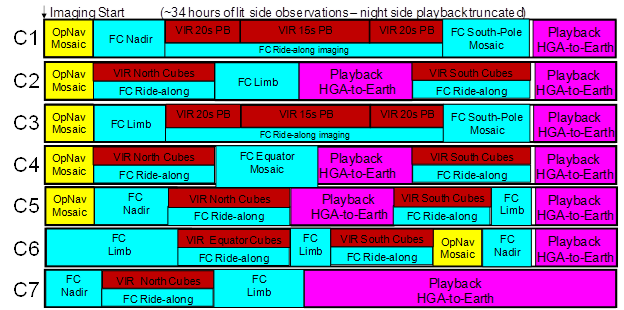
Figure 5�7. Vesta Survey Timeline Overview.
In this plan, observations are categorized into cycles where one cycle is equal to one spacecraft orbit. The observation strategy for the Survey cycles is to collect data that are functionally redundant in order to protect against the loss of any single observation. Functionally redundant observations are not truly identical but are designed to provide essentially the same data (e.g., same latitude band under similar lighting conditions but at different longitudes). Missed observations or data lost during transmission to the ground are not reacquired. Data collected in Cycles 1 and 2 (C1 & C2) are repeated in Cycles 3 and 4 (C3 & C4). The equatorial mosaic acquired during the late approach after Dawn is in orbit at the Survey altitude provides the redundancy for the mosaic in C4.
During the first and third Survey cycles, VIR acquires data in pushbroom mode with the spacecraft pointing the +Z axis (the spacecraft axis which aligned with the instrument boresights) towards Vesta but offset from nadir by 1.5° about the X-axis. This slight offset from nadir is required to give slit connectivity from one Vesta rotation to the next during the 13-hour pushbroom activity. Figure 5-8 shows the VIR coverage obtained during the C1 pushbroom activity. The VIR repetition time increases from 20 seconds to 15 seconds near the equator to improve slit connectivity. However, gaps between slits remain as shown in the expanded view on the right portion of Figure 5�8. C1 and C3 cover the same latitude band at different starting longitudes filling in most of the gaps between slits.
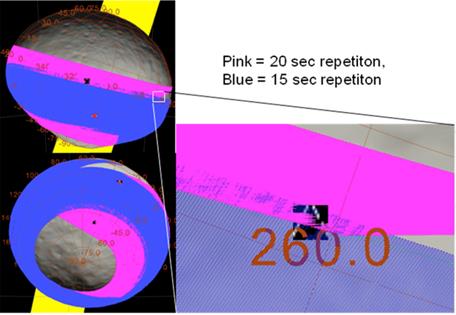
Figure 5�8. Vesta Survey C1 and C3 VIR Pushbroom Observations.
During C2 and C4 through C7, VIR uses its scan mirror to acquire cubes in the northern and southern hemisphere where the slit orientation is not well suited to pushbroom observations. Each set of VIR cubes cover at least one full Vesta rotation in order to completely cover the objective latitude band. The cube coverage for all cycles except C7, which repeats the northern cubes from C2, is shown in Figure 5�9. The magenta footprints show the equivalent of the total VIR scan mirror extent during cube acquisition. In reality, the VIR observations are broken into smaller cubes so that integration times can be adjusted for phase angle. In C2, cubes are acquired beginning at the dark to lit terminator (shown in the figure as a red line) and continue for slightly more than one Vesta rotation. There is a dayside playback to discharge VIR memory and then cubes are obtained in the southern hemisphere. This pattern is repeated in C4, with the cubes shifted slightly south relative to C2. C5 continues the southerly progression of the northern hemisphere cubes while resampling the same southern latitude band as C2. C5 and C6 cover the pushbroom latitudes using the scan mirror cube technique. In C6, there are two additional cubes taken at the south pole (not shown in Figure 5�9) to provide redundancy with the southernmost cubes in C4.

Figure 5�9. Vesta Survey C2, C4, C5, and C6 VIR Cubes.
FC2 acquires more than 2800 images during the Survey orbits, providing global coverage of the lit surface and limbs at a resolution of 260-280 meters/pixel. When VIR is acquiring data, FC2 is imaging Vesta in order to provide context images. Full sets of color images are acquired when the spacecraft is pointed nadir or near nadir during the VIR pushbroom observations and at the center time of most of the VIR cubes. Color images are not acquired during all VIR cubes in order to preserve the filter wheel life for use later in the mission.
During C1 and C3, FC2 acquires a 1x3 south polar mosaic as shown in Figure 5�10. The central nadir image station is sampled twice per mosaic in order to maximize surface coverage and longitude resolution. Equatorial mosaics are acquired during the late Approach sub-phase and in Survey C4 using the same 1x3 mosaic strategy.
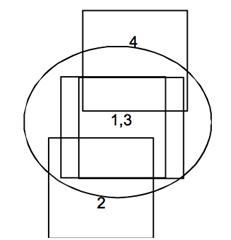
Figure 5�10. Vesta Survey FC2 1x3 Mosaics.
During every cycle, 20 limb images are acquired for OpNav purposes. Additional dedicated limb imaging observations also occur in C2 (equatorial), C3 (north), C5 (south), and twice in C6 (north, equatorial). Ride-along observations occur during some of the VIR cube observations, which provides additional limb coverage. There are nadir imaging observations not associated with VIR activities in C1 (north), C2 (south pole), C5 (north), C6 (south), and C7 (equatorial). These dedicated south polar and equatorial mosaics, when combined with the VIR ride-along imaging and other imaging opportunities, provide excellent global coverage of the entire illuminated surface of Vesta across the full range of phase angles. Figure 5�11 shows the redundancy of the planned global coverage of the surface in several phase angle bins. The color indicates the number of images, up to five, in each one degree latitude/longitude bin. Note that since the Survey orbit has a beta angle of 10°, there are no data at phase angles less than 10°.
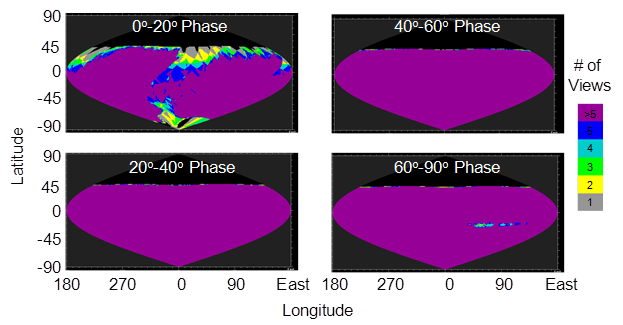
Figure 5�11. Vesta Survey Expected FC2 Global Coverage Versus Phase Angle.
Each instrument flushes its buffers into the spacecraft DRAM virtual recorders (VRs) assigned to each instrument. The instrument data storage allocations are listed in Table 5�4. Since VIR is prime in the Survey orbit, it receives the largest VR allocation. GRaND acquires data at the cruise science rate, which is more than adequate for the Survey orbit altitude. Given the small size of the GRaND and spacecraft engineering VRs, these recorders are emptied twice per cycle. The VRs are emptied at the beginning and end of each dark-side pass to prevent
   ===========================================================================
   Virtual Recorder   HK (VR3)    VIR (VR4)   GRaND (VR5)  FC2 (VR8)  OpNav (VR10)
   Allocation (Gb)    0.13        4.76        0.25         0.73       0.51
   ===========================================================================
Table 5�4. Vesta Survey VR Allocations for Instruments
overflow and data loss. FC2 data are mostly stored in instrument memory during the day-side acquisitions and then are threaded through the small VR by managing data flow on the spacecraft bus interface to throttle back the flow of data during playback periods. The bus interface is assigned to FC2 until the VR fills (~50%), then directed to VIR until the VR nearly empties (~10%). At the planning level, care is taken to not fill the FC2 VR too much to guard against downlink disruptions (station hand-over, etc.) while data are draining from the FC2 to the VR during playback. At the same time, given that the compression ratio 1.8:1 is quite conservative, the plan does not create periods where there are no data in the VR during playbacks. While VIR also dumps data from the instrument to the spacecraft while VIR data are being played back, the large VR allocation greatly simplifies the data flow. All data acquired during the Survey orbit are returned during the Survey orbit such that the transfer to HAMO-1 begins with empty VRs. Data acquisition during Survey C7 terminates near the dayside equator to playback and drain the VRs before the orbit transfer begins.
The data volume available for playback from the spacecraft during the Survey orbit is not as limited as the other Vesta orbit phases. The VIR science data consume the majority of the playback resources with 47% of the data budget while FC2 images take another 40%. GRaND, OpNav, engineering telemetry, and margin consume the remaining 13% of the data budget. The data budget uses compressions ratios of 1.8:1 for FC2 and VIR, which is quite conservative, especially for FC2. GRaND is on and collecting data for the majority of the time at Vesta. GRaND returns a small fraction of the data volume of the optical instruments.
The Survey orbit plan is designed to be relatively flexible with respect to probable large pointing and trajectory errors. The gravity field of Vesta is uncertain at the time that Dawn arrives in the Survey orbit. While the design is for an orbit period of ~68 hours, any orbit period between 64 and 72 hours is acceptable. The Survey orbit plan allows for up to 45 minutes of along-track error without needing to make an ephemeris update. Orbit update margin of 45 minutes is included on both sides of each turn between Vesta and Earth in order to accommodate these errors. In addition, there are at least four hours of playback margin on each night side pass to allow for orbit period adjustments. The use of a very conservative compression ratio for the images adds margin to the playback as well. Some of this margin must be used to bridge DSN station gaps and the disruption in the downlink signal when the communication link switches from noncoherent to coherent, but the remainder is available for orbit period adjustments. In addition to these other actions, the prime VIR data are returned before the FC2 data, and the FC2 data are prioritized before they are sent to the VRs. Should there be a loss of playback duration that is not covered by the margin available, the data that are lost should be the lowest priority FC2 images.
Three conditions must be met before the science operations support team can recommend leaving Survey orbit. The data from the first Survey cycle must be processed and validated to verify that the data is of expected quality, using the best calibration parameters available. The data from the second Survey cycle and part of the third cycle must be received on the ground and their integrity verified. It must be verified that the remaining data from the third Survey cycle is stored in the instrument and spacecraft VRs. Once these conditions are met, the decision is made to begin transfer to HAMO-1 when ready even though the remaining Survey data will be played back and additional Survey cycles are still planned.
The Survey sequences executed as planned with the exception of the VIR data acquisition strategy in C1, C3 and C7. VIR experienced an instrument reset partway through acquisition of the C1 pushbroom observations. Since exactly the same commanding was planned for C3, the VIR sequence was modified in an attempt to avoid a repeat of the reset. However, the root cause of the reset was uncertain and the sequence modifications were unsuccessful, resulting in a second VIR reset. Further modifications were made to the VIR C7 sequence, eliminating some of the previously planned data acquisition. This modification was successful, and VIR did not reset in C7. See Appendix 10.3 for other anomalies.
The orbit transfer period is dedicated to the thrusting required to change orbit from Survey to HAMO-1. Because the VRs are sized for science, the spacecraft plays back spacecraft engineering and GRaND data at least once every 48 hours during the transfer period. The playback provides the NAV team with critical tracking data that are used to determine the upcoming thrust arcs. In addition, there are OpNav imaging activities with nadir pointing every few days. The OpNav activities precede scheduled playback periods in order to minimize the impact to the thrust duty cycle and make the data immediately available for navigation analysis. Near the end of the orbit transfer, the NAV team requires long quiet periods for trajectory assessment. During quiet periods greater than 24 hours in duration, bonus science data are acquired. A single 7-hour bonus science observation includes both FC2 and VIR data acquisition. FC1 is also exercised with a pointed checkout at a nadir attitude. This is the only Vesta data acquired with FC1. Two checkouts of planned VIR HAMO observations are executed prior to HAMO arrival to validate HAMO data collection modes. The first is executed at an attitude with the high gain antenna (HGA) pointed toward the Earth, and the second is concurrent with the FC1 checkout at a nadir attitude.
The HAMO-1 subphase is primarily used to create global FC2 maps of the lit surface of Vesta from a nadir attitude in multiple filters and at least two maps from two different off-nadir viewing angles in the clear filter only. The Level-1 requirement is for 80% global coverage in three filters combining HAMO-1 and HAMO-2. The HAMO-1 plan acquires images of the entire lit surface in the clear filter plus seven filters. The FC2 clear maps from different viewing angles (nadir plus at least two off-nadir) and limb images are used to create a topographic model via Stereo and SPC. The off-nadir coverage is at angles of 10 to 20° from the surface normal.
VIR also collects over 5000 frames as part of the Level-1 requirements, but this is far short of global coverage. The VIR frames are collected concurrently with FC2 images when possible. The VIR data is collected to sample the spectral variability at smaller scales than the Survey map and to build high-resolution coverage of areas of interest. The VIR data is taken at nadir and off-nadir viewing angles using the scan mirror to tailor the viewing angle when the geometry is favorable.
The Vesta HAMO-1 reference trajectory is dawn_ref_110924-111025_100526_isb_hamo.bsp. This trajectory is 30 days long and does not reflect the mission change that increased HAMO-1 from 60 to 63 orbits. Data acquisition in HAMO-1 shows that it takes 10 orbits and about five days to create an FC2 map of all longitudes at 950km mean orbit radius. Each complete mapping of Vesta during HAMO-1 is called a cycle. Figure 5�12 is a Science Opportunity Analyzer (SOA) plot illustrating Vesta HAMO-1 mapping using FC2 while nadir-pointed in Cycle 1 (C1). Camera footprints on Vesta are shown in magenta on top of a false surface texture map. The terminator is shown in red and the ground tracks are shown in green. The orbit is polar. The apparent tilt of the orbit is an artifact of Vesta�s rapid rotation. Note that ground tracks from successive orbits are not adjacent, instead, they form a petal pattern that fills in over the 10-orbit cycle. The footprints at the top and bottom of Vesta are from other petals. The black triangle indicates the sub-spacecraft point at the time of the last footprint and the red triangle gives the sub-solar point.
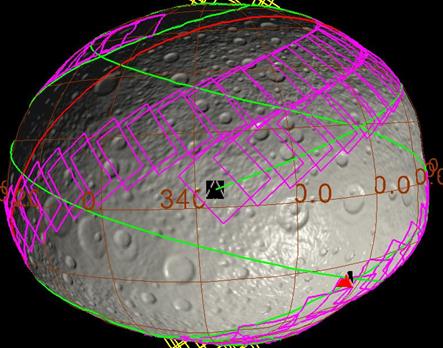
Figure 5�12. Vesta HAMO-1 Ground Track and FC2 Images During 4 Orbits.
The HAMO-1 plan is the most constrained of any of the orbit sub-phases. It is constrained by the limitations of the data downlink volume, the need to achieve systematic global coverage, and the need for resiliency to interruptions in the plan.
A high-level timeline of the original plan is shown in Figure 5�13. The 30 days of HAMO-1 mapping are split into six cycles, each consisting of 10 orbits and approximately five days in length. The first and last cycles are acquired at nadir and include color imaging. There is insufficient downlink and onboard memory capacity to store and return all of the camera data with lossless compression. The plan acquires images with the clear filter plus four color filters (F8 at 440nm, F3 at 750nm, F4 at 920nm, and F5 at 980nm) with lossless compression and then uses lossy compression (5.4:1) images for the remaining three filters (F2 at 550nm, F7 at 650nm, and F6 at 820nm) in the nadir cycles. The camera image cadence varies with latitude in each orbit. VIR acquires scan mirror cubes in the north and pushbroom data in the south. Following C1, there are two orbits dedicated to playback. These orbits are added to the plan to offset some of the impact of the long occultation intervals during the playback periods and to return most of the C1 color images to the ground. This provides a safeguard against an anomaly that would power off instruments, losing any data in memory at that time. C6 is at nadir pointing and includes color images that are losslessly compressed in four filters (F2 at 550nm, F7 at 650nm, F3 at 750nm, and F4 at 920nm) with the other three color filters having lossy compression. Note that the 820nm filter is not acquired with lossless compression in this strategy. Figure 5�14 shows the spectra of diogenites and eucrites resampled to the spectral peaks of the various FC2 color filters. The selection of filters acquired during C1 is used to define the amplitude of the central peak and the depth of the absorption band near 900nm.
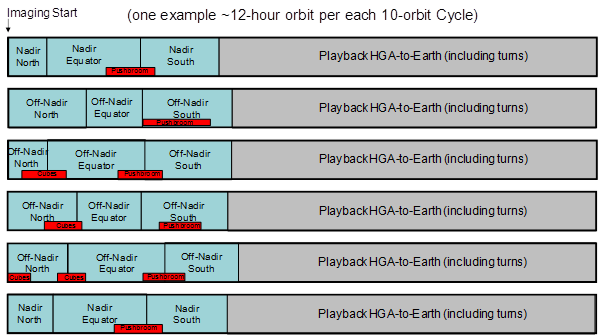
Figure 5�13. Vesta HAMO-1 Mapping Strategy Schematic.
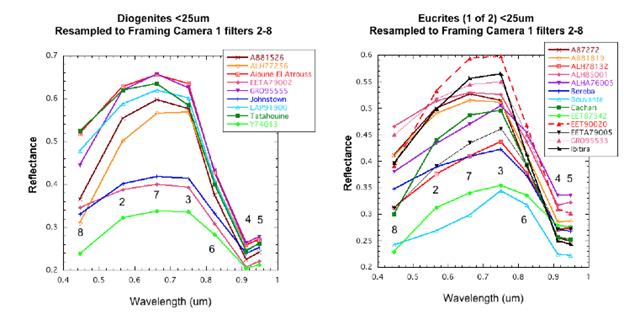
Figure 5�14. Diogenite and Eucrite Spectra Resampled to FC Filters.
Clear filter images are acquired at a different off-nadir angle in cycles C2 through C5 by using the Ahead-Cross-Nadir (ACN) pointing capability of the spacecraft. The ACN coordinate system has the A direction positive along the spacecraft velocity vector and the C direction is orthogonal to the positive velocity vector, such that A x C = N where N is the nadir direction. A single off-nadir attitude is used for data acquisition in each cycle and those angles are commanded as positive or negative angles in the direction of the A and/or C axes. The HAMO-1 and HAMO-2 off-nadir angles are optimized for Stereo analysis while still supporting SPC. The SPC method is able to combine HAMO-1 and HAMO-2 observations that are acquired with different illumination conditions, which is non-trivial for Stereo analysis. Table 5�5 gives the ACN angle offsets for each of the six HAMO-1 cycles, in addition to the science objectives for FC and VIR. Nadir pointing is specified as ACN ahead+0°, cross+0°. VIR acquires high spectral and spatial resolution data at the camera defined pointing throughout HAMO-1.
   ===========================================================================
   Cycle      Pointing              FC Science Objective                                                                      VIR Science Objective
   1          Nadir                 Clear and color filter imaging for petrology and weathering                               Pushbroom observations from 15°-40° South
   2          Ahead+8°,Cross+5°,2°  Clear filter SPC and Stereo topography - Cross angle is reduced in south polar lats.      Pushbroom observations from 10°-65° South
   3          Ahead-6° Cross+2°     Clear filter Stereo and SPC topography                                                    Terminator IR cubes, Northern hemisphere cubes, Pushbroom observations from 30°-50° South
   4          Ahead+5°              Clear filter Stereo topography                                                            Northern hemisphere cubes, pushbroom observations from 15°-45° South
   5          Cross-5°              Clear filter SPC topography                                                               Terminator IR cubes, pushbroom observations from 5°-25° South
   6          Nadir                 Clear and color filter imaging for lithology and mineralogy                               Pushbroom observations from 15°-40° South
   ===========================================================================
Table 5�5. Vesta HAMO-1 Pointing and Objectives for Each Cycle.
There is insufficient time and bandwidth available to completely map Vesta using VIR during the HAMO-1 sub-phase. The goal of the VIR investigation during HAMO-1 is to sample a portion of the surface from the terminator to as far south as the available playback and illumination conditions allow, with the bulk of the coverage focused on the southern crater walls and floor. In every cycle, VIR acquires data in pushbroom fashion in the southern hemisphere. The variety of different spacecraft orientations required for the FC2 mapping during HAMO-1 allows the VIR instrument to effectively use the pushbroom mode over a wide range of southern latitudes (~5 to 65° South). During C3 and C5, VIR acquires a set of small IR-only scan mirror cubes near the terminator. During C3 and C4, VIR acquires larger scan mirror cubes, using both the visible and IR detectors. The VIR observations are summarized in Table 5�5 and the southern pushbroom observations are shown in Figure 5�15.

Figure 5�15. Vesta HAMO-1 Selected VIR Observations.
The instruments flush their buffers into the VRs assigned to each instrument. The instrument data storage allocations are listed in Table 5�6. Most of the clear filter data are returning through the OpNav VR, while the color filter data are returning through the FC2 VR. Losslessly compressed images have a higher downlink priority than the lossy compressed images. To model the expected VR usage, the lossless compression ratio is assumed to be 1.8:1 for both VIR and FC2. The FC2 instrument will compress images to the maximum lossless compression ratio, however, if the lossless ratio is less than 1.8:1 the compression becomes lossy preserving the minimum compression ratio. VIR compression is always lossless with the minimum ratio being 1:1.
   ===========================================================================
   Virtual Recorder   HK (VR3)  VIR (VR4)  GRaND (VR5)  FC2 (VR8)  OpNav (VR10)
   Allocation (Gb)    0.13      2.72       0.25         2.06       1.0
   ===========================================================================
Table 5�6. Vesta HAMO-1 VR Allocations for instruments
HAMO-1 occurs at the maximum of the occultation season, as shown in Figure 5�16. The playback plan accounts for occultation durations of 55±5 minutes where the three-sigma uncertainty is primarily attributable to the propagation of the along track error over the two cycle duration of a sequence. There is also a view period gap of approximately 20 minutes between the Madrid and Goldstone complexes during the HAMO-1 time period. Since there are two playback intervals each day, every other playback period is likely to include a view period gap. The HAMO-1 data storage plan accommodates 80 minutes of known downlink disruption in every orbit, with an additional 15 minutes of margin for one-way to two-way transitions and other short duration outages. Since the phasing of the playback passes are not known until a few weeks before the beginning of HAMO-1, the gap associated with the view period gap is distributed over the two passes for each day for planning purposes.
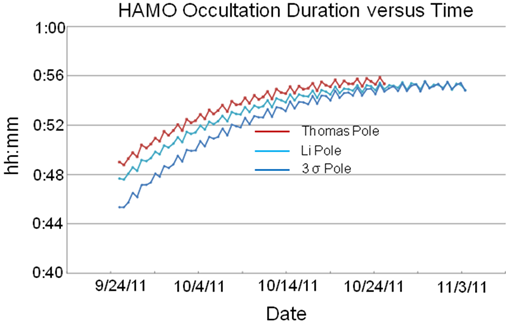
Figure 5�16. Vesta HAMO-1 Occultation Durations Versus Time for Various Pole Locations.
As previously mentioned, there are two orbits dedicated to playback following C1 and one orbit of playback following C6, prior to the start of the transfer to LAMO. The playback following C1 is necessary in order to determine if the transition to LAMO criteria are met on the time frame required to build the transfer-to-LAMO sequences. The additional benefit is that the FC2 color filter data goes to the ground, protecting the data against a spacecraft anomaly. However, the real benefactor of the playback orbits is VIR. The offloading of C1 data allows VIR to collect and return data in cycles C2 through C5, which would not be possible if the FC2 data are still onboard. The additional playback orbit after C6 is insufficient to return all of the data acquired during the cycle. Following this playback pass, all of the data acquired by VIR and FC2 are drained into the VR so that the instruments can be powered off, and the data are protected from spacecraft safing events. However, both VRs are filled to more than 60% capacity at the start of the transfer. The remaining data are returned during the routine engineering and OpNav playback periods in the transfer period.
The HAMO-1 orbit is critical for achieving global mapping of the surface of Vesta with FC2, which constitutes the geologic context for the investigations and provides the basis for the topography investigation. VIR coverage focuses on areas of high interest, such as the south polar crater. Like the Survey orbit, the HAMO-1 plan contains functional redundancy. The Level-1 requirement of obtaining global coverage in the three color filters plus clear filter is met or nearly met in C1. Global coverage in two off-nadir directions is complete by the end of C3. Meeting the Level-1 topography requirement is dependent on the completion of at least three cycles of HAMO-1 prior to the transfer to LAMO, or there being a reasonable expectation of completing the requirements in HAMO-2. The Level-1 topography requirement of mapping 80% of the surface cannot be met by using only data from HAMO-1 because not enough of the surface is sufficiently illuminated to perform either the Stereo or SPC analysis to generate topography at the required height accuracy. The HAMO-2 sub-phase is included in the Vesta plan to address this inadequacy. The remaining cycles provide redundant coverage that improves the likelihood of meeting or exceeding the Level-1 requirements.
The HAMO sequences began executing with different initial conditions than planned because GRaND was powered off in response to anomalous noise in the BGO channel (see Appendix 10.3.2) that was detected after the instrument was powered on following the safe mode entry on September 21, 2011 near the end of the transfer to HAMO-1 (see Appendix 10.4). GRaND returned to nominal operations by the end of C1; however, the playback plan was impacted due to the lack of new GRaND science data in VR5 resulting in some FC2 data loss from VR overflows. The playback plan was further complicated by the prioritization of VR4 playback over VR8 playback that prohibited the flight system from taking advantage of the better than expected compression performance of the FC2 OpNav data. Real time commands sent during HAMO reversed the priority of VR4 and VR8, removing inefficiencies from the playback process. There are additional data gaps in the FC2 C1 color data because the internal file limit in the FC2 flight software was exceeded due to the large number of highly compressed, low priority color images being retained in camera memory. Once this limitation was identified, the image prioritization scheme was modified for C6 and the remaining color data acquisition was nominal. Finally, the first orbit in HAMO C2 was not executed on the flight system because of an uplink error; however, the remaining nine C2 orbits executed nominally. There was negligible impact to the topography plan of one missing C2 orbit. See Appendix 10.3 for other anomalies.
Like the transfer to HAMO-1, the orbit transfer period is dedicated to the thrusting required to reduce the orbit altitude and change the orbit plane from HAMO-1 to LAMO. Because the VRs are sized for science, the spacecraft plays back spacecraft engineering and GRaND data at least once every 48 hours during the transfer period. The playback provides the NAV team with critical tracking data that are used to design the upcoming thrust arcs. In addition, there are OpNav imaging activities with nadir pointing every few days. The OpNav activities immediately precede playback periods in order to minimize the impact to the thrust duty cycle and to ensure the data are promptly available for use in navigational analysis. Towards the end of the orbit transfer, the NAV team requires long quiet periods to determine the orbit. Quiet periods greater than 24 hours in duration provide opportunities for bonus science data collection. A single bonus science sequence is used to acquire FC2 and VIR data whenever there is a quiet period of sufficient duration. There are two to three bonus science opportunities during the transfer to LAMO. In addition, whenever there is more than four hours of unused time at the end of a thrust arc, the project will command the spacecraft to a nadir attitude to allow bonus GRaND data collection. GRaND will also collect data during the extended quiet periods during the transfer.
Figure 5�17 shows the basic schematic of the transfer to LAMO bonus science activity. Bonus science activities begin and end with the HGA-to-Earth attitude. The activity begins three hours and thirty minutes before the dark to lit terminator crossing with VIR powering on. Fifteen minutes later, the spacecraft turns to nadir and begins thermal stabilization during the VIR cool down. The FC2 powers on or powers on the Front-End Electronics (FEE) if the instrument power is already on so that it can reach thermal equilibrium before imaging begins. Both instruments acquire two hours and fifteen minutes of nadir-pointed data beginning near the dark to lit terminator crossing during the lit side pass. FC2 acquires up to 140 images and VIR acquires up to 1500 frames. Instruments also use these opportunities to test out exposure durations and assess the impacts of smear on the LAMO data. All data acquired during the lit side pass are returned on the playback pass following data acquisition.
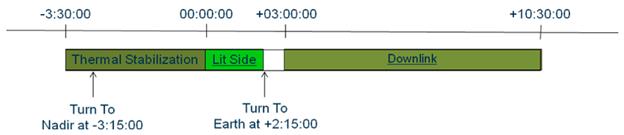
Figure 5�17. Vesta Transfer to LAMO Bonus Science Schematic.
The purpose of LAMO is to obtain spatially resolved neutron and gamma ray spectra of Vesta and global tracking coverage to determine the gravity field. Being nadir-pointed for at least 75% of the phase allows GRaND to collect the data planned for meeting the Level-1 requirements. Gravity data are obtained during the HGA tracking passes used to return science and engineering data. The gravity team also uses Low Gain Antenna (LGA) tracking data obtained while the spacecraft is nadir-pointed during early LAMO when the Sun-Earth-Probe angle is greater than 20°. The project requests an 8-hour 34m LGA pass at the DSN every day for at least the first 8 weeks, in addition to the HGA pass every other day. The goals of LAMO are to achieve a minimum of 1350 hours of GRaND data while pointed nadir and approximately 50 quiet gravity data tracks. The beta angle of LAMO is 45°.
The Vesta LAMO reference trajectory is dawn_ref_111203-120408_100601_isb_lamo.bsp. Figure 5�18 shows a 70-day LAMO timeline plus a 40-day extension, which is the entire Vesta operations margin. GRaND acquires prime data whenever the spacecraft is nadir-pointed. In LAMO, each week is a cycle. During the first eight cycles, FC2 acquires clear filter images of the surface while nadir pointed and gravity science acquires approximately seven hours and 45 minutes of data during the tracking passes. During the next four cycles, FC2 acquires color images and OpNav data. VIR acquires data in pushbroom mode throughout LAMO, but the number of frames per cycle decreases in the cycles with color imaging. The nominal LAMO duration is 70 days (10 cycles), with possible extension to 110 days (16 cycles). Figure 5�19 shows the selected one-cycle expansions of LAMO activities. During the first eight cycles (top), when the primary gravity data are being acquired, there are ride-along clear filter FC2 images acquired during roughly one-third of the orbits (cyan) with pushbroom VIR data (red) acquired in roughly one-fifth of the orbits. At the end of each cycle, there is a 12-hour orbit maintenance window (yellow). During cycles C9 through C12 when FC2 is acquiring color imaging, the number of VIR orbits are reduced. One orbit of clear filter OpNav images is acquired prior to each playback pass. FC2 color images (blue) from filters F2, F3, and F4 are acquired in 10 orbits per cycle and VIR data are acquired in four orbits per cycle.
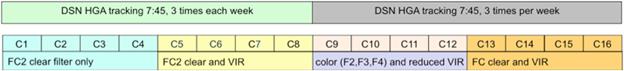
Figure 5�18. Vesta LAMO 70-Day Timeline (With Extension).
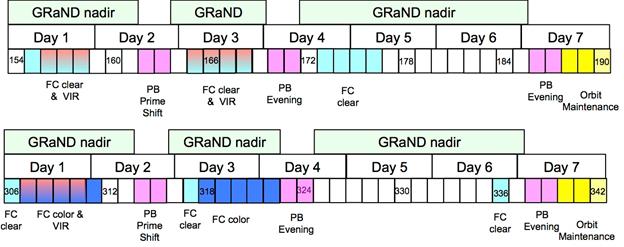
Figure 5�19. Vesta LAMO Two Examples of Repeating One-Week Timelines.
The LAMO playback and gravity data acquisition strategy is dictated by the presence and duration of radio occultations. In each orbit, there is an occultation that lasts for up to 35 minutes. Figure 5�20 shows the structure of a typical HGA pass during LAMO C1 through C8. Playback passes are timed to begin just after the end of the occultation (inner red arc). For the first 50 minutes of the pass, baseline tracking data are acquired (inner cyan arc), followed by a momentum wheel desaturation of up to 30 minutes (orange arc) followed by a spacecraft recovery period of at least 10 minutes (cyan). The gravity pass (green middle circle) begins following the recovery period and continues for six hours and fifteen minutes, interrupted by another occultation, and ending just before a third occultation would begin.
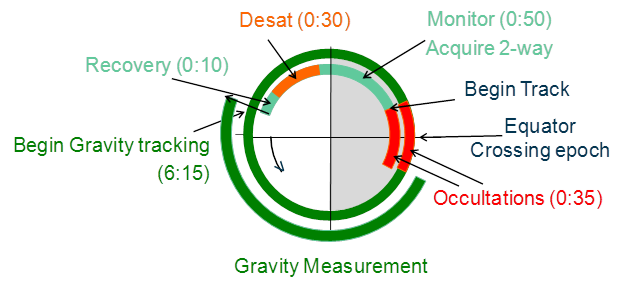
Figure 5�20. Vesta LAMO Playback Pass and Gravity Tracking.
Figure 5-21 shows the planned FC2 clear filter imaging coverage obtained during the nominal 70 days of LAMO, where the solar incidence angle is less than 80°. The color indicates the pixel resolution, which varies between 18-25 meters per pixel due to a combination of the irregular shape of Vesta and the orbit eccentricity. The numbers in the color bar give the percentage of total surface coverage with at least the resolution indicated. In order to obtain the surface coverage shown in Figure 5�21, the image compression ratio is increased to 3.8:1. This ratio is lossy, however, the images are useful for determining surface crater distribution.

Figure 5�21. Vesta LAMO Clear Filter Image Coverage (Incidence <80°).
Acquiring color filter imaging data during LAMO presents several challenges. The filter wheel has a limited number of qualified movements, and at least half of these are preserved for Ceres imaging. The large relative velocities of Vesta and Dawn makes smearing an issue, particularly when the exposure times are long, as is the case for many of the color filters. In order to minimize the number of filter wheel movements, only filters F2, F3, and F4 are acquired during LAMO in alternating wheel directions (2-3-4, 4-3-2). The color imaging objectives and strategies vary during different LAMO cycles. In the first two color imaging cycles, C9 and C10, the imaging passes begin at the dark to lit terminator crossing, end near the south pole, and have a cadence of three and a half minutes in all three filters. This strategy yields non-overlapping image footprints and provides samples over the full range of illuminated latitudes. During LAMO C11 and C12, the color filter imaging passes cover the region from the equator to the south pole, but at an increased image cadence that provides image overlap for most orbits. This strategy concentrates the color imaging in the southern hemisphere as shown in Figure 5�22, which shows polar projections (left is northern hemisphere, right is southern hemisphere) of the color imaging coverage with a similar color bar as in Figure 5�21.

Figure 5�22. Vesta LAMO Color Filter (F2, F3, F4) Image Coverage (Incidence <80°).
Smearing of the color images is another issue addressed by the LAMO color imaging plan. Figure 5�23 shows the filter response function versus wavelength (left) and the expected smearing in pixels (right). Filters F2, F3, and F4 provide a wide range of wavelength separation while maintaining acceptable smearing levels. The color filter data is compressed significantly in order to acquire and return color filter images during the limited playbacks. Color images are compressed twice, first by using an onboard 2x2 pixel-binning algorithm, then compressing the binned images losslessly (1.8:1). This brings the compression ratio to 7.2:1. Binning reduces the image resolution by a factor of two. This results in 36-50 meters per pixel resolution, which is still an increase in resolution over the HAMO color images by a factor of two. Given the large smearing in the LAMO color filter images, binning is considered to be a better solution than simply increasing the compression ratio in the raw images.
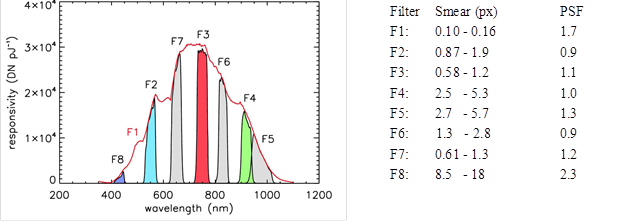
Figure 5�23. FC Filter Wavelength Response and LAMO Pixel Smear and Point Spread Functions.
VIR data are acquired during LAMO, but like the FC2 color imaging plan, the data are sparse and the global coverage is relatively low. Many LAMO spectra are acquired using only the central one-quarter of the VIR slit in pushbroom fashion. The individual slits are disconnected. Figure 5-26 shows the VIR coverage planned for 12 of the 16 cycles in extended LAMO. Each sequence shown represents two cycles of data acquisition. In Figure 5�24, the slit width and connectivity are highly exaggerated. There is no VIR coverage above 20° north latitude. Given the relatively high beta angle of the orbit required for mission safety, the phase angles in the northern hemisphere are not conducive to VIR data acquisition. The coverage is instead primarily in the southern hemisphere, concentrated near the south pole.
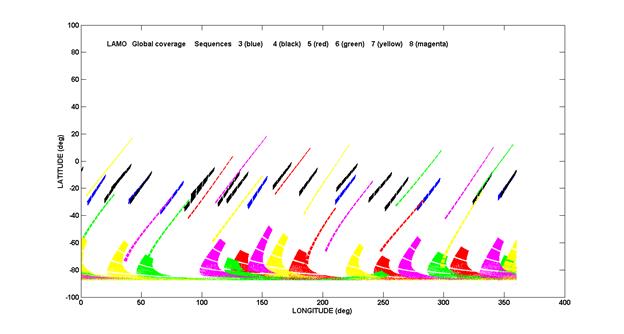
Figure 5�24. VIR LAMO Coverage Overview.
The GRaND VR (VR5) size is increased to 1.0Gb during LAMO to accommodate up to three days of continuous data acquisition while sampling every 70 seconds. The increase in VR5 size is accomplished by reducing VR4 to 2.48Gb and by reducing VR10 back to its nominal 0.51Gb size during science data acquisition. The instrument housekeeping VR (VR3) increases to 0.3Gb, taking its allocation from VR margin. LAMO VR allocations are listed in Table 5�7.
   ===========================================================================
   Virtual Recorder  HK (VR3)  VIR (VR4)  GRaND (VR5)  FC2 (VR8)  OpNav (VR10)
   Allocation (Gb)   0.3       2.48       1.0          2.06       0.51
   ===========================================================================
Table 5�7. Vesta LAMO VR Allocations for instruments
During LAMO, all of the data acquired during the first eight cycles are returned during that cycle. FC2 and VIR data are acquired during less than half of the orbits in LAMO because of the lack of playback time to return data from these instruments without taking away nadir-pointed time for GRaND observations. During the four cycles of nominal LAMO with color image acquisition, the images accumulate in FC2 internal memory for discharge and playback at a later date. In general, all of the VRs are empty once per cycle after the second playback, even with accumulation during the week. Because all of the filter wheel motions allocated to the LAMO phase are used during nominal LAMO, additional imaging is used to increase clear filter surface coverage. The LAMO data allocations are listed in Table 5�8.
   ===========================================================================
   Data Source        Data Allocation      Requirement
   GRaND              22.2%                Level 1 Science
   OpNav              13.4%                S/C Health and Safety
   Engineering Data   19.4%                S/C Health and Safety
   FC2                20.5%                Enhance Science
   VIR                24.5%                Level 1 Science
   TOTAL              100.0%
   ===========================================================================
Table 5�8. Vesta LAMO Data Allocations.
The pre-Vesta LAMO plan accommodates a 35-minute telemetry outage for Earth occultation in every playback pass plus 5 minutes of three-sigma uncertainty in the timing of the occultation. LAMO occurs towards the end of the Vesta occultation season so the actual duration of the occultations are less than the 35 minutes allocated as LAMO proceeds. By the end of LAMO, it is possible that there are not any occultations during the playback passes.
Before arriving at Vesta, the NAV team is not able to guarantee that it can predict the occultation start and end times to the planned five minute uncertainty due to the propagation of along track errors between orbit maintenance periods. Therefore, a conservative timing uncertainty of ±10 minutes was adopted to guard against the loss of playback data.
The LAMO sub-phase benefits from the unused operations margin remaining at the start of LAMO. Since none of the operations margin was needed during early Vesta operations, the full 40 days of operations margin were used to extend LAMO from 70 to 110 days. In addition, while planning the cruise to Ceres, new models of the electrical power that was available at greater heliocentric range increased ion thrusting potential from Vesta to Ceres, reducing the cruise duration. The project allocated part of that savings, 30.6 additional days, to further increase the length of LAMO bringing the total duration to 141 days (20 cycles) � double the original LAMO duration. Science data was collected for all instruments during the extension, which helped to mitigate time that was lost during two safe modes (see Appendix 10.4) and an extended period of solar energetic particle activity that impacted the quality of the GRaND science data for approximately a week.
FC2 lost a total of 544 images to the two safe modes (504 images lost in C6 and 40 clear filter images plus 9 color lost in C11). In addition, FC2 reset three times during LAMO operations. One reset occurred when the instrument had no data onboard, but the other resets resulted in the loss of 383 clear filter images (131 images in C1 and 252 images in C13). The primary VIR data loss resulted from the safe mode in C6, although small numbers of packets were lost in C7, C8, and C13 from DSN problems. See Appendix 10.3 for other anomalies.
As with all orbit transfer phases, the orbit transfer phase is dedicated to the thrusting required to change the orbit from LAMO to HAMO-2. Because the VRs are sized for science, the spacecraft plays back spacecraft engineering and GRaND data at least once every 48 hours during the transfer period. The playback provides the NAV team with critical tracking data that are used to determine upcoming thrust arcs. There are no OpNav activities in this transfer. Towards the end of the orbit transfer, the NAV team requires long quiet periods to determine the orbit. During quiet periods greater than 24 hours in duration, bonus science data are acquired. A single bonus science sequence is used for these appropriate quiet periods. Given that any bonus science opportunities are near the HAMO-2 altitude, the bonus science sequence from the Survey to HAMO-1 orbit transfer is repurposed for the HAMO-2 transfer science opportunities. There are no bonus science opportunities during the transfer to HAMO-2, although there is a FC1 non-pointed checkout required for routine instrument maintenance.
HAMO-2 is primarily used to complete global FC2 maps of the lit surface of Vesta in multiple filters from a nadir attitude and to complete maps in the clear filter from three different off-nadir viewing angles. The Level-1 requirement is for 80% global coverage in three filters. Since the surface south of 30° north is mapped in all available color filters, color images are only acquired in the northern hemisphere. FC2 clear filter maps from different viewing angles are used to complete the topographic model via Stereo and SPC. HAMO-2 is at the same altitude as HAMO-1, however, the beta angle increases from 30° to 45°. The off-nadir angles are selected to optimize Stereo since this technique is not able to utilize previously collected images, while the change in beta angle improves the overall SPC coverage.
VIR also collects data during HAMO-2, but even when combined with HAMO-1 data, VIR data falls short of global coverage. VIR frames are collected concurrently with FC2 images. VIR data collected are used to sample spectral variability at smaller scales than the global Survey maps and to build up high-resolution coverage of areas of interest. VIR data are taken at all spacecraft attitudes with favorable geometry.
The Vesta HAMO-2 reference trajectory is dawn_ref_120520-120609_100601_isb_hamo2.bsp. This trajectory is 20 days long and does not reflect the mission change that increases HAMO-2 from 40 to 41 orbits. HAMO-2 is designed to closely imitate HAMO-1 in all aspects except the beta angle, which would be costly to achieve below the LAMO beta angle.
Figure 5�25 shows an overview of the HAMO-2 mapping strategy, beginning with the three off-nadir mapping cycles and ending with a nadir cycle. During C1, VIR acquires IR-only cubes beginning at the terminator followed by a set of cubes using both the visible and IR detectors. These data are then dumped out of VIR memory so that VIR collects data in pushbroom mode starting north of the equator. FC2 collects clear filter images during C1 at an off-nadir ACN attitude of (8.0, 5.0). The FC2 image cadence is one image every five minutes in the equatorial region and once every eight minutes in the north and south regions. Off-nadir mapping continues in C2 at an ACN attitude of (-6.0, 2.0) with the same imaging cadence that is used during C1. VIR acquires visible and IR cubes in the northern hemisphere, dumps the data into the spacecraft virtual recorder, and then switches to pushbroom mode in the southern hemisphere. In C3, VIR acquires cubes in the northern hemisphere and is in pushbroom mode in the southern hemisphere while FC2 acquires clear filter images at an ACN attitude of (5.0, -2.0).
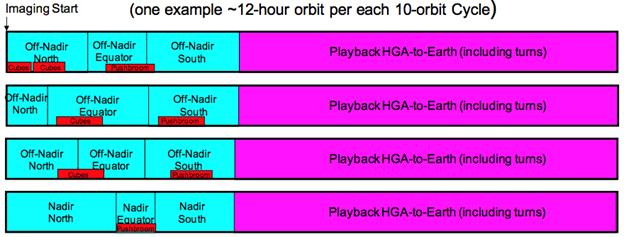
Figure 5�25. Vesta HAMO-2 Timeline Overview.
HAMO-2 nadir imaging is deferred to the end of the phase to allow the sub-solar latitude to maximize. C4 includes clear and color filter imaging in the northern hemisphere. The "north" region extends to the equator and the imaging cadence increases to meet the overlap requirements of equatorial imaging. Images in filters F8, F3, F7, F4, and F5 are collected with lossless compression 1.8:1 and filters F2 and F6 are acquired with lossy compression 3.6:1. In the equatorial and southern regions, only clear filter images are acquired. VIR acquires data in pushbroom mode only in the near-equatorial region.
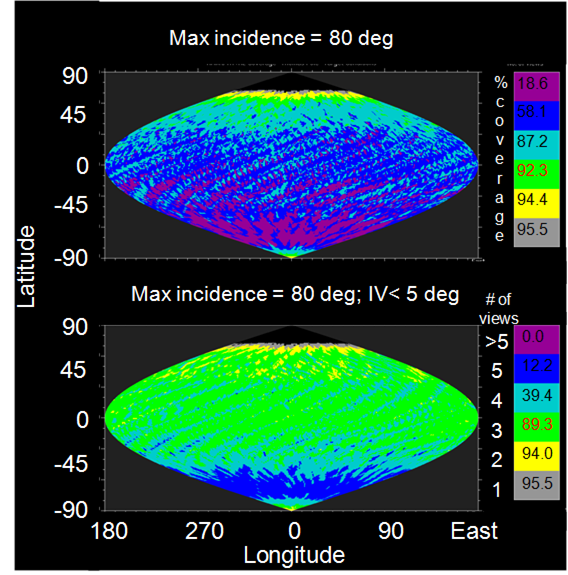
Figure 5�26. Combined Vesta HAMO-1 and HAMO-2 Stereo Coverage.
Figure 5�26 shows the combined HAMO-1 and HAMO-2 Stereo coverage. Color is used to show the number of images in each one degree by one degree bin that meets the Stereo requirements. The Stereo requirements are an incidence angle between 5° and 80°, an emission angle less than 80°, a stereo angle between 15° and 90°, and an illumination variation between 0° and 15° (top) or between 0° and 5° (bottom). The top panel shows that more than 87% of the surface is covered with at least four usable stereo views while the bottom panel shows that nearly 90% of the surface is covered by at least three views with very low illumination variation. The latter condition is critical in determining a high quality solution necessary to meet the Level-1 topography height requirement of 10 m. The project conducted a Virtual Vesta study to verify the imaging plan would satisfy the Level-1 requirements (Raymond et al., 2011). The OpNav team developed a simulated Vesta topography model and generated simulated images acquired at the times and illumination conditions planned in the HAMO-1 sequences. The simulated images were delivered to the topography investigators for analysis. After analysis, the FC team demonstrated they could achieve a mean height accuracy of six meters over regions of Vesta where there is coverage with low illumination variation.
There are no occultations during HAMO-2. The VRs are sized similar to HAMO-1 except that VR3 and VR5 were increased to allow for longer periods between tracking passes during the transfer to RC4. Following HAMO-2 but prior to Vesta Departure, there is a single playback orbit. The primary purpose of this playback orbit is to return color filter images acquired during C4, thus reducing the amount of data needing to be returned prior to departure.
   ===========================================================================
   Virtual Recorder    HK (VR3)  VIR (VR4)  GRaND (VR5)  FC2 (VR8)  OpNav (VR10)
   Allocation (Gb)     0.24      2.72       0.31         2.06       0.7
   ===========================================================================
Table 5�9. Vesta HAMO-2 VR Allocations for instruments
The filter imaging strategy can be altered to include the lossless compression of filter F2 and possibly even F6 if it is determined that the lossless compression ratio used earlier in the mission (1.8:1) was overly conservative. The duration of VIR data acquisitions in C1-C3 may also be increased if the imaging data compress better than modeled.
Direction was received from NASA authorizing the project to determine the appropriate Vesta operations plan to meet the mission coverage requirements in HAMO-2. The HAMO-2 plan benefited from the lessons learned from HAMO-1, as well as the additional time made available from the shortened Vesta to Ceres cruise trajectory that enabled a substantial increase in the Vesta mission duration. The initial four cycles were increased to six cycles to mimic the HAMO-1 architecture and C0, 17 orbits dedicated to VIR observations, was added to the beginning of HAMO-2. The primary goal of HAMO-2 was to observe the previously shaded regions of the north pole as the sub-solar point had moved towards the equator. Therefore, the delay of the HAMO-2 topography observations from the extension of LAMO and the addition of C0, provided improved observing conditions at the end of HAMO-2 when the sub-solar latitude had reached -2.5° South. Since color imaging was only needed in the northern latitudes, C1 contained only clear filter imaging. In addition, the C1 attitude strategy was modified to account for the non-spherical shape of Vesta by adding two slightly off-nadir angles in addition to nadir in each orbit, in an attempt to observe the surface from a truly nadir geometry (Figure 5�27). Finally, based on the imaging return from the first few orbits, additional images were added to the traverse of the north pole in cycles C4 through C6 to compensate for the Vesta shape and ensure that the pole was observed. The color filter strategy was also improved to reduce the number of filter steps required to obtain the final color map. There were no instrument anomalies in Vesta HAMO-2.
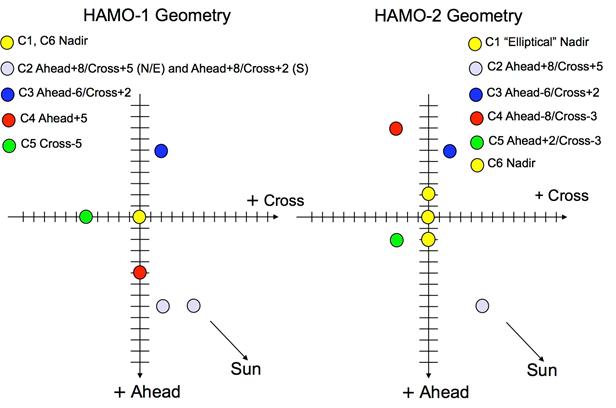
Figure 5�27. Vesta HAMO-2 As-Flown ACN Angles per Cycle.
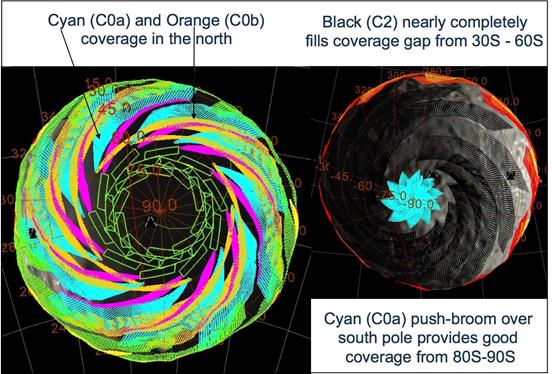
Figure 5�28. Vesta HAMO-2 VIR Coverage Including C0a and C0b.
The customized off-nadir angles in C0 provide the best viewing conditions for VIR. During the first 10-orbit ground track repeat cycle, C0a, VIR uses one off-nadir angle to observe in the north and then a very different angle to observe the south pole as requested by the Rheasilvia working group. The remaining orbits, C0b, are targeted at the remaining gaps in the northern hemisphere coverage. The C4 off-nadir angle changed from HAMO-1 to provide better viewing geometry for VIR and significantly better viewing geometry for SPC. The final plan for VIR coverage is shown in Figure 5�28.
During the Vesta Departure phase, thrusting is interrupted for about a day in order to obtain a final Vesta rotation movie, RC4, similar to the RC3 observation, at an altitude between 5000km and 6000km. The observation obtains a final set of global images and VIR spectra of the newly illuminated northern hemisphere before leaving Vesta. Data are acquired and returned to Earth before the VRs are resized for the Vesta to Ceres cruise phase.
The Vesta departure plan both increased and decreased in scope during operations. When it was apparent from the measured spin axis that the north pole would not be fully illuminated during HAMO-2, the RC4 plan was enhanced along with the addition of RC5 and RC6 later in departure. RC6 was intended to capture the fully illuminated pole. In addition, the FC team�s request of an infield stray light calibration with Jupiter and the science team�s request for high phase observations were added to RC4. However, loss of RWA3 prior to RC4 led to the descope of RC4 activities to only the north and equatorial rotations. RC5 and RC6 were eliminated.
The following section summarizes the as-flown Vesta mission. The actual mission timeline with corresponding spacecraft trajectory kernels is listed in Table 5�10. Primary changes from the science plan Rev A are listed in Appendix 10.2. The SPICE kernels are available online at http://naif.jpl.nasa.gov/pub/naif/DAWN/kernels/spk/.
   ===========================================================================
   Vesta Mission Phase      Start Date       End Date            Duration (days)   Reconstructed Trajectory Kernel (spk)
   Approach                 May 3, 2011      Aug. 10, 2011       100               dawn_rec_110416-110802_110913_v1.bsp
   Capture                  July 17, 2011    July 17, 2011
   Survey                   Aug. 11, 2011    Aug. 31, 2011       21                dawn_rec_110802-110831_110922_v1.bsp
   Transfer to HAMO-1       Aug. 31, 2011    Sep. 29, 2011       28                dawn_rec_110831-110928_111221_v1.bsp
   HAMO-1                   Sep. 29, 2011    Nov. 1, 2011        34                dawn_rec_110928-111102_120615_v1.bsp
   Transfer to LAMO         Nov. 1, 2011     Dec. 12, 2011       40                dawn_rec_111102-111210_120618_v1.bsp
   LAMO                     Dec. 12, 2011    April 30, 2012      141               dawn_rec_111211-120501_120620_v1.bsp
   Transfer to HAMO-2       April 30, 2012   June 15, 2012       45                dawn_rec_120501-120611_120625_v1.bsp
   HAMO-2                   June 15, 2012    July 25, 2012       40                dawn_rec_120611-120724_121101_v1.bsp
   Departure                July 25, 2012    Sep. 10, 2012       47                dawn_rec_120724-120913_121213_v1.bsp
   Escape                   Sep. 5, 2012     Sep. 5, 2012
   Total Mission            May 3, 2011      Sep. 10, 2012       496
   ===========================================================================
Table 5�10. Vesta Mission Phase Dates and Reconstructed Trajectory Kernels
FC2 returned approximately 95% of the data planned for the mission, and Table 5�11 summarizes the number of FC2 images commanded compared to the actual images returned for each Vesta sub-phase. The few percent of approach images lost were from OpNav 11 lost as a results of a safe mode entry. The 5% data loss in HAMO-1 is primarily from the late uplink of the C2 sequence. LAMO data losses were a combination of data lost from two instrument resets and two safe mode entries. Only minor amounts of data were lost from DSN station losses or other anomalies.
   ===========================================================================
         FC2 Vesta Image Return Summary
   Phase        Clear Filter Images      Color Filter Images      Total
                Planned       Actual     Planned      Actual      Planned     Actual       %
   Approach     1251          1211       700          697         1951        1908         97.8
   Survey       1128          1127       1554         1554        2682        2681         100.0
   Transfer     282           282                     282         282         100.0
   HAMO-1       2630          2557       4690         4425        6982        7320         95.4
   Transfer     200           200                     200         200         100.0
   LAMO         11184         10251      3480         3467        13718       14664        93.5
   HAMO-2       2800          2785       1960         1960        4760        4745         99.7
   Departure    132           132        119          119         132         132          100.0
   Total        19607         18545      12503        12222       32110       30767        95.8
   ===========================================================================
Table 5�11. Vesta Mission FC2 Data Return Summary.
FC2 Level-1 requirements are to obtain 80% coverage with at least three color filters. Color filter data was acquired in both C1 and C6. Table 5�12 lists the surface coverage that was successfully imaged for each of the color filters in both cycles as computed for the Vesta best-fit triaxial ellipsoid. The values highlighted in yellow were for data acquired with lossless compression. The remaining data was compressed at 5.4:1.
   ===========================================================================
   Filter            C1 Coverage %      C6 Coverage %      Combined Coverage %
   F2 (555 nm)       82.1               83.6              87.2
   F3 (749 nm)       81.5               83.6              87.2
   F4 (917 nm)       81.5               84.1              87.4
   F5 (965 nm)       81.6               80.2              87.3
   F6 (829 nm)       81.6               80.2              87.2
   F7 (653 nm)       81.5               80.2              87.3
   F8 (438 nm)       80.1               80.3              87.3
   ===========================================================================
Table 5�12. Vesta HAMO-1 FC2 Color Filter Data Return.
Figure 5�29 and Figure 5�30 show the FC2 topography data coverage for HAMO-1 and HAMO-2 , respectively. The largest data losses were experienced in C1 when the limit to the number of files that could be stored was exceeded and in C2 where the first orbit was lost when the FC2 sequence was not loaded on schedule. A few images were lost in C6 when the VR overflowed twice. The gaps between ground tracks were most significant in the nadir orbits. Gaps in C1 were intended to be filled by C6, but the orbits in the two cycles unexpectedly covered the same ground leaving gores that remained after HAMO-1. HAMO-2 coverage filled in those gores.
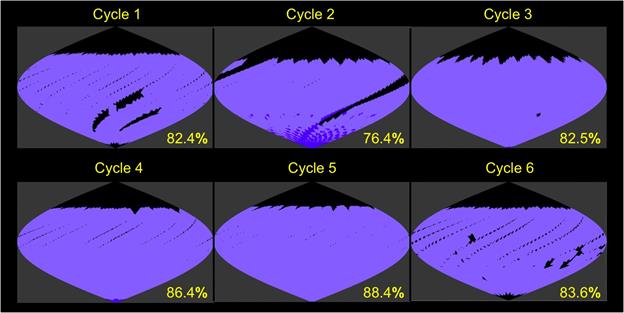
Figure 5�29. Vesta HAMO-1 FC2 Topography Imaging Coverage.

Figure 5�30. Vesta HAMO-2 FC2 Topography Imaging Coverage.
There are requirements to acquire FC2 imaging in the LAMO orbit beyond those needed for OpNav, and the LAMO orbit requirements did not optimize the ground track for imaging. However, the extended stay in LAMO provided an excellent opportunity to acquire bonus imaging over most of the illuminated surface. Towards the end of LAMO, imaging orbits were shifted in each cycle to attempt to fill in all gores; however, the LAMO orbit was not designed to a specific ground track repeat pattern so there was surface area that was never accessible to FC2 in a nadir attitude. Figure 5�31 illustrates the full FC2 LAMO data acquired. The colors indicate image resolution without smear. The equatorial regions had a minimum of 10-20 m/pixel while the south pole was covered at 20-30 m/pixel resolution.
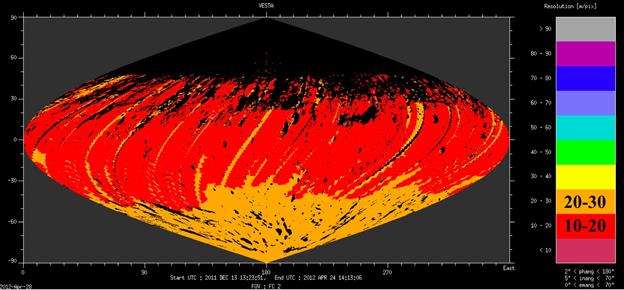
Figure 5�31. Vesta LAMO FC2 Imaging Coverage.
VIR returned approximately 94% of the data planned for the mission, Table 5�13 summarizes the number of VIR science frames (both visible and IR) commanded compared to the actual data return. Table does not include calibration frames or tests of instrument functions where the cover is closed. The significant data loss in Survey was the result of the VIR resets in cycles C1 and C3. LAMO data losses were primarily the result of two spacecraft safe modes.
   ===========================================================================
         VIR Vesta Science Data Return Summary
   Phase            IR-only frames        VIS-only frames        VIS+IR frames            Total
                    Planned   Actual      Planned    Actual      Planned       Actual     %
   Early Approach                                                960           496        51.7
   OpNav19 + RC3                                                 2,688         2,562      95.3
   C0 Mosaic                                                     561           517        92.2
   Survey           118       117                                16,180        12,928     80.0
   Transfer                                                      372           307        82.5
   HAMO-1           630       629                                20,900        20,340     97.4
   LAMO                                   3,840       2,880      6,272         5,755      85.4
   LAMO � slit                                                   18,768        18,765     100.0
   HAMO-2                                                        34,300        34,274     99.9
   Departure                                                     1,560         1,560      100.0
                                                     Total       107,149       101,130    94.4
   ===========================================================================
Table 5�13. Vesta Mission VIR Science Data Return Summary.
Figure 5�32 shows the total coverage achieved by VIR in Survey, HAMO-1 and HAMO-2 (Frigeri et al., in preparation). The largest unobserved region was in the north where the illumination conditions were inadequate for VIR data acquisition.
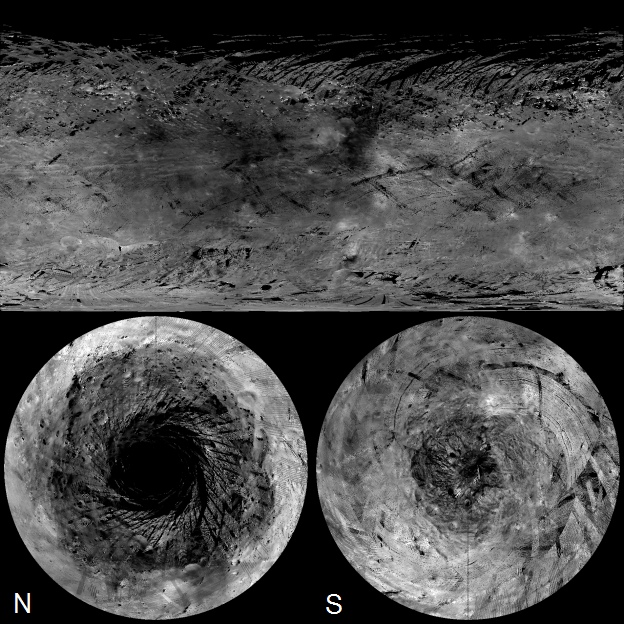
Figure 5�32. Vesta Survey and HAMO VIR Coverage.
The primary GRaND dataset was acquired during LAMO. GRaND exceeded the data collection goal of 1350 hours by 25%. The intent was to collect GRaND data at a nadir attitude for 75% of the time in LAMO. GRaND data collection was interrupted four times in LAMO, twice for spacecraft safe mode entries and twice for solar energetic particle events that corrupted the data quality. Table 5�14 summarizes the total GRaND data return. Science data records are excluded from the dataset if they were acquired when the spacecraft attitude was more than 5° from nadir or if there was interference from a solar energetic particle event. The gap between intervals IA and IIA is from a safe mode that was coincident with an energetic particle event. The gap between IIA and IB is from the second LAMO safe mode.
   ===========================================================================
   Data Collection Interval                                                Dates                                 Number of Science Records    Total Accumulation Time (days)
   IA                                                                      Dec 8, 2011 � Jan 14, 1012            37363                        30
   IIA                                                                     Feb 7, 2012 � Feb 22, 2012            14826                        12
   IB                                                                      Feb 28, 2012 � Mar 6, 2012            8819                         7
   IIB                                                                     Apr 2, 2012 � Apr 27, 2012            25962                        21
   Total (66% of planned accumulation)                                                                           86970                        70
   Goal before LAMO extension = 1350 hours                                                                                                    56
   Total potential accumulation = 141 days of LAMO (75% nadir duty cycle)                                                                     106
   ===========================================================================
Table 5�14. Vesta Mission GRaND Data Return Summary.
An illustration of the GRaND data timeline is shown in Figure 5�33. The usable nadir data is plotted in green while data acquired when the spacecraft was more than 5° off nadir are plotted in blue. Data corrupted by energetic particle events is plotted in red.
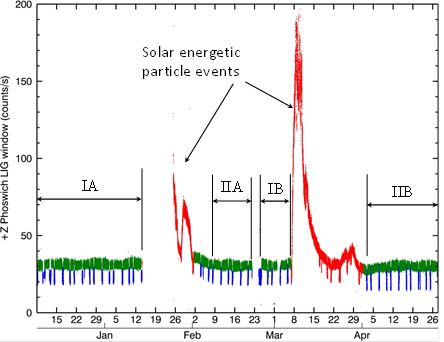
Figure 5�33. GRaND Vesta Data Collection Timeline.
The list of background sequences to accomplish the Vesta plan can be found in Section 10.1.1. Changes to the plan following the release of the Vesta Science Plan document are in Section 10.2.1.
Table 6�1 provides a list of the Vesta to Ceres cruise activities. Cruise to Ceres differs significantly from cruise to Vesta because of the loss of the second reaction wheel during the departure from Vesta. While the reaction wheels were not planned for use during the cruise to Ceres, the schedule for high rate telecommunications was changed from weekly to monthly to save hydrazine. As a result, new cruise VR allocations are used during Vesta to Ceres cruise where all instrument VRs were removed and instrument telemetry is transferred to the engineering VR2. In addition, the requirement for instrument checkout activities is relaxed from 6-month to 8-month intervals in an effort to preserve hydrazine. Hydrazine management is discussed in Section 7.1.1.
   ===========================================================================
   Background      Sequence      Instrument Activity                      Start Date      End Date
   dc053           FC2           Non-Pointed Checkout                     12/09/2012      12/09/2012
   dc053           GRaND         Background                               12/10/2012      12/16/2012
   dc053           VIR           Non-Pointed Functional Test              12/11/2012      12/12/2012
   dc053           FC1           Non-Pointed Checkout                     12/12/2012      12/12/2012
   dc065           GRaND         Background                               11/15/2013      11/25/2013
   dc065           FC2           Non-Pointed Checkout                     11/15/2013      11/16/2013
   dc065           VIR           Non-Pointed Functional Test              11/16/2013      11/16/2013
   dc065           GRaND         Rate Validation                          11/23/2013      11/25/2013
   dc065           FC1           Non-Pointed Checkout                     12/02/2013      12/02/2013
   dc072           VIR           Non-Pointed Functional Test              06/23/2014      06/23/2014
   dc072           FC2           LLSW & UDP Library Update (3.09.03)      06/23/2014      06/23/2014
   dc072/dc073     GRaND         Background                               06/23/2014      06/30/2014
   dc074           FC2           Non-Pointed Checkout                     07/21/2014      07/21/2014
   dc074           FC1           LLSW & UDP Library Update (3.09.03)      08/21/2014      08/21/2014
   dc075           FC1           Non-Pointed Checkout                     08/21/2014      08/22/2014
   dc078           FC2           Stray Light Calibration                  12/01/2014      12/01/2014
   ===========================================================================
Table 6�1. Vesta to Ceres Cruise Instrument Activities.
Both FCs are calibrated with the standard non-pointed checkout. The pointed calibrations cannot be accomplished without the reaction wheels except in the case of the dc078 FC2 infield stray light calibration that is executed while the ion thrusters control the pointing. The FC FSW is updated in preparation for Ceres operations incorporating lessons learned from Vesta operations. However, the new FC flight software introduced a data handling bug that results in the image bias information being overwritten by a constant value and adds some slight lossiness to almost all compressed images. Loss of the image bias measurement has little impact on calibration of most Ceres images except for the RC3 high phase observations described in Section 7.3.
The primary change to the Vesta to Ceres cruise phase was a safe mode entry on September 11, 2014. Missed thrust from the safe mode required a redesign of the Ceres approach trajectory and delayed arrival by two weeks from the Ceres ISB plan described in the next section.
Science data collected during the approach sub-phase, and in each of the science orbit sub-phases, satisfy the science objectives and measurement requirements specified for Ceres in Section 3.3 and in Appendix 9 to the Dawn Discovery Program Plan. The data provides observations necessary to characterize Ceres well enough to transition to the next sub-phase. The science orbit sub-phases are: Rotation Characterization 3 (RC3) Orbit, Survey Orbit, High Altitude Mapping Orbit (HAMO), and Low Altitude Mapping Orbit (LAMO). The parameters of the Ceres orbit sub-phases from the ISB reference trajectories are given in Table 7�1. The detailed timing of each sub-phase from the ISB era is listed in Appendix 10.1. The orbits are illustrated graphically in
Figure 7�1. The Ceres shape is described by an oblate spheroid with values 487.3 km and 454.7 km or as a sphere with a radius of 480 km (Thomas et al., 2005). The sub-phase start dates are taken from the ISB timeline. The RC3 sub-phase provides a significant improvement on the spin axis determination and the first complete global mapping of the surface at a low resolution. The Survey Orbit sub-phase provides the best global coverage for VIR spectral mapping and an overview of Ceres for the planning of subsequent sub-phases. Survey lasts 22 days and starts when the spacecraft establishes a circular polar orbit at a radius of 4881km. The HAMO sub-phase is primarily used for the optical mapping and reflectance spectral sampling of Ceres� surface. The required Level-1 science for HAMO are multi-color surface maps (clear filter and three color filters) of 80% of the surface, a topographical map of 80% of the surface, and to acquire at least 4000 VIR spectral frames. The HAMO duration is 67 days and starts at the conclusion of the Survey to HAMO transfer when the spacecraft achieves a circular near-polar orbit at 1949km mean radius. The LAMO sub-phase provides gamma ray and neutron spectra and the highest resolution measurements of the gravity field. The baseline LAMO duration is 92 days and begins when the spacecraft establishes a circular polar orbit with an 850km mean radius. The spacecraft remains in LAMO orbit until the hydrazine propellant is exhausted and the mission ends. If the hybrid control mode is successful, this could potentially double the LAMO duration. There are 50 days of operations margin that can be deployed during the Ceres mission to recover from anomalies or phase operations to address human factors and 25 days of LAMO margin to mitigate gravity solar conjunction. The lighting conditions for each sub-phase, represented by striped boxes, are shown in Figure 7�2 (Li, 2014).
   ===========================================================================
   Sub-phase                    Start Date (ISB)   Duration (days)   Beta Angle (deg)       Orbit Radius (km)   Orbit Period     FC Resolution (iFOVxRange)
   Ceres Approach to RC3 Orbit  1/17/2015          84
   Ceres RC3 Orbit              4/12/2015          16                5.2-8.3                14,006              15.2 days        1.3 km/pixel
   Transfer to Survey Orbit     4/28/2015          30
   Ceres Survey Orbit           5/27/2015          22                14.7-19.8              4881                74.9 hrs         413 m/pixel
   Transfer to HAMO             6/18/2015          41
   Ceres HAMO                   7/29/2015          67                26.2-38                1950                18.9 hrs         138 m/pixel
   Transfer to LAMO             10/04/2015         60
   Ceres LAMO                   12/03/2015         92                44.6-44.4              851                 5.41 hrs         34 m/pixel
   TOTAL                                           412
   Operations + LAMO Margin                        75
   ===========================================================================
Table 7�1. Ceres Orbit Sub-Phase Parameters.

Figure 7�1. Ceres Mapping Phases Overview.
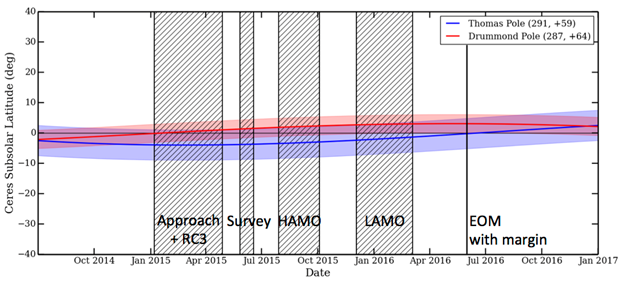
Figure 7�2. Ceres Lighting Conditions.
While remaining as close to the Vesta science operations template as possible, the Ceres science plan is significantly influenced by the loss of the second of four reaction wheels during departure from Vesta in 2012 (Polanskey et al., 2014). Immediately following the conclusion of the Vesta mission, the project undertook a rapid redesign effort to scope the feasibility of a Ceres mission using only the hydrazine-based reaction control system (RCS) thrusters to maintain attitude control. (During IPS thrusting, the ion engine is used to control two axes of spacecraft attitude, thus requiring hydrazine only for one axis.) While the spacecraft can adequately conduct the observation campaign in this operations mode, it consumes substantially more hydrazine propellant than the standard three-wheel operations. Hydrazine usage becomes the primary constraint on the architecture of the Ceres plan and significant effort went into planning for efficient use of hydrazine using only the RCS thrusters. The primary focus of the Ceres feasibility study is to establish whether a plan could be constructed that achieves the science requirements and objectives with the available hydrazine resources. While the Ceres operations were being re-planned, the project pursued a parallel effort to reduce hydrazine consumption during the cruise to Ceres as well as for engineering activities in Ceres orbit, including retuning the attitude control parameters to improve the overall efficiency of the attitude control subsystem (Rayman et al., 2014). Incorporating the savings from cruise and other efficiencies, the project concluded that after setting aside allocations for contingencies, and remaining cruise operations, 21.5 kg of hydrazine was available for the Ceres mission. Figure 7�3 shows the Dawn mission hydrazine budgets and the allocation for Ceres operations. The Ceres plan described in the rest of this section is estimated to use 16.2 kg +/- 4 kg leaving sufficient margin against 21.5 kg.
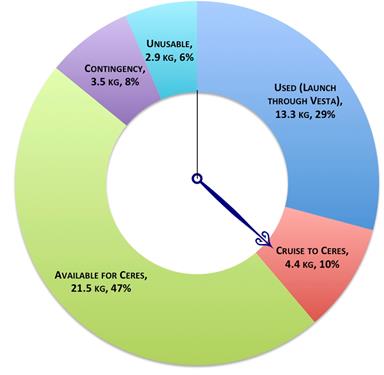
Figure 7�3. Dawn Hydrazine Budget.
Following the loss of the first reaction wheel prior to Vesta operations, the spacecraft team discontinued use of the three healthy reaction wheels during the remaining cruise to Vesta and also planned to further conserve wheel lifetime by leaving them powered off during the cruise from Vesta to Ceres. The team also updated the spacecraft attitude control software to enable a hybrid mode of operation that utilizes only two reaction wheels supplemented by the RCS thrusters. This mode consumes hydrazine at roughly half the rate of the mode utilizing only the RCS thrusters. However, the Ceres plan does not rely exclusively on this hybrid mode; the project also considered the likelihood that the two healthy reaction wheels would not remain functional for the full duration of Ceres operations. With two wheel failures on Dawn and several more on other spacecraft, the project concluded that the remaining two wheels were unreliable. In addition, models of hydrazine consumption as a function of orbit altitude revealed a dramatic increase in the rate of hydrazine consumption with decreasing orbit altitude. Hydrazine consumption rates for nadir operations in LAMO are least a factor of eight more costly than any other science phase. Combining these two findings and the knowledge that the geochemistry data set is best acquired at the lowest achievable altitude, the decision was made to limit the use of the hybrid mode to the LAMO science phase in order to take best advantage of whatever lifetime is remaining on the wheels. Using the remaining reaction wheel lifetime in LAMO has the greatest impact on increasing the mission duration. An extra benefit of this decision is simplification of early Ceres operations. The Ceres plan does not need to account for the uncertainty in the lifetime of the reaction wheels until the start of LAMO, eliminating the need for contingency plans to address reaction wheel failures for most of Ceres operations. The LAMO observation sequences are the same regardless of the attitude control mode so there would be no redesign task following a reaction wheel failure. The project goal was to design a plan that can accomplish the Ceres mission even without any use of the hybrid attitude control mode. Successful Ceres science acquisition is then guaranteed, independent of the health of the reaction wheels.
For the science orbit phases, the most effective method for reducing hydrazine consumption is the reduction of the number of spacecraft turns. Dawn does not have an articulated antenna so the spacecraft must be turned from the observing attitude to the communications attitude in order to return science data, receive commands, and report on spacecraft health. The Vesta mission is characterized by frequent turns between these attitudes in order to take advantage of any time (except in LAMO) that the spacecraft was traversing the dark side of Vesta and thus unable to acquire science data. Additional turns are also used to fine-tune observing attitudes, acquire specialized data sets, or to establish standardized waypoints for simplified mission operations. Planning for Ceres requires a new paradigm in which turns are only included when onboard data storage was full or when it was necessary to conduct other engineering activities that required contact through the high gain antenna. Often this means that the Ceres activities require more time to complete, but unlike Vesta operations, time is no longer the driving constraint. Each mission phase has a unique driver of turn frequency, but overall the number of turns at Ceres is a factor of four less than Vesta for roughly the equivalent mission duration.
The most significant reductions are in the survey and HAMO science phases. The survey orbit period is very long compared to the Ceres rotation period. To acquire early global coverage of Vesta in the minimum time, 1x3 mosaics are acquired over four separate Vesta rotations (twice when the spacecraft is near Vesta�s equator and twice when it is in the southern hemisphere) requiring 44 turns for each mosaic. While this data set is effective for creating a low-resolution shape model of Vesta, it requires 176 turns. At Ceres an equivalent data set is acquired by remaining at a nadir attitude for a full Ceres rotation in all seven survey phase orbits, alternating among the northern hemisphere, equatorial regions and the southern hemisphere. Even with three special periods of limb observing, there are only 18 turns during the entire Ceres survey phase, which is a factor of 20 reduction from the 363 turns during Vesta survey as shown in Table 7�2.
   ===========================================================================
   Sub-phase             Ceres Mission Turns      Vesta Mission Turns
   Approach              38                       77
   RC3                   12                       6
   Transfer to Survey    11                       77
   Survey                18                       363
   Transfer to HAMO      23                       41
   HAMO (HAMO-1)         42                       170
   Transfer to LAMO      16                       51
   LAMO                  48                       140
   Total through LAMO    208                      925
   Transfer to HAMO-2    n/a                      29
   HAMO-2                n/a                      251
   Departure             n/a                      92
   Mission Total         208                      1297
   ===========================================================================
Table 7�2. Total Planned Spacecraft Turns at Ceres Compared to the Vesta Mission
For both Vesta and Ceres, HAMO is highly constrained by the telemetry available to transmit data from the spacecraft to the ground. At Vesta every opportunity is taken to transmit data when the spacecraft is on the dark side of the orbit. There are six imaging cycles for each Vesta HAMO phase, each achieves near-global coverage with 10 orbits per cycle, resulting in 120 turns just to return data. Four of the six cycles point the spacecraft at an off-nadir angle for observing; on every revolution, the spacecraft is first commanded to the nadir attitude and then the attitude is adjusted to the desired off-nadir angle, adding 40 additional turns to each HAMO phase. In some cycles additional turns are added mid-orbit to tune the off-nadir attitude as the spacecraft transitioned from the northern to southern hemisphere. The result is 170 turns in Vesta HAMO-1 and 251 turns in HAMO-2. For Ceres there are 12 orbits per ground track repeat period, but the spacecraft is only turned to a communications attitude in two or three of the dark side passes so the bulk of the imaging data is accumulated onboard. At the end of the ground track repeat period two complete orbits are used to return the science data extending each HAMO cycle to 14 orbits. While this approach is adequate to return sufficient data to meet the science requirements for HAMO, it does reduce the overall data volume that can be returned. Lossy compression of the FC2 images is used to compensate for the data volume reduction. VIR data return is also reduced from the Vesta plan although the number of VIR frames still exceeds the requirements for this science phase. In addition, turns to off-nadir angles are commanded directly rather than first turning to nadir and then performing a small off-nadir turn. Overall the number of turns for Ceres HAMO is reduced by nearly a factor of five from each of the HAMO phases in the Vesta mission. For the nominal Ceres mission, there are almost seven times fewer turns than at Vesta. This reduction, along with other hydrazine savings, enables a successful Ceres mission plan even in the absence of the reaction wheels.
In addition to tracking turns, the science and mission plan also minimize hydrazine expenditures during tracking passes and when the spacecraft is nadir observing Ceres. Hydrazine cost per hour increases dramatically with decreasing altitude resulting in the majority of the resources being consumed in the transfer to LAMO and LAMO sub-phases. The hydrazine cost for each of the Ceres sub-phases and the current best estimate (CBE) for the total hydrazine cost of the Ceres science plan is shown in Figure 7�4.
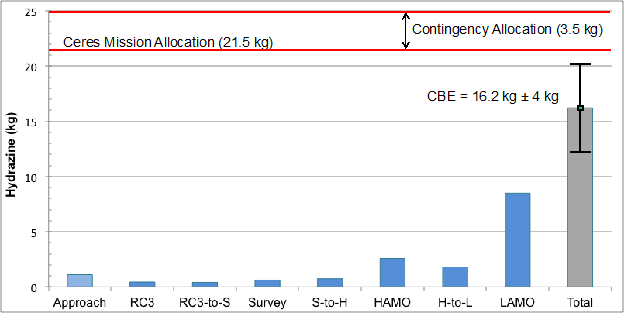
Figure 7�4. Ceres Hydrazine Usage per Sub-phase.
Without the use of the reaction wheels, the spacecraft pointing errors and drift rates are significantly higher at Ceres that during Vesta operations. To reduce the hydrazine cost of RCS operations at Ceres, pointing requirements are relaxed to minimize the frequency of thruster firings. The pointing offsets cannot be predicted in advance, so the science orbit requirements are defined to anticipate this uncertainty and to provide guaranteed global coverage of the surface despite the 0.64° effective dead bands. Under RCS control, the spacecraft pointing is maintained by setting attitude control gains that effectively introduce dead banding within tolerances that are defined for each spacecraft axis. In ACN mode with gains optimized for science, rotations of 0.64o about the spacecraft X or Y-axes are possible. These rotations displace the camera FOV (light blue square in the left illustration in Figure 7�5), expanding the region of space that might be observed at a fixed pointing over time. If this FOV is translated 0.64° upwards and to the left then it would capture the scene shown by the black dashed line. If the FOV is translated in all four possible directions then the remaining dark blue square is the scene that is guaranteed to be imaged regardless of how the FOV has shifted within its limits. This dark blue square is the FC reduced FOV. In addition, there can be up to +/- 5o rotations of the FOV about the boresight (+Z-axis, into the page). These rotations are depicted using the dotted line boxes on the right side of the figure. In hybrid mode, there is only 0.64° of translation along the Y-axis and the 5° rotation around the boresight. However, this is not considered a significant improvement over the all-RCS mode of operation. To simplify observation planning, the FC FOV was assumed to be 0.64° smaller than the actual FOV, and this "reduced FOV", is used to specify image overlap.
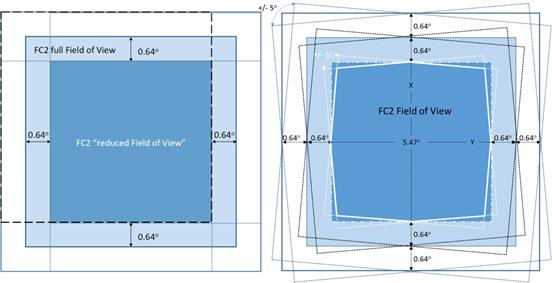
Figure 7�5. Illustration of FC "Reduced FOV".
There is no equivalent tool to simulate the VIR slit displacement from the commanded attitude, but the spacecraft attitude can be simulated for some nominal set of expected conditions and a simulated pointing profile can be used to project where the VIR data acquisition could occur. These simulations are shown in subsequent sections where the VIR observations are presented.
Increased smear is also expected from the motion of the spacecraft under RCS or hybrid control. Simulations show that the additional spacecraft motion increases with decreasing altitude. Table 7�3 summarizes the expected contribution of smear from the loss of the reaction wheels. These rates must be added to the contributions from spacecraft orbital motion and Ceres rotation to derive the total pointing error rate.
   ===========================================================================
   Science Sub-phase      Estimated Error Rate 99% Probability (µradians/sec)    Estimated Error Rate 68% Probability (µradians/sec)
   RC3                    77                                                     27
   Survey                 149                                                    41
   HAMO hybrid control    161                                                    101
   HAMO all-RCS           178                                                    110
   LAMO hybrid control    446                                                    355
   LAMO all-RCS           467                                                    374
   ===========================================================================
Table 7�3. Pointing Error Rates with All-RCS Attitude Control.
During the Ceres Science Approach (CSA) sub-phase the primary activity is the collection of OpNav data using FC2. While these are technically engineering data, they are useful for determining the Ceres albedo and appropriate exposure durations for the various science observations during approach. In addition, beginning with the third OpNav activity, the camera is used to search for possible satellites orbiting Ceres. The VIR instrument collects data during all of the OpNav imaging opportunities in order to understand the instrument response to an extended body and the integration times and repetition times that are required for later Ceres observations. Lastly, the GRaND instrument powers on and acquires background data that is useful in understanding the instrument response to the presence of Ceres once in orbit.
The approach reference trajectory is dawn_ref_150116-150511_131029_isb_approach_v1.bsp, and the near-approach geometry is shown in Figure 7�6. The panels in this figure are: phase angle in degrees (top); distance to Ceres center in thousands of kilometers (middle); and sub-spacecraft latitude in degrees (bottom). Vertical bars indicate various OpNav or science activities, and labels for these activities are found at the top of the figure. RC observations are shown in red and blue bars indicate OpNavs that include ride-along or dedicated satellite search observations. GRaND powers on following OpNav 3 and remains on throughout approach.
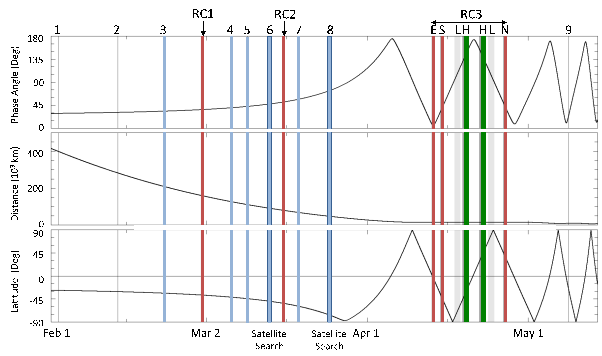
Figure 7�6. Ceres Approach and RC3 Observation Timing and Geometry.
Details regarding the FC2 imaging activities are provided in Table 7-4. The Ceres exposures column provides the total number of images including the breakdown of clear and color filter images in parentheses. All values are given at the activity start time. A * indicates a ride-along satellite search is included in the activity. The VIR activity details are provided in Table 7�5 below.
   ===========================================================================
   Observation            Start Time        Duration (hh:mm)    Phase (deg)       Distance (103 km)    Ceres Size (FC2 Pixels)    Latitude (deg)         Images Ceres Exposure Clear/Color       Images Star/Satellite Exposure    Data Volume (Gb)
   OpNav 1                Feb 02 08:22      01:00               29                400                  26                         -28                    20                                      20                                0.17
   OpNav 2                Feb 13 10:52      01:00               31                280                  37                         -31                    20                                      20                                0.17
   OpNav 3*               Feb 22 03:52      02:00               33                208                  50                         -34                    20                                      20/180                            0.87
   RC1                    Feb 28 23:21      09:45               36                158                  66                         -38                    171 (80/91)                             40                                0.80
   OpNav 4*               Mar 06 10:52      02:00               40                127                  82                         -42                    20                                      20/180                            0.87
   OpNav 5*               Mar 09 14:35      02:00               42                110                  95                         -45                    20                                      20/180                            0.87
   OpNav 6*               Mar 13 12:27      02:00               47                91                   114                        -49                    20                                      20/180                            0.87
   Satellite Search 1     Mar 13 14:38      07:15               47                90                   114                        -49                                                            512                               2.03
   RC2                    Mar 16 03:15      09:30               51                78                   134                        -54                    217 (77/140)                            39                                0.90
   OpNav 7*               Mar 19 03:52      02:00               56                67                   157                        -59                    20                                      20/180                            1.17
   Satellite Search 2a    Mar 24 15:20      02:15               73                47                   227                        -76                                                            192                               0.76
   OpNav 8*               Mar 24 18:52      02:00               73                46                   227                        -76                    20                                      20/180                            1.16
   Satellite Search 2b    Mar 24 21:02      03:15               73                46                   227                        -76                                                            256                               1.78
   RC3 Equator            Apr 13 02:00      10:30               6                 14                   750                        -3                     148 (43/105)                                                              1.41
   RC3 South              Apr 14 15:00      10:30               41                14                   750                        -40                    148 (43/105)                                                              1.41
   Equatorial Limb South  Apr 17 07:30      35:00               95                14                   750                        -21                    210                                                                       1.43
   High Phase South       Apr 18 18:30      27:00               130               14                   750                        -21                    507                                                                       3.03
   High Phase North       Apr 21 22:40      27:00               154               14                   750                        -21                    564                                                                       3.67
   Equatorial Limb North  Apr 23 11:45      29:00               155               14                   750                        30                     174                                                                       1.10
   RC3 North              Apr 26 10:00      10:30               44                14                   750                        40                     148 (43/105)                                                              1.41
   OpNav 9                May 08 12:30      02:00               23                8                    1300                       -24                    40                                                                        0.35
   ===========================================================================
Table 7�4. Ceres Planned FC2 Approach, RC3, and Transfer to Survey Observations.
   ===========================================================================
   Observation              Start Time         Duration(hh:mm)    Distance(103 km)    Ceres Size (VIR Pixels)            Number of Cubes      Number of Frames      Repetition Times (sec)      Data Volume (Gb)
   OpNav 1                  Feb 02 08:22       01:00              400                 10                                 3                    115                   9, 9, 13                    0.98
   OpNav 2                  Feb 13 10:52       01:00              280                 14                                 2                    120                   10, 19                      0.71
   OpNav 3                  Feb 22 03:52       02:00              208                 19                                 4                    130                   9, 10, 13, 19               1.41
   RC1                      Feb 28 23:21       09:45              158                 25                                 11                   130                   20                          3.68
   OpNav 4                  Mar 06 10:52       02:00              127                 31                                 2                    150                   16, 19                      0.86
   OpNav 5                  Mar 09 14:35       02:00              110                 35                                 3                    148                   10, 19, 21                  1.23
   OpNav 6                  Mar 13 12:27       02:00              91                  43                                 3                    146                   18, 19, 19                  1.30
   RC2                      Mar 16 03:15       09:30              78                  50                                 8                    170                   20                          3.50
   OpNav 7                  Mar 19 03:52       02:00              67                  58                                 3                    180                   10, 13, 14                  1.46
   OpNav 8                  Mar 24 18:52       02:00              46                  83                                 3                    210                   11, 12, 16                  1.69
   RC3 Equator              Apr 13 02:00       10:30              14                  278                                5                    248                   20                          3.23
   RC3 South                Apr 14 15:00       10:30              14                  278                                5                    248                   20                          3.21
   Equatorial Limb South    Apr 17 07:30       26:00              14                  278                                10                   140                   20                          7.10
   Equatorial Limb North    Apr 23 14:30       26:00              14                  278                                10                   140                   20                          7.10
   RC3 North                Apr 26 10:00       10:30              14                  278                                5                    248                   20                          3.21
   OpNav 9                  May 08 12:30       02:00              8                   487                                2                    200                   15                          0.62
   ===========================================================================
Table 7�5. Ceres Planned VIR Approach, RC3, and Transfer to Survey Observations.
All of the approach observations except the dedicated satellite search off-nadir observations are made by pointing the VIR boresight at Ceres center by using the ACN mode with nadir offsets of (0,0). The ACN (0,0) mode is more hydrazine efficient than the Asteroid Nadir mode and has smaller pointing errors in the +Z spacecraft axis at this range. In all of these observations, Ceres is much smaller than the reduced FC2 FOV so the decision has been made to point VIR in order to reduce the number of scan mirror steps required to cover Ceres and account for all associated pointing errors. Figure 7�7 shows the size of Ceres in three different OpNavs at the beginning, middle, and end of the approach phase compared to the FC2 and VIR FOVs. In all three panels, the two largest yellow boxes are the FC2 full and reduced FOVs, the smallest blue box is a VIR scan mirror cube, and the central blue line is the VIR slit. In the left panel (OpNav 1) and center panel (OpNav 4), the VIR scan mirror cubes are shown as having 128 steps while the actual observations will have 115 and 150 steps respectively. The right panel shows OpNav 8 with a full 256-step scan mirror cube while the actual cube will have 210 steps.

Figure 7�7. Three Ceres Approach OpNavs.
The primary science observations during the Approach sub-phase are the rotation characterization (RC) maps that are obtained at increasing resolution as the spacecraft approaches Ceres. Following on to the work done at Vesta, three of these RC maps are acquired. However, unlike Vesta, the third RC is its own sub-phase and it is described later in this document. The resolution of the two approach RC maps increases from ~15 km/pixel in RC1, to ~7.5 km/pixel in RC2 or approximately twice and four times the image resolution images from Thomas et al. (2005). Clear filter images are acquired approximately every 10° of Ceres longitude, approximately every fifteen minutes, using two different exposure times - one optimized to resolve Ceres surface features and the other to resolve the background star field. The best pre-Approach estimate of the Ceres rotational pole location is RA = 291°±11°, DEC = 59° ±6° from Parker et al. (2006). Note that Parker et al. (2006) do not provide uncertainties on the pole determination and the values listed here are large enough to include the earlier estimates of Saint-Pe et al. (1993) and Drummond et al. (1998) whose previous pole estimates are cited by Parker et al. (2006) as being in approximate agreement with their result.

Figure 7�8. Ceres RC1 and RC2 Observation Geometries with Instrument FOV.
The RC observations incrementally improve our knowledge of the Ceres pole position during the approach period in order to improve the trajectory design. In addition to the clear filter imaging, VIR obtains full-disc spectra and there is a full pass through the FC2 filter wheel every 30° of longitude. Data obtained in the approach phase will provide a range of illumination angles to test exposure and integration times. Figure 7�8 shows the RC1 and RC2 observations. As before, the FC2 full and reduced FOVs (largest two in yellow) and VIR cube and slit footprints (in blue) are shown. In both panels, the VIR cube is shown as 128 steps while the actual RC1 and RC2 observations sizes are 130 and 170 steps, respectively.
During Ceres approach, Dawn performs a more extensive satellite search than was done on Vesta Approach. These observations fall into two categories: OpNav ride-along imaging and dedicated observations. All OpNav activities beginning with OpNav 3 will include satellite search ride-along imaging. The ride-along observation strategy is shown in Figure 7�9. Nominal OpNav imaging (A) consists of alternating images with exposure durations set to resolve either the background star field or Ceres. Navigators use the motion of Ceres with respect to the stars to determine the motion of the spacecraft. In order to search for fast moving objects in the vicinity of Ceres, the number of star exposures during these observations increases from one to 10 (B). These images are acquired as quickly as possible by the camera (a nine second cadence) so that the images can be co-registered and co-added to make a single deep exposure. RCS pointing errors would smear the stars in a single, long exposure image. Twenty of these deep exposure image sets (C) are acquired during each two hour OpNav imaging session.
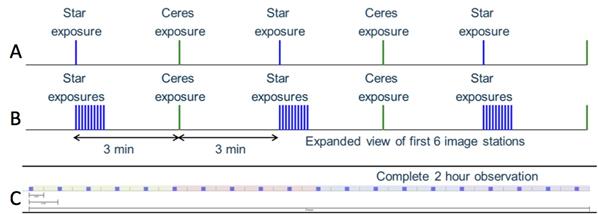
Figure 7�9. Ceres Approach OpNav with Ride-Along Satellite Search Imaging.
There are also two dedicated satellite search observations. Both use the same basic imaging strategy shown in Figure 7�10 but with different pointing strategies. The dedicated satellite search imaging plan consists of building sets of "blinkable" images at different separation times and depth of exposures. The basic building block is a stack of sixteen images acquired with a two second exposure and at a nine second cadence. These images are co-registered and co-added to make a single blinkable image in 144 seconds. Four sets of blinkable images are produced at a four minute cadence to identify fast moving objects. These images can be co-registered and co-added again to make deep exposures. Seven deep exposure sets are acquired at a one-hour cadence.
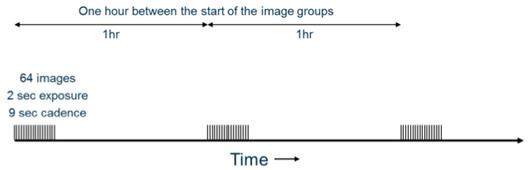
Figure 7�10. Ceres Approach Satellite Search 1 Imaging Strategy.
The first dedicated satellite search follows OpNav 6. In this observation, no turns are performed but the ACS gains are commanded and optimized for HGA-to-Earth pointing. Figure 7�11 shows one possible pointing scenario that could be associated with this gain change. The sequence begins (A) at the end of OpNav 6 with Ceres in the center of the VIR FOV at the time when the gains are reset. With the HGA-to-Earth settings there are ±5o rotational dead bands about the spacecraft X-axis. These rotations displace the FC2 FOV along the spacecraft Y-axis, which is very nearly aligned with the VIR slit. After the gains are reset, the pointing begins to dead band away from Ceres (B) and eventually hits the dead-band limit (C). After some time, the pointing begins to move towards the other side of the dead band (D), possibly hitting that limit (E). There is no way to predict the details of the dead-banding motion. The only thing that is predictable are the limits of the off-nadir excursions. The hope is that this motion will expand the satellite search area around Ceres without the hydrazine cost of dedicated turns. However, there is still some hydrazine cost associated with changing the dead-banding gains. The apparent change in the size of Ceres and the FC2 FOV is an artifact introduced when producing the images.

Figure 7�11. Ceres Approach Hypothetical Time Evolution of Pointing for Satellite Search 1.
The second dedicated satellite search observation is associated with OpNav 8. In this observation, the spacecraft is pointed a few degrees away from Ceres so that Ceres is not in the FC2 FOV, as shown in Figure 7�12. Following thrusting, the spacecraft turns to a pointing that appears to be below Ceres (2a) where observations are made for a bit more than three hours while three deep exposure observations are made. After the first set of deep exposures, the VIR boresight is pointed directly at Ceres for the OpNav imaging with satellite search ride-along. When the OpNav completes, the spacecraft turns to a second off-Ceres pointing (2b). Four additional deep exposure image sets are acquired at this pointing. In the absence of pointing errors, the OpNav 8 ride-along search fully covers the HAMO and LAMO orbit ranges and the off-Ceres attitudes cover from HAMO to beyond the Survey orbit range providing spacecraft hazard analysis with the highest resolution searches available during Approach. In this set of observations, all of the images are acquired in "science mode" where the ACS gains tightly control the pointing of the spacecraft +Z-axis and instrument boresights.
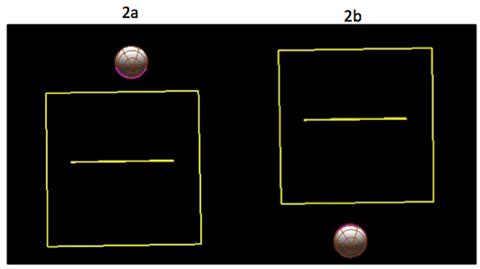
Figure 7�12. Ceres Approach Dedicated Satellite Search 2 with Turns to Off-Nadir Pointing.
The imaging strategy for the second dedicated satellite search is slightly different from the first because of the improved pointing stability. Figure 7�13 shows the basic imaging plan. Like the previous satellite search, the plan consists of building sets of "blinkable" images at different separation times and depth of exposure. The basic building block remains a stack of 64 images acquired with a two second exposure and nine second cadence. The difference here is that the groups of 16 images are separated in time by four minutes allowing a fast moving object to travel
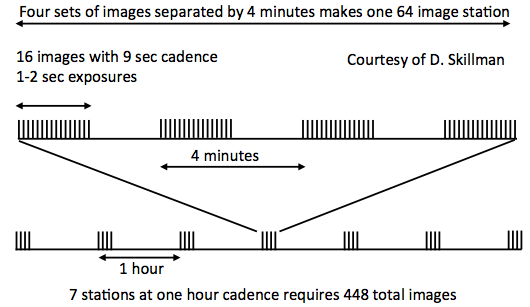
Figure 7�13. Ceres Approach Dedicated Satellite Search Imaging Strategy.
further in the FOV. In the previous observation, the images are acquired as quickly as possible because of the larger pointing drift and faster drift rate relative to Ceres. Tighter pointing constraints allow the image groups to be separated further in time. As before, the image groups can be co-registered and co-added to make four blinkable images with a four-minute cadence and the entire stack can be processed to make a single, deeper exposure image that can be blinked with similarly processed images.
Pointing errors associated with the attitude control system in the RCS mode are discussed earlier in this chapter. In addition to those errors, there are pointing errors associated with the uncertainty in the ephemeris predictions. Table 7�6 below gives the predicted pointing errors associated with each of the Ceres Approach activities in units of milliradians (mrad) as well as in FC2 and VIR pixels. Columns 2 through 4 (green) give the total 1-sigma ephemeris pointing error in units of mrad, FC2 pixels, and VIR pixels respectively after an ephemeris update (EU) on the spacecraft. Columns 5 and 6 (gold) give the component of the pointing error in the VIR mirror scan direction (Y direction) in units of mrad and VIR pixels. Column 7 (blue) gives the size of Ceres in units of VIR pixels. Column 8 gives the total error (ephemeris plus attitude) in units of VIR pixels. The attitude error associated with ACS dead banding is fixed at ±0.64° which is equivalent to 89.5 VIR pixels.
   ===========================================================================
               With EU                                                                                       X-dir pointing error                                                                      Ceres Diam.                         Total Error
   Activity    Pointing Prediction         Pointing error in                Pointing error in                Pointing error in VIR scan                         Pointing error in VIR scan
               (1-sig) after EU (mrad)     FC2 pixels (after EU)            VIR pixels (after EU)            direction (in mrads after EU) @ 1-sigma            direction (in pixels, after EU)        Size of Ceres (in VIR pixels)       Total predicted pointing error
   OpNav1      6.488                       69.76                            25.95                            1.113                                              4.45                                   9                                   19.4
   OpNav2      2.688                       28.90                            10.75                            0.688                                              2.75                                   13                                  18.0
   OpNav3      1.289                       13.86                            5.16                             0.429                                              1.72                                   18                                  18.4
   RC1         1.271                       13.67                            5.08                             0.539                                              2.16                                   23                                  21.8
   OpNav4      2.767                       29.75                            11.07                            1.541                                              6.16                                   30                                  33.3
   OpNav5      2.163                       23.26                            8.65                             1.362                                              5.45                                   35                                  34.4
   OpNav6      1.094                       11.76                            4.38                             0.791                                              3.16                                   42                                  33.3
   RC2         0.893                       9.60                             3.57                             0.793                                              3.17                                   42                                  33.3
   OpNav7      0.620                       6.67                             2.48                             0.650                                              2.60                                   58                                  40.2
   OpNav8      0.623                       6.70                             2.49                             0.964                                              3.86                                   84                                  55.7
   ===========================================================================
Table 7�6. Ceres Approach Ephemeris Related Pointing Errors for Activities.
During the Vesta mission, the OpNav images are commanded with 1:1 compression ratio to ensure that only lossless compression is applied. The compression ratios achieved at Vesta demonstrated a clear trend that can be applied to Ceres planning by tuning the commanded compression ratios closer to what is expected in flight. This allows for more accurate data store modeling and efficient use of the available data volume, enabling acquisition of additional FC2 and VIR data. The FC2 compression ratio guidelines are listed in Table 7�7. The VIR compression is modeled at a constant 1.4:1 throughout the Ceres mission based on Vesta experience.
   ===========================================================================
   Ceres Range (km)                 Observations                         Commanded Compression Ratio
   > 70,000 km                      OpNav 1 through RC2                  4:1
   15,000 < R < 70,000 km           OpNav 7 and OpNav 8                  3:1
   < 15,000 km                      RC3 north, equator, and south        1.8:1
   < 15,000 km (special case)       RC3 High Phase and Equatorial Limb   2.5:1
   < 15.000 km                      OpNav 9                              1.8:1
   ===========================================================================
Table 7�7. Ceres Approach Guidelines for FC2 Commanded Compression Ratios.
Data from all activities are stored internally in instrument memory while the data are acquired and then discharged through the spacecraft VRs to the ground during spacecraft playback passes in continuous playback mode. OpNavs 1 and 2 are executed while the VRs are still configured to the Cruise 3 allocations, which does not include science VRs so all instrument data goes into the engineering VR2. This restricts the data volume available for these activities so some of the VIR data from OpNav 1 is carried over to the playback pass for OpNav 2. This is accomplished by managing the start of the VIR OpNav 1 data dump. The VRs are sized to the Cruise 1 sizes after OpNav 2 playback is complete. The Cruise 1 VR science and housekeeping VR allocations are listed in Table 7�8.
   ===========================================================================
   Virtual Recorder      HK (VR3)   VIR (VR4)   GRaND (VR5)   FC2 (VR8)  OpNav (VR10)
   Allocation (Gb)       0.242      0.601       0.758         0.508      0.453
   ===========================================================================
Table 7�8. Ceres Approach (Cruise 1) VR Allocations for instruments.
After the ISB mission timeline was developed, the DSN published a station maintenance schedule that seriously degrades Dawn�s ability to return all of the data acquired during Ceres approach. Fortunately, the maintenance schedule is provided with enough lead time that the NAV team can rework the forced coast times in the thrust plan such that the tracking passes occur over stations that are not down for scheduled maintenance. However, there may be difficulty acquiring the DSN tracking necessary to accommodate the planned activities. In order to achieve the expected 124 kbps downlink rate, Dawn requires a 70-m station for nearly all of the approach phase. If all or part of a planned tracking pass is performed using a 34-m station at 62 kbps, then there is a substantial reduction in the data volume returned. If the scheduling conflict is known prior to the time of the first sequence delivery, then the data volume acquired would likely be reduced. Engineering and OpNav data are given highest priority during this mission phase. Dedicated satellite search activities are given the next highest priority followed by the VIR observations. Ride-along satellite search imaging is given the lowest priority. Reductions in data volume acquired are planned in reverse priority order.
Large losses of expected data return would likely be addressed by acquiring fewer data. Smaller losses will likely be accepted without altering the plan. The playback margin policy during the Ceres approach phase is an hour of margin for each 12 hours of planned playback. Typically 10 min to 15 minutes of this margin is required to cover tracking station configuration change (1-way to 2-way, etc.) induced gaps. The remainder is available to cover other contingencies. The spacecraft memory fill margin policy during this sub-phase is set to 10% for both the VRs and the instrument�s internal memories. The fill states of these memories, particularly those associated with FC2, may be less than predicted since the image compression ratios are expected to be better than those used for data store modeling increasing the playback margin by an unknown amount. Data store models use the commanded minimum compression ratios to determine image size. These levels are set to values that are expected to be much less than the lossless compression value providing some additional playback margin.
The volume of FC2 data acquired is larger than the VR used for intermediary storage so the FC2 data is returned using continuous playback mode. In this mode data is transferred to VR8 during discreet intervals while playback is in progress. Any gaps in HGA tracking coverage that occur after the first sequence delivery require a rework of the spacecraft bus interface command timing that controls the flow of data from FC2 to VR8 to prevent VR8 overflow. If these gaps are introduced after sequences are delivered, then either real-time commanding is required to prevent overflow or overflow and data loss will have to be accepted. VR8 is given higher priority than VR4 (VIR) in the VR priority table. Deferring FC2 data playback by changing the bus interface timing during continuous playback can result in the loss of VIR data return, depending on the playback margin available.
In the ISB approach plan, the time between the last forced coast tracking pass and the first RC3 coast DSN pass is a few hours longer than can be accommodated by VR5 for the storage of GRaND data at the planned science data accumulation rate. This overflow may be averted when the plan is moved to the actual trajectory and timeline. The ISB plan accepts the overflow of VR5 and the loss of GRaND data. If this condition persists at the time of final implementation, a waiver will be required to acknowledge and accept this loss, or the GRaND science data rate will have to be reduced to prevent it.
The primary science goal of the RC3 orbit is to obtain a set of three global maps of Ceres (north, equator, and south) in all FC2 filters and with the VIR spectrometer. In addition, there are dark-side observations of the equatorial limb near the sub-solar region to look for out-gassing of water vapor as reported by the Heterodyne Instrument for the Far Infrared (HIFI) team associated with the Herschel Space Observatory (K�ppers et al., 2014). Both the FC2 and VIR instruments take data during these observations. Lastly, there is a pair of "high-phase" observations made by FC2. These observations are used to extend the Ceres phase function to the highest observable values possible and they may also be useful for detecting water vapor and/or dust escaping from the Ceres surface. These images have the least amount of in-field scattered light of any images acquired at RC3, which improves the detection limit for faint objects.
The intrinsic image resolution for all observations is roughly 1.2 km/pixel and the VIR spatial resolution is about 3.1 km/pixel. These resolution estimates do not account for smear associated with ACS dead-banding motion, spacecraft motion, or Ceres rotation, all of which reduce the effective resolution as a function of integration time. Each FC2 image includes the entire body, including the entire visible limb. The individual VIR spectral cubes are slightly smaller than the body but the entire body is mapped over the course of the three observations. The engineering goals of this orbit are to incrementally improve the knowledge of the Ceres pole and gravity fields in order to improve the trajectory design. Data obtained in RC3 are used to initialize the topographic model, and provide data to aid in finalizing the plans for HAMO and LAMO.
The Ceres RC3 reference trajectory is dawn_ref_150116-150511_131029_isb_approach_v1.bsp. The orbit radius is 14,006.2 km and the period is approximately 15.17 days. The orbit beta angle begins near 5.2° at the start of RC3 and drifts to approximately 8.3° by the end. The orbit radius is selected to be at the distance at which Ceres completely fills the FC2 reduced FOV and is just slightly larger than a full sweep of the VIR scan mirror. All of these observations except the equatorial limb point the FC2 boresight at the center of Ceres (ACN 0,0) in order to minimize the likelihood of Ceres not being completely contained in the FC2 FOV. The most hydrazine efficient spacecraft attitude during the RC3 science phase is HGA-to-Earth pointing. The spacecraft maintains this attitude, except for the data acquisition intervals that require Ceres pointing.
The RC3 observation order is uncertain because it is dictated by the thrusting time required to achieve the desired orbit radius. In addition, once the spacecraft is in orbit, there must be at least 24 hours before the first observation occurs in order to provide NAV enough time to update the onboard ephemeris. Figure 7�14 shows all of the RC3 activities independent of their ISB time order and the orbit entry point based on the ephemeris given in the previous paragraph. With the ISB ephemeris, the first possible observation will be the equator rotation. All of the observations are developed as stand-alone entities so that they can be sent to the spacecraft in any order, as required by the ephemeris at the time of orbit entry.
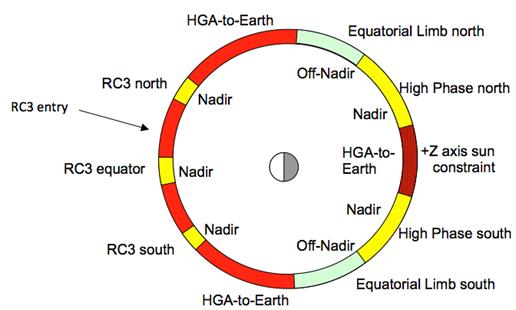
Figure 7�14. Ceres RC3 Orbit Activities and Attitude Profile.
Five onboard EUs are anticipated because RC3 is a fairly long science sub-phase. It is the first sub-phase after Dawn enters Ceres orbit, and there is a lack of detailed knowledge of the Ceres gravity field and the impact of RCS firings on the orbit. The first EU occurs following the end of Approach thrusting and before the first RC3 imaging. This one is critical to the RC3 imaging plan and will not be canceled. Depending on where in the RC3 orbit Dawn entered, there may be another update prior to any subsequent RC3 observations. The next opportunity to update the onboard ephemeris is during the playback pass just prior to the turn to nadir for the equatorial limb south observations. If the spacecraft has drifted away from the nominal trajectory by more than one or two degrees, then the onboard ephemeris will need to be updated in order to ensure the safety of the FC2 operations during the imaging. If the ephemeris is determined to be safe, this update may be cancelled. There is also an update during the playback pass between the two high phase observations. The last anticipated update is just before the RC3 North observation. At this time, the spacecraft will have completed nearly a full orbit and it is likely to have drifted away from the nominal trajectory, particularly if the previous update has been cancelled. RCS dead banding is expected to use up all of the RC3 pointing margin, and very little margin has been allocated to ephemeris error. It is possible but not likely that this final EU will be cancelled.
During RC3, the spacecraft attitude that consumes the least hydrazine per hour is HGA-to-Earth. This attitude is maintained any time that science data are not being actively collected. The longest science and engineering playback duration during this orbit is about 43 hours. Once all of the science and engineering data are returned, the communications system is configured to provide real-time data only. Given the very long orbit period and the time separation between science observations, some intermediate engineering data playback passes are required. This prevents the VRs from overflowing while still providing multiple opportunities for engineering data return. The maximum time separation between engineering playback passes of 70.5 and 72.5 hours are associated with the two dark side observations.
Figure 7�15 shows three RC3 observations with the equatorial (RC3e) on the left, the south (RC3s) in the middle, and the north (RC3n) on the right. These observations are targeted to be centered at 3° south (sub-solar latitude) for the equatorial observation, 40° south, and 40° north. Each observation lasts for 10.5 hours. The spacecraft moves roughly a degree of latitude each hour. In each panel, the FC2 full and reduced FOV are the two largest yellow squares, the VIR slit is the magenta line, and the full VIR scan mirror sweep cube is the yellow square on the sky that becomes magenta on Ceres. The VIR slit geometry is ideal for acquiring scan mirror cubes in the north and south observations and push-broom cubes for the equatorial observation. For the equatorial observation, the rotation of Ceres is perpendicular to the VIR slit. For the north and south observations, the slit is nearly parallel to Ceres rotation, but the scan direction is perpendicular. VIR acquires five full scan cubes of 248 frames in 2 hours and 8 minutes in each observation. FC2 acquires a clear filter image every 15 minutes and a full set of seven filters every 45 minutes. All of the images use exposures set to resolve Ceres and are compressed at a level that is expected to be lossless (1.8:1). The FC2 boresight is pointed at Ceres center using the ACN(0,0) mode. The RC3s latitude varies from 35° to 45° south, RC3n from 45° to 35° north, and RC3e from 2° north to 8° south.

Figure 7�15. Ceres RC3 Observation Geometry with Instrument FOV.
During the long dark-side traverse of Ceres, Dawn makes two sets of equatorial limb observations and two sets of high phase observations in the southern and northern hemispheres respectively. The equatorial limb observations are designed to target the near sub-solar region with both the VIR and FC2 instruments. The VIR boresight is pointed less than one degree off-nadir so that the VIR scan mirror cube covers the limb plus the maximum dead-banding pointing error. The VIR acquires five cubes with 140 frames per cube over the first Ceres rotation, filling its internal memory. The cubes are dumped to the spacecraft VR over approximately a full Ceres rotation. Once the VIR memory is fully discharged, the VIR instrument acquires another set of five cubes. Figure 7�16 shows the geometry during the south equatorial limb observation. The top panel, from left to right, shows the first frame of the first cube to the last frame of the last cube with two intermediate times. At the beginning of the observation, the sub-solar point is visible. As time progresses, the sub-solar point is lost behind the horizon. The bottom panel of Figure 7�16 shows the same progression of first frame to last frame for the second Ceres rotation in the south equatorial limb observation. The FOV shown in the figure from largest to smallest
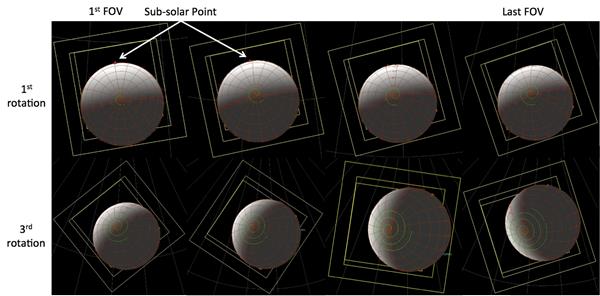
Figure 7�16. Ceres RC3 South Equatorial Limb Observations with FC2 and VIR FOV.
are the FC2 full FOV, the FC2 reduced FOV, and a full 256-step VIR scan. The distance that the FC2 FOV is displaced towards Ceres is the size of the dead-banding error and can be used to estimate where the maximally displaced VIR scan would reach.
Figure 7�17 has the same layout as Figure 7�16 but shows the geometry during the north equatorial limb observation. It begins with the sub-solar point over the horizon and unobserved, and ends with the sub-solar point in the VIR FOV. During each of these time periods, FC2 acquires alternating long, medium, and short exposure images. The three exposures are acquired as close in time as possible with image stations every 30 minutes. The close timing of individual images allows stacking to improve SNR if smear allows. These images are compressed using a compression ratio of 2.5:1 that should be lossless given the small portion of image that is illuminated. FC2 observes with two different exposures since it is difficult to determine in advance the correct exposure duration, and this is a unique opportunity during the Dawn mission.
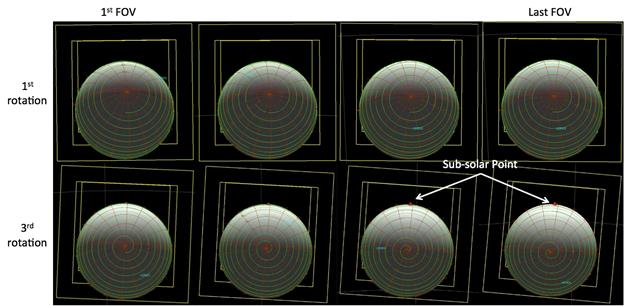
Figure 7�17. Ceres RC3 North Equatorial Limb Observations with FC2 and VIR FOV.
The timing of the equatorial limb observations is designed around the VIR pointing restrictions related to the use of the cover. The VIR cover cannot be actuated if the Sun has been within 60° of the spacecraft +Z axis within the previous three hours (F-VIRC13). The south equatorial limb observation ends just before the Sun angle reaches this limit. Once VIR has closed its cover, the FC2 boresight turns to Ceres nadir pointing (ACN 0,0). The turn to the off-nadir attitude for the north equatorial limb observation completes three hours before the Sun angle has reached 60°. After the north equatorial limb observation is complete, the HGA is turned to Earth pointing to playback the data.
After the south equatorial limb observation completes, the spacecraft turns to a Ceres nadir attitude and FC2 continues to acquire images at the limb observation cadence for another Ceres rotation. Then the south high phase observation begins. Like the dark-side limb observations, the high phase observations acquire three exposures as quickly as possible. The image station separations for each rotation vary with the phase function as given in Table 7�9. This insures that the phase function is characterized at the highest resolution possible at the highest phases where phase varies most rapidly.
   ===========================================================================
   Observation            Rotation Number    Phase (deg)        Cadence (min)
   High Phase South       1                  129-137            30
   High Phase South       2                  137-146            18
   High Phase South       3                  146-155            4.5
   High Phase North       1                  155-146            4.5
   High Phase North       2                  146-137            18
   High Phase North       3                  137-119            30
   ===========================================================================
Table 7�9. Ceres RC3 FC2 Image Cadence for High Phase Observations.
Figure 7�18 shows the spacecraft position and attitude versus time for the entire dark-side pass. The top two panels show the sub-spacecraft latitude and longitude. The next panel down shows the phase angle of the VIR boresight and the bottom panel shows the angle between the Sun and the +Z axis with the critical 60° and 25° angles marked with horizontal red lines. The figure is annotated with the pointing, turn locations, and VIR cover actuation times. It is also shaded during the various science observations.
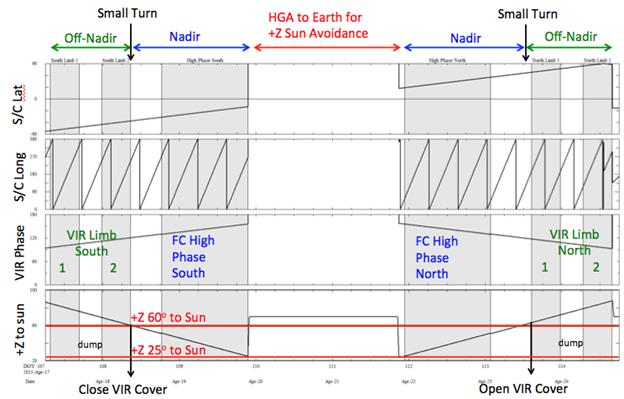
Figure 7�18. Ceres RC3 Proposed Geometry for the High Phase Observations.
The high phase observations are designed to image Ceres at the highest phases possible in each hemisphere. For safety reasons, FC2 cannot be pointed within 15° of the Sun when the door is open (F-FCSB08) and the spacecraft fault protection enforces this limit. Since damaging FC2 or tripping fault protection is undesired and fault protection responses limit the ability to acquire RC3 data, the plan is to not point FC2 any closer than 25° towards the Sun. Figure 7�18 shows the planned high phase observation geometry. After the south high phase observation is complete, the spacecraft turns to HGA-to-Earth pointing and the data are played back. This turn serves several purposes. It allows the data to be played back, provides Sun avoidance, and it presents an opportunity to power cycle FC2, which provides protection against any unplanned instrument resets. Figure 7�19 shows Ceres in the FC2 full and reduced FOV during the south (left) and north (right) high phase observations. No VIR data are acquired in the high phase observations.
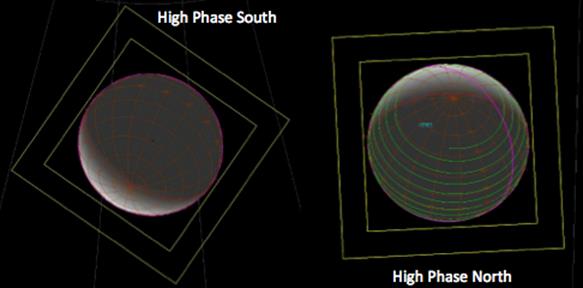
Figure 7�19. Ceres RC3 FC2 High Phase Observations.
The GRaND anneal heaters are turned on during the playback pass following RC3 south using the procedure developed for Mars approach (dc022) and executed on the spacecraft in the final cruise sequence prior to Vesta approach (dc048). Once the instrument is confirmed to be in good health after the engineering playback at the start of the playback pass, the anneal sequence is uplinked to the spacecraft. While the heaters are on the GRaND housekeeping data are monitored until the spacecraft turns to Ceres to acquire the south high phase observation. The GRaND anneal heater is powered off by the background sequence after five days, unless it has been previously powered off by real-time commands. GRaND housekeeping data are returned with the high phase imaging data a few days after the anneal heaters have been turned off. The GRaND state of health is assessed and if the instrument health is nominal the high voltages are ramped back up to resume nominal science data collection during the next playback pass.
Data from all activities are mostly stored in internal instrument memory while the data are acquired and then discharged through the spacecraft VRs to the ground during the spacecraft tracking passes using continuous playback mode. The VRs are sized to the "Ceres Science" allocations with science and housekeeping VRs listed in Table 7�10. The spacecraft is configured to direct OpNav images to VR8 rather than the standard VR10. Directing all of the FC2 data to a single VR makes data flow easier to model with the SciTOL on the ground.
   ===========================================================================
   Virtual Recorder           HK (VR3)    VIR (VR4)    GRaND (VR5)   FC2 (VR8)    OpNav (VR10)
   Allocation (Gb)            0.35        4.437        0.5           0.75         0.001
   ===========================================================================
Table 7�10. Ceres Science VR Allocations for instruments.
The RC3 data allocations for FC2 are shown in Table 7�11. A total of 1,899 images are acquired in Survey with 1,584 clear filter images and 45 seven-color image stations. The VIR data allocation for RC3 is listed in Table 7�12.
   ===========================================================================
   Cycle          Northern Latitudes        Equatorial         Southern Latitudes       Total
                  Clear    Color            Clear    Color     Clear    Color           Clear    Color
   RC3            43       105              43       105       43       105             129      315
   Equ Limb       174                                          210                      384
   High Phase     564                                          507                      1071
   Total                                                                                1584     315
   ===========================================================================
Table 7�11. Ceres RC3 FC2 Data Allocation.
   ===========================================================================
   Cycle       North Scan Cubes      Equatorial Pushbroom        South Scan Cubes         Total
               Cubes     Frames      Cubes        Frames         Cubes       Frames       Cubes      Frames
   RC3         5         1240        5            1250           5           1240         15         3730
   Equ Limb    20        2800                                    20          2800         40         5600
   Total                                                                                  55         9330
   ===========================================================================
Table 7�12. Ceres RC3 VIR Data Allocation.
Of all of the Ceres mission phases, RC3 is the least constrained by DSN requirements, available playback time, or onboard memory usage. During this time period, the 124 kbps telemetry rate is achievable using 34-m stations and there is no DSN station maintenance planned. The playback margin policy of an hour for each 12 hours of playback is easily met for all activities. The spacecraft memory margin policy of at least 10% is also easily met throughout this phase.
The volume of FC2 data acquired is larger than the VR used as the intermediary storage during the playback process in continuous playback mode. Any gaps in HGA tracking coverage that occur after the first sequence delivery require a rework of the spacecraft bus interface command timing that controls the flow of data from FC2 to VR8 to prevent VR8 overflow. If these gaps are introduced after sequences are delivered, then either real-time commanding is required to prevent overflow or overflow and data loss will have to be accepted. VR8 is given higher priority than VR4 (VIR) in the VR priority table. Deferring FC2 data playback by changing the bus interface timing during continuous playback can result in the loss of VIR data return, depending on the playback margin available.
The orbit transfer period is dedicated to the thrusting required to change the orbit from RC3 to Survey. Because the VRs are sized for Cruise, the spacecraft can thrust for more than a week without needing to playback spacecraft engineering and GRaND data during the transfer period. In order to provide NAV with enough information to design and build the thrust segments, LGA tracking data is acquired while thrusting during the transfer. In addition, there is one OpNav imaging activity with nadir pointing during this phase. Figure 7�20 shows Ceres just filling the full FC2 FOV (yellow square) at the time of OpNav 9 with the reduced FOV, the VIR full scan cube, and VIR slit shown in magenta on Ceres. This OpNav is two hours long and acquires 40 images with exposures optimized to resolve Ceres features only. Other attributes of this observation are listed in Table 7�4 in Section 7.2.2. Scattered light from Ceres would overwhelm any attempt to observe stars at this distance. Since the OpNav observation must be made on the illuminated side of Ceres, the time between the end of the final RC3 playback and the start of the OpNav 9 playback is longer than can be supported by the VR5 size, with GRaND acquiring data every 210 seconds. GRaND is expected to overflow its data buffer just a few hours before the start of the OpNav 9 playback. As of the ISB, it has been agreed that the overflow and data loss are preferable compared to reducing the instrument cadence. This decision may be revisited when the final sequencing is done.
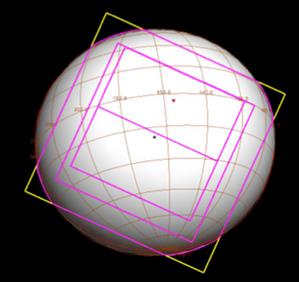
Figure 7�20. Ceres Transfer to Survey OpNav 9 Geometry with Instrument FOV.
The Survey orbit provides the best opportunity for global mapping with VIR between 0.25-5 microns, achieving surface coverage of 90% of Ceres. Global mapping with FC2 in both the clear filter and seven color filters facilitates shape model improvements for navigation and science planning and provides the basis for the global geologic map. Updated gravity determination from Survey also enables the design of the transfer trajectory to HAMO. GRaND is powered on and acquires background data, but cannot detect Ceres at this altitude. Ceres Survey is very similar to Vesta Survey with the exception of simplification of the global mosaics into a series of nadir observations. The orbit period is explicitly selected to be similar to the Vesta Survey orbit period. Ceres limb imaging is scaled back from Vesta Survey to conserve hydrazine. Data acquisition in this phase is constrained by onboard storage capacity as opposed to available data downlink capability.
The Ceres Survey reference trajectory is dawn_ref_150525-150619_140206_isb_Survey_v1.bsp. The mean orbit radius of 4881km is selected to provide an orbit period roughly similar to the Vesta Survey orbit period. The mean orbital period is 74.89 hours or 3.12 days. This orbit duration provides sufficient time to playback as much science data as can be acquired on the lit side of Ceres while maintaining comfortable margins. The 4-orbit longitude-repeat cycle was selected to maximize coverage for VIR. Beta angle is approximately 14.7° at the beginning of Survey and will drift 4° over the next 22 days to 19.8°. While lower beta angles improve the VIR signal, higher beta angles in this sub-phase result in a more favorable orientation of the VIR slit with respect to the spacecraft ground track and therefore better surface coverage. The optimal beta angle for VIR is 20°. The sub-phase duration of 22 days is selected to allow enough time for the navigators to measure the gravity field and determine the orbit transfer trajectory to HAMO and for the flight team to develop and uplink the transfer sequences. Similar to Vesta, seven one-orbit cycles (C1-C7) of data acquisition are planned.
The Survey timeline emphasizing the attitude strategy is shown in Figure 7�21. In general the spacecraft is commanded to a nadir attitude (yellow bars) on the lit side of Ceres, then turns to a communications attitude (red bars) when the spacecraft is on the dark side. In addition to the lit-side nadir observations, off-nadir OpNav limb imaging (green bars) is accommodated in C1, C2, and C4. To conserve hydrazine, the limb observations are schedule at the end of nadir observing in C1 and prior to nadir observing in C4, limiting the total cost to 4 turns. The limb imaging was scheduled during a time in C2 when VIR was dumping data to the VR and could not be observing at that time.
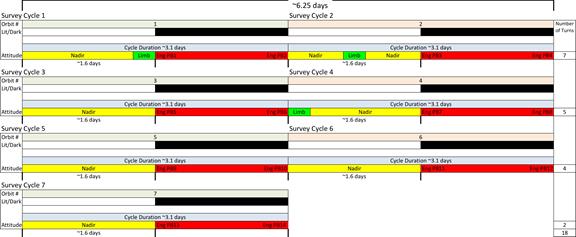
Figure 7�21. Ceres Survey Orbit Attitude Strategy.
VIR acquires swaths of the surface during each cycle of Survey. After seven cycles the VIR swaths cover the entire illuminated surface of Ceres with significant overlap between swaths for redundancy. VIR acquires scan mirror cubes in northern and southern latitudes and uses the pushbroom mode in the equatorial region. Unlike Vesta, the spacecraft will remain in a nadir attitude for all VIR observations. Repetition times of 15 to 20 seconds are planned, but may not provide connectivity between individual slits.

Figure 7�22. Ceres Survey Planned Coverage for VIR Assuming Perfect Pointing.
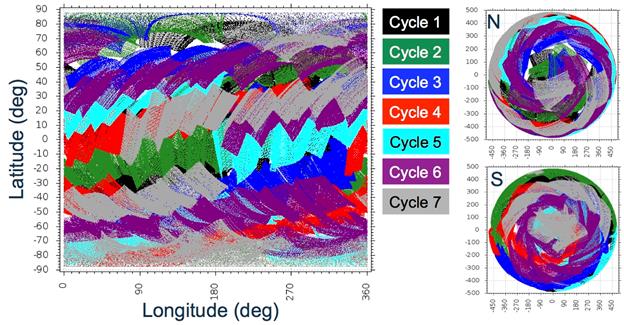
Figure 7�23. Ceres Survey Planned Coverage for VIR with SoftSim Pointing Predictions.
Observations for each cycle are assigned a different color in the plot. In the case of overlapping coverage, only the most recent cycle is visible. The coverage is shown on the right in a cylindrical projection. Polar projections for the north and south poles are shown on the left. Figure 7�22 depicts the coverage as it is planned with ideal attitude control as would be the case with RWA pointing. Figure 7�23 shows the same plan projected based on an attitude kernel modeled in SoftSim. While the RCS dead-banding effects are significant, the overall surface coverage is only slightly degraded from approximately 91% in the case of perfect pointing to about 86% with the simulated dead banding.
VIR surface coverage accumulation with time is plotted in Figure 7�24. By the end of the SoftSim predictions for C6, VIR has observed over 80% of the surface and the additional cycle appears to add little additional coverage, however, C7 serves as redundancy in the case of unexpected loss of an acquisition cycle.
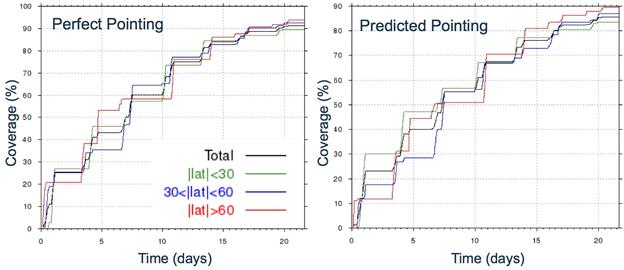
Figure 7�24. Ceres Survey VIR Coverage with Perfect and Predicted Pointing.
FC2 acquires 1,626 images during the seven Survey cycles at a minimum pixel scale (iFOV x range) of approximately 412m. The FC2 image count is substantially less than the plan for Vesta Survey but more than adequate to give complete redundant coverage all filters. The scale of the FC2 full FOV is shown in the left-most panel of Figure 7�25. For OpNav, three sets of clear-filter limb images are acquired with FC2 from different observing geometries. The first limb observations are acquired in C1 after VIR has filled both spacecraft and internal memory and can no longer acquire data. The spacecraft then turns to an off-nadir angle of ACN(-3.602, -0.995) to allow the spacecraft to observe the equatorial limb from the south pole for one complete Ceres rotation. In the middle of C2 while VIR is dumping data from internal memory to the VR, the second limb observation observes the southern mid-latitude limb with an attitude of ACN(3.183, -1.785). This observation is limited to 5.5 hours so it only covers a partial Ceres rotation. The final limb observation is accommodated at the beginning of C4 while waiting to achieve the starting latitude for VIR observations. The spacecraft turns to an attitude of ACN(3.642, -0.632) observing the equatorial limb from the north pole for one complete Ceres rotation. The observation geometries for the three limb observations are shown in the remaining three panels of Figure 7�25.
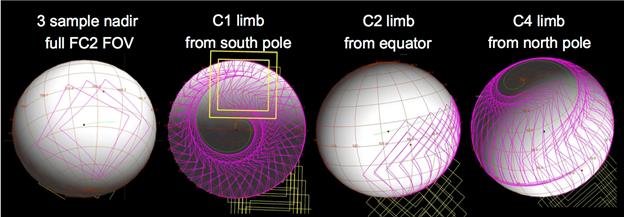
Figure 7�25. Ceres Survey FC2 Nadir and Limb Observation Examples.
At Vesta, the four sets of global mosaics were used to acquire complete image maps over four Vesta rotations. To save hydrazine at Ceres, the mosaics are replaced with continuous nadir imaging and a series of seven color-rotation maps similar to those acquired in RC3. Complete clear filter imaging coverage is acquired in every cycle with a 20-minute cadence except in the cycles with equatorial color coverage that have a 25-minute cadence. The excellent clear filter coverage is saturated in the cylindrical projection shown in the left panel of Figure 7�26. To balance the large data volume required for color imaging, seven-filter color image stations are located over different latitude bands for each Survey orbit. C1, C4, and C7 have functionally redundant color coverage at a 50-minute cadence in the equatorial band between ± 30° latitude with partial coverage between ± 65°. C2 and C5 provide color coverage with a 60-minute cadence in the south at greater than -40° latitude and the northern region at greater than 40° latitude is similarly acquired in C3 and C6. These regions also have partial coverage to 15°. The combined color coverage is shown in the right panel of Figure 7�26. The southern area with reduced color coverage results from the interruption caused by limb imaging in C2.
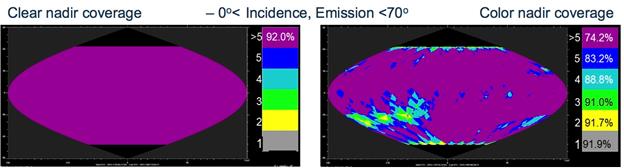
Figure 7�26. Ceres Survey FC2 Clear and Color Filter Imaging Coverage.
Ceres Science VR allocations for Survey are the same as shown for RC3 in Table 7�10 in Section 7.3.4 with all FC2 data going to VR8. FC2 data allocations are listed in Table 7�13. A total of 1,629 images are acquired in Survey with 901 clear filter images and 104 seven-color image stations. All images are compressed losslessly, commanded to 1.8:1. The clear filter images are in the high priority queue and the color images are medium priority.
   ===========================================================================
   Cycle   Clear Filter (F1)       Color Filters (F2-F8)                    Total                 Data Volume (Gb)
           Nadir      Limb         North       Equatorial       South       Clear      Color
   C1      79         74                       112                          153        112        2.33
   C2      95         46                                        98          141        98         2.10
   C3      114                     98                                       114        98         1.87
   C4      78         74                       112                          153        112        2.32
   C5      112                                                  98          112        98         1.85
   C6      112                     98                                       112        98         1.85
   C7      117                                 112                          117        112        2.02
   Total   707        194          196         336              196         901        728        14.34
   ===========================================================================
Table 7�13. Ceres Survey FC2 Data Allocation.
VIR observing is limited by the quantity of data that can be stored in 6Gb of internal memory and 4.437Gb of VR4 allocation, not the time available for playback. This allows VIR to acquire 20,395 full VIS+IR frames over seven cycles. The details of the VIR data allocation and the distribution of cubes with respect to latitude are listed in Table 7�14. VIR total Survey data volume is 50.68 Gb.
   ===========================================================================
   Cycle   North Scan Cubes         Equatorial Pushbroom         South Scan Cubes           Total
           Cubes      Frames        Cubes         Frames         Cubes        Frames        Cubes     Frames
   C1      8          1300          13            1560           �            �             21        2860
   C2      6          1080          13            1560           2            236           19        2876
   C3      8          1300          13            1560           �            �             21        2860
   C4      �          �             24            2860           �            �             24        2880
   C5      �          �             24            2859           �            �             25        2979
   C6      3          480           20            2400           �            �             25        3060
   C7      5          600           19            2280           �            �             24        2880
   Total                                                                                    159       20,395
   ===========================================================================
Table 7�14. Ceres Survey VIR Data Allocation.
During this time period, the 124 kbps telemetry rate is achievable using 34-m stations and there is no DSN station maintenance planned. The downlink margin policy of an hour for each 12 hours of playback is easily met for all activities. However, the 10% VR margin policy is violated by 5% in C4 by the VIR instrument requiring a waiver. The surface coverage targeted by the VIR team during C4 does not allow sufficient time to discharge enough data to VR4 to keep the internal memory from filling beyond the 90% limit. However, since VIR data are not compressed during internal storage, memory usage modeling does not require assumptions about compression ratios. C6 also violates the policy with 92% fill. The VIR team is willing to waive the margin policy limits in order to achieve the desired surface coverage.
The volume of FC2 data acquired is larger than the VR used as the intermediary storage during the downlink process in continuous playback mode. Any gaps in coverage that occur during HGA tracking passes that are known prior to the time of the first sequence delivery will require a rework of the spacecraft bus interface command timing that controls the flow of data from FC2 to the VR to prevent VR8 overflow. If these gaps are introduced after sequences are delivered, then either real-time commanding will be required to prevent overflow or overflow and data loss will have to be accepted. VR8 is given higher priority than VR4 (VIR) in the VR priority table. Deferring FC2 data playback by changing the bus interface timing during continuous playback can result in the loss of VIR data return, depending on the playback margin available.
The orbit transfer period is dedicated to the thrusting required to change the orbit from Survey to HAMO. There are no science or OpNav activities scheduled during the transfer to HAMO orbit. The VRs are configured back to the Cruise 1 allocations at the end of Survey to span the longer durations between tracking passes during this period. GRaND remains on collecting science data that are returned during the standard engineering playbacks. There is a two-day coast at the end of the orbit transfer to allow for an EU and to resize the VRs to the Ceres Science allocations.
The HAMO goals for FC2 are to create global maps of the lit surface of the body in the clear filter plus three color filters from a nadir attitude, and at least three clear filter maps from different off-nadir viewing angles. The Level-1 requirement is for 80% global coverage for all maps. The HAMO plan images the entire lit surface with the clear plus seven filters. The FC2 clear filter maps from different viewing angles (nadir plus four off-nadir and one slightly off-nadir attitude) plus the limb images are used to create a topographic model via Stereo and SPC processing. The off-nadir coverage is required to be at angles of 10-20° from the surface normal.
VIR also collects at least 4000 frames to fulfill half of the VIR Level 1 requirements, although this does not provide global coverage. The VIR data collected samples the spectral variability at smaller scales than the global Survey map and builds up high-resolution coverage over areas of interest. The VIR data is taken at both nadir and off-nadir viewing angles, and the scan mirror is used to tailor the viewing angle when the geometry is favorable.
The Ceres HAMO reference trajectory is dawn_ref_150729-151005_140404_isb_CSH_v1.bsp. The HAMO orbit is designed to provide complete longitudinal coverage with the FC2 reduced FOV in 12 orbits over 9.4 days at a 1949.8km mean orbit radius. The mean orbital period is 18.89 hr. Beta angle is approximately 26.2° at the beginning of HAMO and drifts to 38° over the next 67 days. A HAMO cycle is defined as one complete mapping of Ceres, with six cycles (C1-C6) in the HAMO sub-phase. Figure 7�27 is an SOA plot illustrating Ceres HAMO mapping with FC2 while nadir-pointed in C1. The view on the left shows the FC2 full FOV on Ceres. The FOV are colored to show the different image cadences: green is a 30-minute cadence at the poles, magenta is 20-minutes at mid-latitudes, and blue is 15-minutes at the equator. The view on the right uses the reduced FC2 FOV, showing the guaranteed coverage expected despite pointing uncertainties. There are small gaps between images in this view, but since the full image is actually acquired, many of these gaps are likely filled. The terminator is shown in red and the ground track is shown in green. The orbit is polar, although there is an apparent tilt of the ground track as an artifact of Ceres�s rotation. Note that ground tracks from successive orbits are adjacent and form a petal pattern that fills in over the 12-orbit cycle. The footprints at the top and bottom of Ceres are from other petals. The black triangle indicates the sub-spacecraft point and the red triangle gives the sub-solar point.
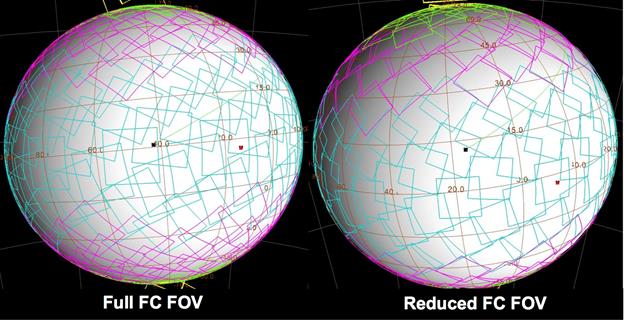
Figure 7�27. Ceres HAMO C1 FC2 Full and Reduced FOV.
The HAMO sub-phase has a 12-orbit longitude repeat pattern and is organized into six 14-orbit cycles (C1�C6). Two orbits are included after each complete mapping cycle to return accumulated science data prior to the next cycle. Similar to Vesta HAMO, color imaging is acquired in two of the six cycles (C1 and C5) while the spacecraft is at a nadir attitude. Unlike HAMO, the second color cycle is commanded to a slightly off-nadir attitude that can both double as a back-up to the first nadir cycle as well as provide a minor contribution to the topography solution. The other difference from Vesta is that the second color cycle is moved earlier to C5 rather than C6. Since C6 is the first HAMO cycle to be descoped in the event of insufficient hydrazine, the project prefers not to put the higher priority, redundant color cycle at risk.
To reduce the HAMO hydrazine cost, the spacecraft is not turned to a communications attitude during the dark side of each orbit. Instead, the majority of the science data stays onboard until the end of the longitude mapping cycle and is returned during the additional two playback orbits at the end of the sequence cycle. This change increases the overall HAMO duration, but reduces the number of spacecraft turns by a factor of 3.4 (from 144 to 42) from Vesta. A minimum of two dark-side playback passes per cycle support the return of OpNav imaging (one orbit of clear images per dark-side playback), engineering visibility into spacecraft health, and small quantities of VIR science data. To maximize the return of VIR data, GRaND is commanded to a science rate of one sample every 455 seconds to prevent VR5 from overflowing between the two-orbit playback periods. Color imaging cycles C1 and C5 have an additional dark-side playback to return additional orbits of clear filter OpNav images to make room in FC2 internal memory for the large number of color images taken in these cycles. The Ceres HAMO timeline emphasizing the attitude strategy is shown in Figure 7�28, where nadir and off-nadir observing periods are shown in yellow and communication passes are shown in red. Orbits where the clear filter images are returned during the dark-side playback passes are shown in blue. There is a maximum of 2.75 days between engineering playbacks.
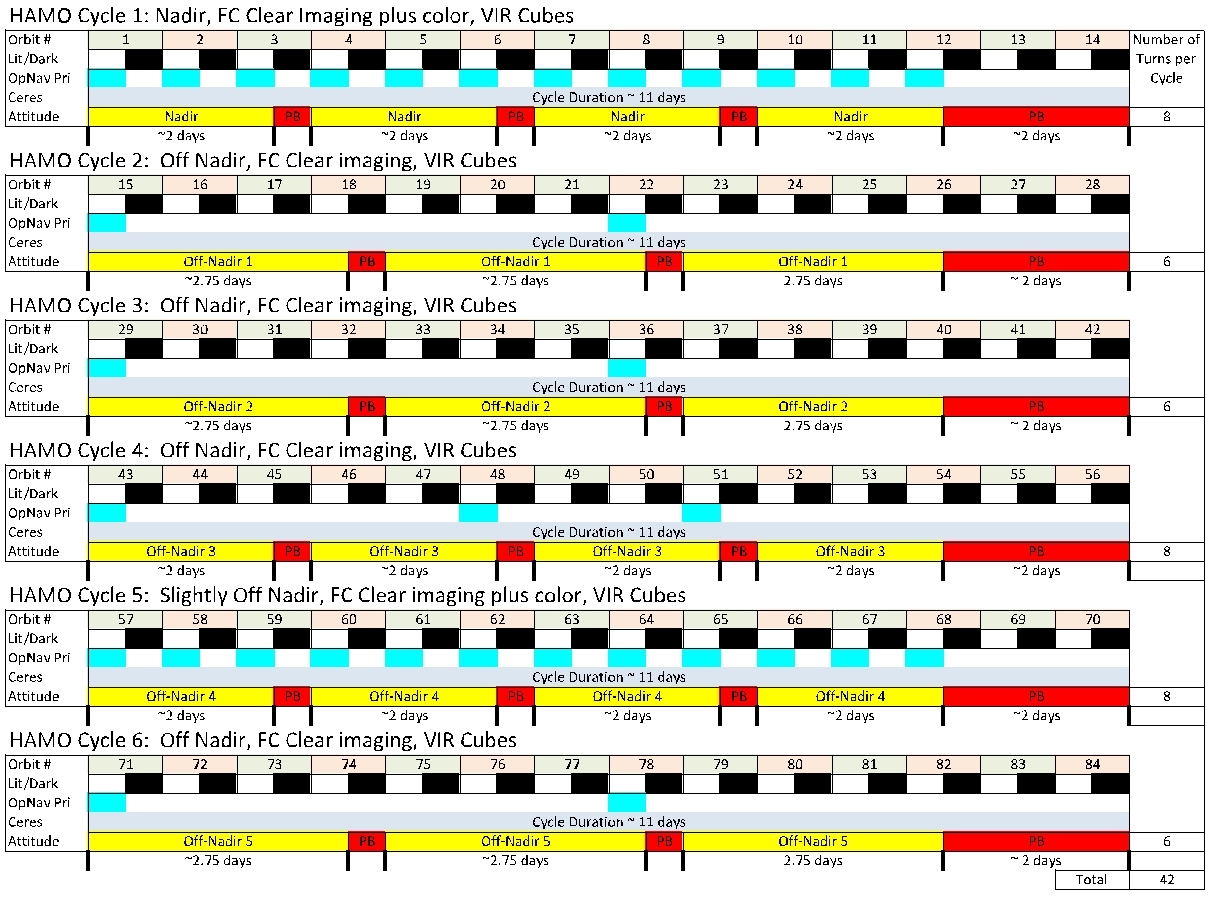
Figure 7�28. Ceres HAMO Attitude Strategy.
Extensive analysis of the effectiveness of various off-nadir angles to simultaneously meet the requirements of both the Stereo and SPC analysis techniques was performed prior to Vesta arrival. That analysis shows that the combination of nadir, ACN(+8,+3), and ACN(-6,+3) provide the greatest percentage topography coverage after only three cycles. Additional cycles are necessary to meet the 80% coverage requirement but more than 60% coverage is obtained from these angles alone. A topography workshop was held following Vesta departure to assess how well the project had done at Vesta and to plan the strategy for Ceres. It was decided to reuse the same off-nadir strategy for the first three cycles and that a second purely nadir cycle was not necessary. A small off-nadir angle ACN(+3,+0) improves the topography analysis without adversely impacting the color imaging effort. The angles discussed here all have small differences in the Cross direction thereby minimizing the illumination variation for Stereo analysis. However, the SPC technique requires illumination variation so the remaining angles are selected to provide that variation. The other consideration in the angle selection is the ability of VIR to acquire coverage during HAMO in the push-broom mode. The nadir and positive Ahead angles provide good VIR coverage in the southern hemisphere, given the sub-solar latitude and the onboard power steering algorithm. In order to get decent northern hemisphere coverage in push-broom mode, VIR requires negative Ahead angles. ACN(-5,-5) in C4 provides VIR with the ability to see the same latitude band north of the equator as seen in C3, allowing the IR integration times to be optimized for both the 3-micron band and the remainder of the VIR IR spectrum. The ACN(-8,-3) angle allows VIR to pushbroom at more northerly latitudes and provides additional stereo angle separation for the SPC analysis. This angle is used at Vesta during both HAMO-1 and HAMO-2. The Ceres observing angles are shown in Figure 7�29.
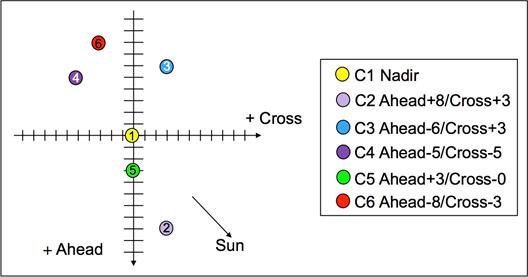
Figure 7�29. Ceres HAMO ACN Angles per Cycle.
Evaluation of the observation plan relative to the topography objectives is accomplished by computing the coverage for four different sets of criteria: optimal and useable Stereo, and optimal and useable SPC. The evaluation criteria are listed in Table 7�15. Optimal conditions allow solutions to be more or less auto-generated. Usable conditions require some human input to the process but still allow solutions to be obtained. The goal is to obtain greater than 80% coverage with four views at all four sets of criteria using the reduced FC2 FOV. This is an extremely conservative approach to evaluating the plan and unless there are extreme data losses during operations, the actual results are expected to exceed these estimates. For Stereo analysis, the incidence angle range criteria most heavily constrain the coverage by eliminating the polar regions. For optimal SPC, the emission angle criteria most heavily constrains the coverage in the equatorial region because the emission angles are small.
The expected topographic data coverage for six cycles of HAMO for the reduced FC2 FOV as computed in CKVIEW is shown in Figure 7�30. Ceres is displayed using a sinusoidal projection and the colors represent the number of views of each surface element that meet the criteria where grey is one view, yellow is two views, green is three views and turquois is four views. The purple color represents areas that achieve greater than five views. The left panels (a and c) show the topographic coverage for the optimal and usable Stereo criteria, respectively. In this case, the plan achieves the required 80% coverage for three views with the useable criteria and is a few percent below the goal for the optimal parameters. The reduced FOV is the most conservative case and yet the plan does meet the objective of 80% coverage when modeled with the full FOV. For optimal and useable SPC (panels b and d), the goal of 80% coverage for three views is met in both cases.
   ===========================================================================
   Technique            Optimal Coverage                           Useable Coverage
   Stereo               5° < Phase < 90°                           5° < Phase < 90°
                        10° < Incidence < 60°                      5° < Incidence < 70°
                        Emission < 55°                             Emission < 70°
                        Illumination Variation < 10°               Illumination Variation < 15°
                        Primary Stereo Separation 15°- 65°         Primary Stereo Separation 15°- 65°
                        Secondary Stereo Separation >15°           Secondary Stereo Separation > 10°
   SPC                  0° < Phase < 90°                           0° < Phase < 90°
                        10° < Incidence < 75°                      10° < Incidence < 85°
                        20° < Emission < 50°                       0° < Emission < 70°
                        20° < Illumination Variation < 70°         10° < Illumination Variation < 85°
                        Stereo Separation 20°- 90°                 Stereo Separation 15°- 90°
   ===========================================================================
Table 7�15. Dawn Topographic Mapping Constraints.

Figure 7�30. Ceres HAMO Topography Coverage After Six Cycles With Reduced FC2 FOV.
The Ceres HAMO data budget is even more constrained than Vesta HAMO so it is extremely difficult to accommodate all color filters. The Level-1 requirements specify that three color filters must be acquired at a resolution less than or equal to 200 m/pixel. With the expected smear at HAMO, which is higher at Ceres with all-RCS attitude control than it was at Vesta, the color image exposures in the equatorial regions are constrained to less than 715 msec to meet the requirements with 99% confidence. With a goal of SNR =100, only three of the seven filters (F2, F3 and F7) meet the SNR requirement without smear. These three filters are compressed at a slightly lossy level of 3.2:1. The remaining filters are lossy compressed at 5.6:1 in order to meet the data budget constraints. Table 7�16 specifies the treatment of the color filters in the HAMO plan. The FC team asserts that there is insignificant corruption to the images using lossy compression of this magnitude. Another option that can be considered once Survey color images are available is to eliminate one filter and reduce overall image compression levels. In addition to resolution requirements, the three Level-1 filters must be acquired over more than 80% of the surface, so these filters are acquired from pole to pole.
   ===========================================================================
   Filter            Level-1 Requirement            Predicted Resolution (m/pixel)            Compression Ratio
   F1 (clear)        yes                            137                                       2.2:1
   F2 (555 nm)       yes                            137-182                                   3.2:1
   F3 (749 nm)       yes                            137                                       3.2:1
   F4 (917 nm)       no                             237-340                                   5.6:1
   F5 (965 nm)       no                             296-350                                   5.6:1
   F6 (829 nm)       no                             190-245                                   5.6:1
   F7 (653 nm)       yes                            137                                       3.2:1
   F8 (438 nm)       no                             534-540                                   5.6:1
   ===========================================================================
Table 7�16. HAMO FC2 Color Filter Selection.
Figure 7�31 illustrates the color imaging strategy for each orbit. One clear image is taken 10 minutes prior to the dark-to-lit terminator crossing to account for timing uncertainty in the orbit. In the far north, a set of four images is acquired at each image station, one clear filter and the three color filters that meet the Level-1 requirements, with image stations every 30 minutes. Then in the northern region, all seven filters are acquired at each image station, with image stations every 20 minutes. The cadence for all filters is increased to every 15 minutes in the equatorial region. Then the pattern is repeated in reverse going to the south towards the south pole.

Figure 7�31. Ceres HAMO FC2 Color Imaging Strategy.
The planned FC2 color coverage is shown in Figure 7�32 with both the full and reduced FOV. Nearly complete coverage is acquired in both C1 and C5, providing full functional redundancy. The primary differences between the two cycles are that the beta angle increases between C1 and C5, and C1 is nadir while C5 has a slight off-nadir viewing geometry.
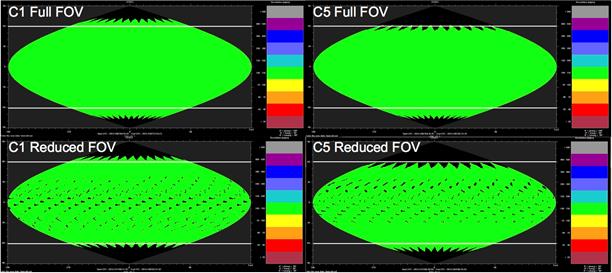
Figure 7�32. Ceres HAMO FC2 Color Imaging Coverage.
VIR data in HAMO are acquired using the pushbroom mode and are concentrated towards the mid-latitudes and the equator. The same latitude band is acquired each orbit in a cycle while the latitude bands move from cycle to cycle. C3 and C4 provide repeat coverage in the same latitude band to allow VIR to select two different sets of exposure times, one cycle optimized for standard Ceres observing and the other optimized for IR integration times in the 3-micron band.
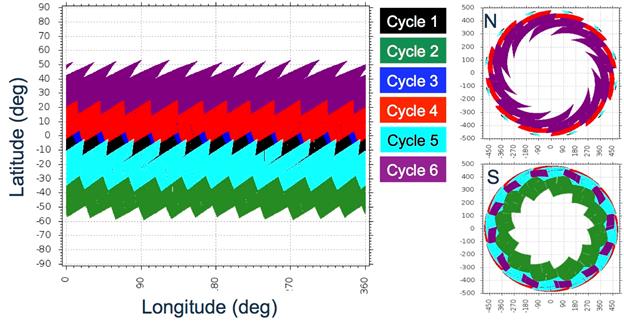
Figure 7�33. Ceres HAMO Planned Coverage for VIR Assuming Perfect Pointing.
Figure 7�33 shows the VIR coverage of overlapping latitude bands with the most recent band covering prior observations. There is also significant redundancy between the equatorial region mapped in C1 and the latitude bands mapped in C3 and C5. The HAMO beta angle makes it difficult to observe the northern hemisphere although that may change slightly if the Ceres pole is different than anticipated. While not apparent from the coverage plots, VIR coverage is less than 25% in HAMO because of the gaps between individual frames. Figure 7-34 shows VIR coverage in HAMO as both a function of time and latitude.
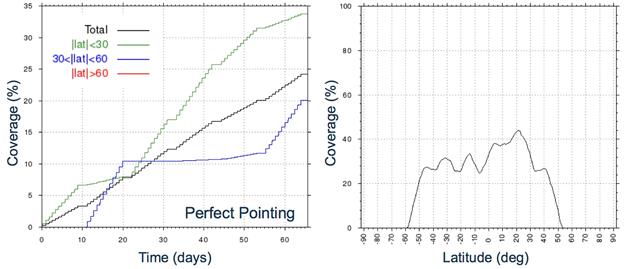
Figure 7�34.Ceres HAMO VIR Coverage with Time and Latitude for Perfect Pointing.
Ceres Science VR allocations for HAMO are the same as shown for RC3 in Table 7�10 in Section 7.3.4 with all FC2 data going to VR8. The FC2 data allocation is detailed in Table 7�17. The clear images are all prioritized as OpNav and compressed at 2.2:1, which may be slightly lossy. The three filters required to meet Level-1 requirements are compressed at 3.2:1 and given high priority in the data queue. The remaining four filters are compressed at 5.6:1 and placed in the medium priority queue. There are a total of 6252 images in the FC2 HAMO plan.
   ===========================================================================
   Cycle   Attitude
             ACN        Clear Filter Images        Color Filter Images            Data Volume (Gb)
                        per Orbit     per Cycle    per orbit      per Cycle
   C1     (+0, +0)      30            360          168            2016            11.57
   C2     (+8, +3)      33            396                                         3.87
   C3     (-6, +3)      32            384                                         3.69
   C4     (-5, -5)      34            408                                         3.68
   C5     (+3, +0)      29            348          161            1932            11.15
   C6     (-8, -3)      34            408                                         3.92
   Total                              2304                        3948            37.87
   ===========================================================================
Table 7�17. Ceres HAMO FC2 Data Allocation.
The VIR data allocation is detailed in Table 7�18. VIR data acquisition is reduced in C1 and C5 because of the large volume of color imaging that is obtained in those orbits. For the remaining cycles, some VIR data is returned during the dark-side playbacks allowing for increased acquisition. For the other orbits, the off-nadir angle selected impacts the playback time available, which accounts for the difference between these cycles.
   ===========================================================================
   Cycle    Attitude
              ACN              Pushbroom per Orbit        Pushbroom per Cycle            Data Volume (Gb)
                               Cubes        Frames         Cubes         Frames
   C1      (+0, +0)            5            310            60            3720            9.24
   C2      (+8, +3)            6            390            72            4680            11.63
   C3      (-6, +3)            7            400            84            4800            11.93
   C4      (-5, -5)            6            450            72            5400            13.42
   C5      (+3, +0)            6            355            72            4260            10.59
   C6      (-8, -3)            6            385            72            4620            11.48
   Total                                                   432           27,480          68.29
   ===========================================================================
Table 7�18. Ceres HAMO VIR Data Allocation.
Because of the extreme data volume constraints during HAMO, the GRaND science data collection interval is increased from one sample every 210 seconds to one sample every 455 seconds. GRaND data is stored in VR5 for the full cycle and is returned only during the long playbacks period at the end of each cycle.
HAMO playback and data storage is the most constrained in of the Ceres science phases. The data volume acquired by the plans developed for the ISB does not fit within the playback and storage constraints and it will need to be reworked during the science sequence pre-build process prior to flight.
There are no occultations during HAMO or within 30 days of the expected HAMO time frame and the 124 kbps telemetry rate is available using standard 34-m stations. The HAMO constraints arise from the request to acquire color image data in all eight filters during the nadir cycles while acquiring nearly complete near-equatorial (± 30o) surface coverage with VIR. A complicating factor is that the DSN viewing geometry is poor with view period gaps between the Canberra to Madrid and Madrid to Goldstone handovers. These view period gaps grow from a few minutes at the start of HAMO to more than an hour at the end of HAMO. Any delay in the HAMO start time will make these gaps longer, while arriving earlier somewhat reduces the issue. Since the details of the playback capability depend heavily on the playback timing, which in turn depends on the Dawn ephemeris, it was decided not to try and work the details of the playback strategy until closer to HAMO. It is likely that some reduction in data volume will be required. This is achieved through a combination of increased compression ratios for the four color filters not required to meet the Level-1 requirements and a reduction of the number of VIR frames acquired.
Regardless, the volume of FC2 data acquired is much larger than the VR used as the intermediary storage during the playback process in continuous playback mode. Any gaps in coverage that occur during HGA tracking passes and that occur prior to the time of the first sequence delivery will require a rework of the spacecraft bus interface command timing that controls the flow of data from FC2 to the VR to prevent VR8 overflow. If these gaps are introduced after sequences are delivered, then either real-time commanding will be required to prevent overflow or overflow and data loss will have to be accepted. VR8 is given higher priority than VR4 (VIR) in the VR priority table. Deferring FC2 data playback by changing the bus interface timing during continuous playback can result in the loss of VIR data return, depending on the playback margin available.
The orbit transfer period is dedicated to the thrusting required to change the orbit from HAMO to LAMO. There are no science or OpNav activities during the transfer to LAMO. The VRs are configured back to the Cruise 1 allocations at the end of HAMO to span the longer durations between tracking passes during this period. GRaND remains on, collecting science packets at the 210-second sampling rate that are returned during the weekly engineering playbacks. There is a seven-day coast at the end of the orbit transfer to accommodate the trajectory correction maneuver (TCM) that corrects any delivery error to LAMO. The coast begins with a turn to nadir attitude to allow GRaND to collect LAMO altitude science data while the NAV team determines the orbit parameters from the LGA tracking passes. Once nadir, GRaND acquires science data at the 140-second sampling rate. During this coast, FC1 performs a nadir-pointed calibration for routine instrument maintenance. The third day of the coast is spent at a communications attitude so that the maneuver sequence can be transmitted to the spacecraft and the engineering data from the last thrust sequence is returned to the ground. FC1 playback is also returned during the playback period. Two days are allocated for the TCM window that is followed by a two-day EU period during which the VRs are resized to the Ceres science allocations. If the TCM is not required, real time commands are sent to the spacecraft to return to a nadir attitude until the EU uplink window. This alternative provides additional science data for GRaND and reduces hydrazine consumption by the spacecraft.
The purpose of LAMO is to map the elemental composition of Ceres by obtaining spatially resolved neutron and gamma ray spectra and to determine the Ceres gravity field to less than or equal to a 300 km half wavelength with global tracking coverage. While GRaND may detect Ceres at the HAMO altitude, LAMO is the only orbit close enough to Ceres that allows GRaND to meet its science requirements. The goal for GRaND is to obtain full longitudinal coverage with a minimum of 30 days (720 hours) of data acquisition while pointed nadir without interference from solar energetic particle events. This can be accomplished in the first two cycles of LAMO using a 75% nadir duty cycle, and the last two cycles provide redundancy. Gravity data are obtained during the HGA tracking passes used to return science and engineering data. The gravity team also uses LGA tracking data obtained while the spacecraft is nadir- pointed. The project requests continuous DSN tracking coverage throughout LAMO. In February and March 2016 the Sun-Earth-Probe angle is less than 20°, during which radiometric data quality will be too low for the gravity investigation; however, poor quality gravity science data during this period does not prevent the project from meeting the gravity science requirements.
LAMO is the one Ceres phase that plans to use the hybrid attitude control mode to save hydrazine, however, all objectives can be accomplished in all-RCS mode if necessary.
In addition, the high-resolution LAMO images provide the best data set to address the science objective of mapping the crater size-frequency distribution in order to establish a relative chronology of the crustal units and population of impactors in the early solar system. The minimum FC2 pixel scale (iFOV x range) in LAMO is roughly 35 m/pixel. This resolution estimate does not account for the smear associated with ACS dead-banding motion, the spacecraft motion, or Ceres rotation, which are significant at ~5 pixels/s for FC2 at this low altitude, and change the effective resolution as a function of integration time. For this reason and because of data volume restrictions, only clear filter images are taken with FC2. VIR observations are targeted to features of scientific interest and accomplish only minimal coverage of the surface.
The LAMO reference trajectory is dawn_ref_151001-160603_140528_isb_CTL_CSL_v1.bsp. The average orbit radius is 851.2 km, and the average period is 5.41 hours. The beta angle is almost constant near 45°, varying between 44.6° and 44.4° in the ISB trajectory. For the case of all-RCS operations, LAMO consumes approximately half of the hydrazine budget of the Ceres mission so hydrazine consumption is a primary driver in determining the orbit requirements. In addition to the number of commanded spacecraft turns, there are three attributes of the LAMO orbit that significantly impact hydrazine usage: altitude, beta angle, and arrival date.
The LAMO altitude selection was determined by performing a trade study between the sensitivity and resolution of the GRaND instrument needed to meet the science objectives and the spacecraft resources required to observe at low altitudes. Neutron counting rates vary with the solid angle subtended by the target. For any nuclear spectroscopy measurements, it is desired that the ratio between the spacecraft orbit radius (R) and the target body radius (R0) be less than two (R/R0 < 2) . However, the steep increase in hydrazine consumption rates with decreasing altitude means that relatively small changes in altitude have significant impacts on the predicted duration of the LAMO sub-phase. Therefore the selection of the LAMO altitude is ultimately constrained by the hydrazine consumption rate. Orbits between 1000 km and 800 km are evaluated for longitudinal coverage and hydrazine cost. The GRaND team requests that the Ceres LAMO has an equivalent solid angle to the successful Vesta LAMO, with R/R0 = 1.79. The LAMO trajectory has R/R0 = 1.75 and provides a phase duration of 92 days for the ISB hydrazine budget. Figure 7-35 from Prettyman et al. (2012) provides a comparison of GRaND sensitivity at Ceres LAMO compared to Vesta LAMO and other missions.
Unlike the higher altitude science phases, the LAMO beta angle is fixed. The target beta angle is 45° ± 1°. The beta angle fluctuates slightly during LAMO operations due to perturbations from the RCS thruster firings. A trade study was performed to optimize hydrazine cost versus lighting conditions. Initially the science team requested the lowest safe beta angle that is achievable without a plane change to improve the lighting conditions for VIR. It was later discovered that hydrazine rates increase with decreasing beta angle as seen in Figure 7-36. The target beta angle of 45° was adopted in order to save 0.5 kg of hydrazine over an earlier trajectory with a beta angle of 42°. If the actual hydrazine budget during Ceres operations is less than expected, increasing beta angle further is one way of reducing the hydrazine cost of this phase.
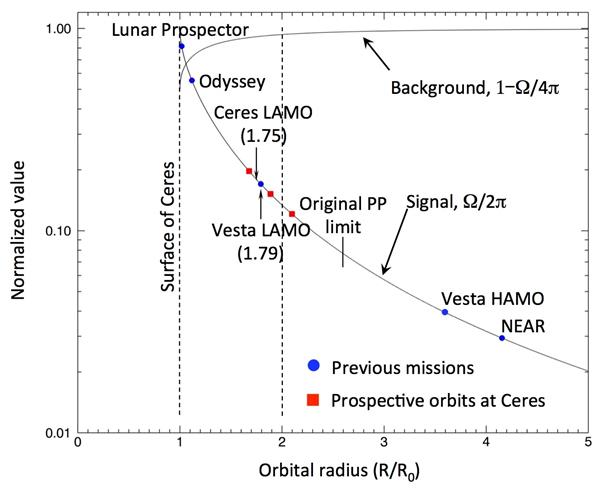
Figure 7�35. Comparison of Gamma Ray Experiments for Missions at Different Target Distances.
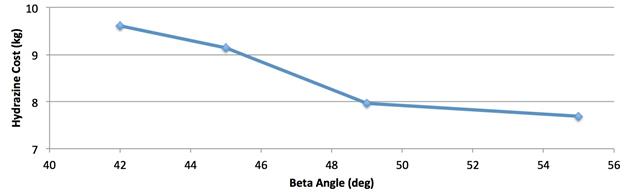
Figure 7�36. Ceres LAMO Hydrazine Cost as a Function of Beta Angle.
The LAMO sub-phase has a 93-orbit longitude repeat pattern and is organized into four 101-orbit, 23-day cycles (C1-C4). Each cycle is further divided into five 20-orbit segments plus a final phasing orbit at the end. Each segment consists of 12 orbits of nadir imaging, 3 orbits of either nadir pointing without imaging or an orbit maintenance maneuver (OMM) window, and five orbits of HGA tracking for gravity science and communications. This structure accommodates the 75% nadir duty cycle since it ensures that the longitude coverage lost during the long tracking pass is covered during a subsequent cycle. Two complete cycles are required to achieve total global mapping of the surface. The attitude strategy is illustrated in Figure 7-37. The nadir imaging orbits are yellow, the non-imaging nadir orbits are orange, the tracking passes are red, the OMM orbits are green, and the nadir phasing-orbit is blue. The graphic shows a series of 93-orbit repeat patterns for each row and demonstrates how the 101-orbit cycle pattern provides compete coverage every two cycles. NAV may reverse the order of the OMM window and playback pass of the first OMM in each cycle. This enables the flight team to use a three-day build schedule for OMM development to improve the quality of the maneuvers.

Figure 7�37. Ceres LAMO Attitude Strategy.
GRaND acquires science data whenever the spacecraft is at a nadir attitude in LAMO. For segments without an OMM there are 15 nadir orbits and 5 playback orbits giving a 75% nadir duty cycle. For the two segments each cycle that have 3-orbit OMM windows, the nadir duty cycle is 60%. The overall nadir duty cycle is 69%. GRaND acquires 15.9 days of nadir data each cycle and 63.8 days of data in the nominal 92-day LAMO that provides full redundancy in meeting the Level-1 requirements. The GRaND instrument is configured to acquire one sample every 140 seconds. This frequency is different from Vesta LAMO rate of one sample every 70 seconds. There are 12 seconds of dead time for every sample when the instrument is packaging the data for transmission to the spacecraft so this change minimizes the impact of dead time on data collection. The 140-second sampling interval provides 2.6° resolution per sample.
Gravity science is acquired 25% of the time (approximately 550 hours) in LAMO during the HGA communications passes, and for the remainder of LAMO using the LGA antennas. Tracking is requested 24 hours a day, seven days a week during LAMO although it is certain that some passes will be lost to DSN negotiations with other flight projects and routine operational issues. Gravity must be measured to degree 5 in order to meet the Level-1 requirements.
FC2 acquires images for 12 orbits of every 20-orbit sequent, or 60 orbits per 101-orbit cycle. Gores in longitudinal coverage occur during the non-imaging and communications orbits. These gores are evident in the C1 coverage plot in Figure 7-38. However, the careful spacing of subsequent imaging orbits in C2 serves to mostly fill in the gaps, providing nearly global coverage after the first two cycles. C3 and C4 provide fully redundant global coverage.
In addition to the nadir imaging, FC2 also acquires 10 images during each turn from nadir to the communications attitude. These are off-nadir "images of opportunity" that may contribute to the topographic analysis of Ceres. The exact path the FC2 boresight takes from nadir to the limb will vary with the placement of the turn within the orbit. Examples of these off-nadir images are shown in Figure 7-39. Only the first six or seven of 10 images acquired are shown. The last few images are not on the body. Note that in this figure, the Ceres texture map from Hubble is wrapped on the surface, and unobserved terrain is a solid tan color. The imaging paths for C1 and C2 look similar because the slews are set to the dayside equator crossing for both cycles. The slew in C3 occurs one hour after the dayside equator crossing. C4 slews begin at the south-pole crossing so all images are acquired on the dark side of the terminator and are not shown. The most efficient location for the turns may change once the LAMO start date is known. At that time, images that are acquired on the dark side are removed from the sequence. The first image of all activities is at nadir, one minute before the slew begins. Images are acquired every two minutes.
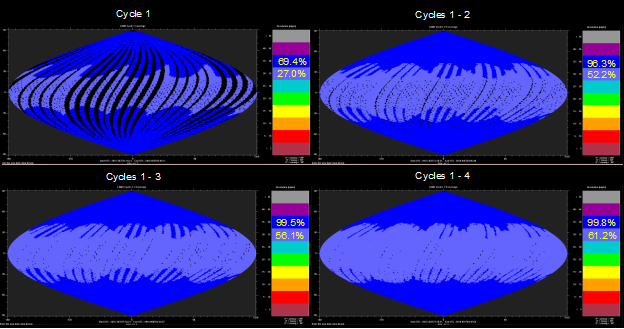
Figure 7�38. Ceres LAMO Four Cycles of FC2 Observations.
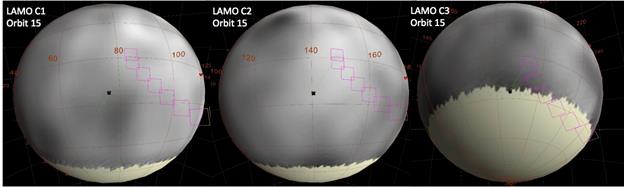
Figure 7�39. Ceres LAMO FC2 Limb Imaging.
The ISB plan shows VIR acquisition focuses on the equatorial regions to take advantage of the best lighting conditions. Once Survey data is acquired, the VIR team may redistribute the placement of their cubes to other specific orbits or latitude regions of interest. VIR acquires data during only six orbits for each segment in C1, for a total of 30 orbits in that cycle. In C2, data acquisition increases to eight orbits per segment and 40 orbits per cycle. In C3 and C4 where redundant FC2 coverage is no longer needed at the poles, VIR acquires data on 10 orbits per segment for 50 orbits per cycle. However, the VIR FOV is so small at LAMO altitude that total coverage is less than 1% of the surface. Figure 7-40 illustrates the VIR surface coverage in both cylindrical and polar projections.

Figure 7�40. Ceres LAMO Planned Coverage for VIR Assuming Perfect Pointing.
Ceres Science VR allocations for LAMO are the same as shown for RC3 in Table 7�10 in Section 7.3.4 with all FC2 data going to VR8. Details of the FC2 data acquisition metrics are listed in Table 7�19. All clear filter images are compressed at 3.6:1 as is the case for Vesta LAMO. No color imaging is planned because of the excessive smear that would result from the long exposures necessary for the color filters.
   ===========================================================================
   Cycle   Clear Filter Images Nadir    During Turns    Total Images    Data Volume (Gb)
           per Orbit     per Cycle      per Cycle       per Cycle
   C1      65            3900           30              3930            2.16
   C2      65            3900           30              3930            2.16
   C3      61            3660           30              3690            2.03
   C4      57            3420           30              3450            1.90
   Total                 14,880         120             15,000          8.25
   ===========================================================================
Table 7�19. Ceres LAMO FC2 Data Allocation.
VIR data allocations are listed in Table 7�20. All cubes are acquired with full VIS+IR frames.
   ===========================================================================
   Cycle   Pushbroom per Orbit       Pushbroom per Cycle       Data Volume (Gb)
           Cubes     Frames          Cubes        Frames
   C1      3            180          90           4500            11.18
   C2      3            150          120          6000            14.91
   C3      3            150          150          7500            18.64
   C4      3            150          150          7500            18.64
   Total                             510          25,500          63.37
   ===========================================================================
Table 7�20. Ceres LAMO VIR Data Allocation.
GRaND LAMO data volume for 92 days of collection at the 140 sec sample rate is 12.3 Gb.
There are at least two sources of known playback disruption during LAMO: Earth occultations and DSN view period gaps. Occultations are expected in the first two cycles of LAMO in the ISB mission timeline. At the start of LAMO, the occultation duration is roughly 35 minutes and it diminishes with time until they disappear before the end of C2. At Vesta, playback data return was protected against occultation related outages by commanding the spacecraft to real-time only telemetry from 10 minutes before until 10 minutes after the predicted occultation begin/end times. The 10 minute margin is added to accommodate along-track uncertainty in the ephemeris, from uncertainty in the gravity model. At Ceres, the gravity field is expected to be less complex, however the ∆V imparted by the RCS while controlling the spacecraft attitude is a new uncertainty. Fifteen minutes of margin is included on either side of expected occultations in order to mitigate the uncertainty in the occultation prediction timing. The presence and duration of occultations during LAMO are directly related to the mission timeline. Should Dawn arrive at LAMO sooner, more cycles are impacted and the occultation durations would likely increase. Conversely, if Dawn arrives at LAMO later, the opposite is expected.
The second disruption to data playback is associated with DSN station visibility. At the beginning of LAMO, there are brief one to ten-minute long station visibility gaps during the hand-overs from Canberra to Madrid. Like the occultations, these gaps diminish in time and eventually go away early in LAMO. However, early arrival at LAMO increases the impact of the downlink loss associated with the station gaps. Details of the downlink strategy are reworked when the LAMO timing is better understood.
In addition to the known sources of playback loss, there are losses associated with DSN schedule conflicts, DSN station outages and spacecraft anomalies. DSN conflicts are likely since Dawn needs a 70-m antenna to support downlink at the 124 kbps rate during most of LAMO. If a 70-m station is not available, then the downlink rate is reduced to 62 kbps with a significant downlink loss. The ISB plan includes 2.5 hours of playback margin in each pass in addition to the planned outages for occultations. Roughly 30 minutes of this margin is used to cover station transitions. The remainder is there to cover unplanned events. The memory margin policy for LAMO is set at 90% fill leaving little additional margin against data losses not accommodated by the playback margin. There is no plan to reduce the data volume acquired to accommodate potential playback losses. The data are prioritized such that the spacecraft engineering, instrument housekeeping and GRaND science data are fully protected to the best of our ability. FC2 data are given next highest priority and VIR data are the lowest priority. Loss of downlink data volume results in the loss of VIR data.
The volume of FC2 data acquired is larger than the VR used as the intermediary storage during the downlink process in continuous playback mode. Any gaps in coverage that occur during HGA downlink passes that are known prior to the time of the first sequence inputs require a rework of the spacecraft bus interface command timing that controls the flow of data from FC2 to the VR to prevent VR8 overflow. If these gaps are introduced after the sequences are delivered, then either real-time commanding is required to prevent overflow or overflow and data loss is accepted. VR8 is given higher priority than VR4 (VIR) in the VR downlink priority table. Deferring FC2 data playback by changing the bus interface timing during continuous playback can result in the loss of VIR data return, depending on the playback margin available.
In February and March of 2016, Dawn is close enough to the Sun as viewed from Earth that the radio science observing constraint (SEP > 20°) is violated. Given the geometry of this period, there is no effect on communications with the spacecraft although the elongation angle is too low to support the gravity science experiment.
Lastly, the timing of the end of LAMO is uncertain. The end of funded prime mission operations is June 30, 2016; however, the usable hydrazine may be expended before then. The ISB plan includes the four cycles of LAMO science that the hydrazine usage models support for an RCS-only mission with margin. If the Ceres operations margin has not been depleted, the plan is to extend LAMO one cycle at a time until either the hydrazine is depleted or the end of funded operations is reached. Operationally this is similar to the way the spacecraft was operated at Vesta LAMO, when the operations margin was deployed at the end of the LAMO phase and its duration was also uncertain. It is possible that one or more cycles of an extended LAMO are executed at a small off-nadir angle (~5°) to improve the topography data set.
Despite the limitations resulting from the loss of the second reaction wheel, the Ceres mission science data volume return is comparable to the Vesta mission excluding the additional data acquired during Vesta HAMO-2 since the spacecraft will remain in Ceres LAMO. Table 7�21 provides a comparison of Vesta planned data return to Ceres planned data return for FC2 and VIR. The Vesta values do not reflect the as-flown results. In the case of Vesta LAMO, the VIR data is stated in full-slit equivalents. Much of the Vesta LAMO data is acquired in quarter slit mode and a conversion is made to full slits to aid in comparison.
   ===========================================================================
   Science Orbit            FC2 Clear Filter (F1)     FC2 Color Filters (F2-F8)    VIR (Full VIS+IR frames)
                 Vesta      Ceres                     Vesta       Ceres            Vesta        Ceres
   RC3           213        1,584                     250         315              2,160        9,330
   Survey        1,128      901                       1,554       728              16,180       20,395
   HAMO          2,630      2,304                     4,690       3,948            20,900       27,480
   LAMO          11,184     15,000                    3,480                        10,964       25,500
   HAMO-2        2,800      n/a                       1960        n/a              34,300       n/a
   ===========================================================================
Table 7�21. Comparison of Ceres and Vesta Science Data Acquisition Plans.
GRaND data acquisition for Ceres LAMO is 92 days with 75% duty cycle and is longer than the nominal Vesta LAMO of 70 days with the same duty cycle. As at Vesta, there is also the possibility of an extended LAMO. If the hydrazine consumption is consistent with the ISB plan and the reaction wheels continue to function in the hybrid mode, then an optimistic LAMO extension is a total duration of 184 days. This exceeds the extended Vesta LAMO of 140 days.
Unlike the Vesta mission, the Ceres mission ends in LAMO. After the primary Ceres mission is complete, there may be some remaining hydrazine available to continue operations. If the wheels do not fail, there could be as much as three additional months of continued LAMO operations. In addition, any remaining hydrazine from the contingency allocation can be used to extend operations. Following LAMO C4 until the end of the primary mission, the baseline plan is to continue acquiring GRaND and gravity data in a manner similar to the first three months of LAMO. FC2 and VIR data are acquired although the balance between the data allocations of the two instruments may be adjusted if the imaging coverage at this altitude is complete. Slight off- nadir angles (≤ 5° ) may be commanded or the pointing dead bands may be increased to obtain high-resolution topography. If hydrazine is projected to be available for operations beyond June 30, 2016, then the project will request NASA to approve an extended mission. If an extension is granted then the spacecraft continues to acquire the proposed science observations until the hydrazine is depleted at which time the spacecraft is no longer able to maintain an attitude to collect data, communicate with the ground operations team, or orient the solar panels to the sun. At this point mission operations are terminated. The LAMO orbit is very stable. The orbit has been propagated for 50 years for a wide range of gravity fields and it shows very little change, so the Dawn spacecraft will simply continue to orbit Ceres.
The purpose of the Science Descope Plan is to establish a prioritization scheme for Vesta and Ceres science observations in a quantified manner to facilitate decisions during mission re-planning that result from anomalous situations. This Science Descope Plan is based on the cost to benefit ratio of discrete sets of observations. The character of the Science Descope Plan is different for Vesta and Ceres. The primary constraint at Vesta was time so the descope plan applies during situations when the Vesta timeline is compressed due to anomalies that require mission re-planning or when the Science Plan is interrupted by extended periods of instrument malfunction. For Ceres the primary constraint is hydrazine although there is a connection to time as well since all time at Ceres incurs a hydrazine cost. Hydrazine is lost due to inaccuracies in the initial predictions, safe modes or other anomalies (for which there is a contingency allocation), or other time delays that consume hydrazine.
The following list shows the objectives in highest to lowest priority.
1) Obtain image mosaics at <100m resolution covering 80% of Vesta in the clear filter and three color filters (HAMO-1 and HAMO-2)
2) Collect more than 5000 high spatial/spectral frames with spatial resolution <800m with frame-to-frame overlap (two-cycle Survey and HAMO-1)
3) Obtain a topographic map of 50% of Vesta to 25m height accuracy (two off-nadir views in HAMO-1 and HAMO-2 with non-optimal incidence or emission and stereo angles)
4) Obtain bulk elemental composition measurements of Vesta (30-day LAMO)
5) Obtain gravity field of Vesta to degree five (30-day LAMO)
6) Obtain hemispheric elemental composition maps (<50-day LAMO)
7) Obtain gravity field to degree 10 (50-day LAMO)
8) Collect more than 10000 high spatial/spectral frames with spatial resolution <800m with frame-to-frame overlap (4-cycle Survey with HAMO-1)
9) Obtain image mosaics covering 95% of Vesta in the clear filter and six color filters (HAMO-1 and HAMO-2)
10) Obtain spatially-resolved elemental composition maps including the composition of the south polar basin (70-day LAMO)
11) Obtain a topography map to 10m accuracy (minimum of five off-nadir views with varying illumination angles and solar azimuth and elevation viewing angles)
Tier 1: Minimum Mission Success Data Set (maximum descope): achieve two orbits of Survey; three cycles of HAMO-1 mapping; 30-day nominal LAMO; and at least one cycle of mapping in HAMO-2
1) Collect >5000 high spatial/spectral frames with 20% frame-to-frame overlap
2) Obtain image mosaics covering 80% of the Vesta surface at nadir in the clear filter and three color filters, and at least 50% of the surface with nadir and two off-nadir views in the clear filter
3) Obtain disk-integrated surface elemental composition
4) Obtain gravity field to degree five (<180 km half-wavelength)
5) Obtain nadir imaging with three color filters of the northern polar region (> 66°N)
Tier 2: Tier 1 with 40-day nominal LAMO
3a) Obtain hemispheric surface elemental composition maps
4a) Obtain gravity field to degree 10 (<90 km half-wavelength)
Tier 3: Tier 2 with at least four orbits of Survey
1a) Collect >10,000 high spatial/spectral frames with frame-to-frame overlap
Tier 4: Tier 3 plus three cycles of HAMO-2 and four cycles of HAMO-1
2a) Obtain image mosaics covering 95% of Vesta in the clear filter and six color filters and cover at least 70% of the surface with nadir and two off-nadir views
Tier 5: Tier 4 plus 70-day nominal LAMO
3b) Obtain spatially-resolved elemental composition maps including the composition of the south polar basin
Tier 6: Tier 5 plus four cycles of HAMO-2 and six cycles of HAMO-1
3c) Obtain coverage of at least 80% of the surface with nadir and five off-nadir views with incidence angles > 10 degrees and stereo-pair angular separation of at least 10 degrees
Tier 7: Tier 6 plus six-cycle Survey orbit (nominal Science Plan)
1a) Collect > 15000 high spatial/spectral frames at <800 m spatial resolution with frame-to-frame overlap
Tier 8: Tier 7 plus 90-day LAMO orbit (enhancement)
3c) Obtain higher precision spatially-resolved elemental composition maps
Table 8-1 shows the Vesta science descope plan in the event of a mission re-plan. The time saved by invoking each descope is listed. Steps in blue font indicate reductions that endanger Level-1 required data. Steps in red font indicate reductions that sacrifice Level-1 required data.
   ===========================================================================
   Vesta Science Descope Actions                          Time Saved
   Shorten HAMO-2 to three mapping cycles (remove C3)     +5 days
   Shorten HAMO-1 to five mapping cycles (remove C5)      +5 days
   Shorten HAMO-1 to four mapping cycles (remove C6)      +5 days
   Shorten LAMO to 60 days                                +10 days
   Shorten LAMO to 50 days                                +10 days
   Shorten LAMO to 40 days                                +10 days
   Shorten HAMO-2 to two mapping cycles (remove C2)       +5 days
   Shorten HAMO-1 to three cycles (one nadir)             +5 days
   Shorten HAMO-2 to one cycle, nadir (remove C1)         +5 days
   Shorten LAMO to 30 days                                +10 days

   Total before Level-1 sacrifice                         +50 days
   Total after Level-1 sacrifice                          +20 days

   Grand Total                                            +70 days
   ===========================================================================
Table 8�1. Vesta Science Descope Plan for Mission Re-plan.
The following list shows the observations in highest to lowest priority.
1) Image mosaics at <200m resolution covering 80% of Ceres in the clear filter and three color filters (HAMO)
2) More than 4000 high spatial/spectral frames with spatial resolution <400m with frame-to-frame overlap (HAMO)
3) Topographic map of 50% of Ceres to 50m height accuracy (two off-nadir views in HAMO with non-optimal incidence or emission and stereo angles)
4) Bulk elemental composition measurements of Ceres (23-day LAMO)
5) Gravity field of Ceres to degree five (23-day LAMO)
6) Hemispheric elemental composition maps (<46-day LAMO)
7) Gravity field to degree 10 (46-day LAMO)
8) More than 8000 high spatial/spectral frames with frame-to-frame overlap (Survey with HAMO)
9) Image mosaics covering 95% of Ceres in the clear filter and six color filters (HAMO)
10) Spatially-resolved elemental composition maps (69-day LAMO)
11) Topography map to 20m accuracy (minimum of five off-nadir views with varying illumination angles and solar azimuth/elevation viewing angles in HAMO)
Tier 1: Minimum Mission Success Data Set (maximum descope): achieve all of Survey; 3 cycles of HAMO mapping, and 23-day nominal LAMO.
1) Collect > 4,000 high spatial/spectral frames with 20% frame-to-frame overlap
2) Obtain image mosaics covering 80% of the Ceres surface at nadir in the clear filter and three color filters, and at least 50% of the surface with nadir and two off-nadir views in the clear filter
3) Obtain disk-integrated surface elemental composition
4) Obtain gravity field to degree five (<180 km half-wavelength)
Tier 2: Tier 1 with 46-day nominal LAMO
3a) Obtain hemispheric surface elemental composition maps
4a) Obtain gravity field to degree 10 (<90 km half-wavelength)
Tier 3: Tier 2 with at least four cycles of HAMO
1a) Collect > 8.000 high spatial/spectral frames with frame-to-frame overlap
Tier 4: Tier 3 with five cycles of HAMO
2a) Obtain image mosaics covering 95% of Ceres in the clear filter and 6 color filters and at least 70% of the surface with nadir and two off-nadir views
Tier 5: Tier 4 plus 69-day nominal LAMO
3b) Spatially-resolved elemental composition maps
Tier 6: Tier 5 plus 6 cycles of HAMO
3c) Obtain coverage of at least 80% of the surface with nadir and five off-nadir views with incidence angles >10 degrees and stereo-pair angular separation of at least 10 degrees
Tier 7: Tier 6 plus 92-day LAMO orbit (enhancement)
3c) Obtain higher precision spatially-resolved elemental composition maps
Table 8-2 shows the Ceres science descope plan in the event of a mission re-plan. The time saved by invoking each descope is listed. Steps in blue font indicate reductions that endanger Level-1 required data. Steps in red font indicate reductions that sacrifice Level-1 required data.
   ===========================================================================
   Ceres Science Descope Actions                       Hydrazine Saved (kg)      Cumulative Savings (kg)
   Shorten LAMO to three mapping cycles (remove C4)    2.2                        2.2
   Shorten HAMO to five mapping cycles (remove C6)     0.4                        2.6
   Shorten LAMO to two mapping cycles (remove C3)      2.1                        4.7
   Shorten HAMO to four mapping cycles (remove C5)     0.4                        5.1
   Shorten HAMO to three mapping cycles (remove C4)    0.4                        5.5
   Shorten LAMO to one mapping cycle (remove C2)       2.1                        7.6
   Remove LAMO and associated Transfer                 3.9                        11.5
   Shorten HAMO to two mapping cycles (remove C3)      0.4                        11.9
   Shorten HAMO to one cycle (one nadir, remove C2)    0.4                        12.3
   Remove HAMO and associated Transfer                 1.2                        13.5

   Total before Level-1 sacrifice                      7.6
   Total after Level-1 sacrifice                       5.9

   Grand Total                                         13.5
   ===========================================================================
Table 8�2. Ceres Science Descope Plan for Mission Re-plan.
The mechanism developed by the DSC to communicate activity-level information to the instrument and science teams is the Science Time-Ordered Listing spreadsheet (SciTOL). The spreadsheet is created in Excel with a format defined by the Dawn Science Time-Ordered Listing Software Interface Specification. Prior to each instrument sequence development phase the SciTOL is generated to capture all elements of the sequence design. The SciTOL allocates observation time as well as time for all other ancillary instrument functions. The level of detail in the SciTOL is at the sub-activity level since each activity needs to be broken into individual components to enable modeling and instrument commanding. Data volume in both instrument memory as well as the spacecraft DRAM is modeled at a high level. The spreadsheet is ingested by the instrument team uplink software and provides the framework for the automatic production of the instrument sequence files. The primary fields in the spreadsheet are as follows:
Activity Absolute Start Time (SEQGEN format for Spacecraft Event Time)
Activity Absolute End Time (SEQGEN format for Spacecraft Event Time)
Sequence ID for the file containing those commands
Activity Absolute Start Time (Excel format)
Activity Absolute End Time (Excel format)
Activity Relative Start Time (hh:mm:ss from the relevant epoch)
Activity Relative End Time (hh:mm:ss from the relevant epoch)
Activity Duration (hh:mm:ss)
Activity Name (following the convention <instrument>_<mission sub-phase>_<cycle> <Description>_<repetition number or orbit number>
An example of the set of SciTOL entries to define a standard OpNav activity in the Vesta Transfer to HAMO-1 mission sub-phase is as follows:
   ===========================================================================
   SCI_VTH_TurnToNadir_001 � Turn the spacecraft to a nadir attitude
   SCI_VTH_XBtoFC2_001 � Switch the spacecraft bus interface to FC2
   SCI_VTH_PzTMONsEnable_001 � Enable the +Z pointing TMONS to protect FC when the cover is open
   FC2_VTH_OpenDoor_001 � Open the FC2 cover
   NAV_VTH_OpNav_001 � Acquire the OpNav images
   FC2_VTH_CloseDoor_001 � Close the FC2 cover
   SCI_VTH_PzTMONsDisable_001b � Disable the +Z pointing TMONS when cover is closed
   FC2_VTH_PowerOffFee_001 � Power off the FC2 Front End Electronics
   SEQ_VTH_TurnToEarth_001 � Turn the spacecraft to HGA-to-Earth attitude for playback
   SCI_VTH_XBtoVIR_001 � Switch the spacecraft bus interface to VIR when FC2 transfer is complete
   SEQ_VTH_Playback_001 � Complete playback activity
   SEQ_VTH_PlaybackSetup_001 � Acquire real time data for 5 min before playback starts
   SEQ_VTH_PlaybackEng_001 � Playback engineering subsystem data
   SEQ_VTH_PlaybackOpNav_001 � Playback OpNav science data from VR10
   SEQ_VTH_PlaybackGRaND_001 � Playback GRaND science data since last playback
   SEQ_VTH_PlaybackMargin_001 � Allow margin for extended playback
   SEQ_VTH_GoToRT124K_001 � Change telemetry mode to RT_124K prior to next turn
   ===========================================================================
The following tables list the background sequence load boundaries for science phase sequences. The start and end dates are the load boundaries for each background sequence that may overlap. Nominal sequence end times are listed below; times with an * indicate that the sequence was terminated prematurely by a safe mode or safe_comm.
The background sequence load boundaries are listed in Table 10-1. End dates annotated with * indicate that the sequence was truncated prematurely by a spacecraft anomaly (see Table 10-8).
   ===========================================================================
   SEQ ID     Phase                  Start Date             End Date
   da001      Approach OpNav 1-5     2011-123T10:54:00      2011-152T17:23:00
   da002      Approach OpNav 6-11    2011-156T00:05:00      2011-179T18:58:00*
   da003      Approach OpNav 12-16   2011-185T00:30:00      2011-194T13:48:00
   da004      Approach OpNav 17-21   2011-194T15:30:00      2011-209T12:33:00
   da005      Approach OpNav 22-23   2011-209T12:35:00      2011-213T23:58:00
   da006      Survey C1, C2          2011-223T12:05:00      2011-229T07:59:00
   da007      Survey C3, C4          2011-229T09:05:00      2011-235T03:59:00
   da008      Survey C5. C6, C7      2011-235T04:30:00      2011-243T04:14:00
   da009      Transfer to HAMO-1     2011-243T21:00:00      2011-272T09:58:00*
   da010      HAMO-1 C1, C2          2011-272T17:00:00      2011-284T05:26:00
   da011      HAMO-1 C3, C4          2011-284T05:20:00      2011-294T10:24:59
   da012      HAMO-1 C5, C6          2011-294T10:00:00      2011-306T10:39:00
   da013      Transfer to LAMO       2011-306T10:42:00      2011-327T22:43:00
   da014      Transfer to LAMO       2011-341T16:00:00      2011-346T22:43:00*
   da015      LAMO C1, C2            2011-346T22:45:00      2011-360T11:59:00
   da016      LAMO C3, C4            2011-358T22:00:00      2012-009T11:29:00
   da017      LAMO C5, C6            2012-008T02:03:00      2012-023T14:39:00*
   da018      LAMO C7, C8            2012-021T11:50:00      2012-037T13:34:00
   da019      LAMO C9, C10           2012-035T06:30:00      2012-051T12:44:00
   da020      LAMO C11, C12          2012-049T22:59:00      2012-065T12:44:00*
   da021      LAMO C13, C14          2012-063T21:27:00      2012-079T11:29:00
   da022      LAMO C15, C16          2012-077T20:20:00      2012-093T11:29:00
   da023      LAMO C17, C18          2012-091T06:54:00      2012-107T12:29:30
   da024      LAMO C19, C20          2012-105T10:15:00      2012-121T21:59:59
   da025      Transfer to HAMO-2     2012-119T09:22:30      2012-144T11:50:00
   da026      Transfer to HAMO-2     2012-144T11:55:00      2012-167T13:23:00
   da027      Transfer to HAMO-2     2012-167T10:35:00      2012-175T23:25:00
   da028      HAMO-2 C1, C2          2012-176T01:30:00      2012-186T05:45:00
   da029      HAMO-2 C3, C4          2012-186T07:55:00      2012-196T15:29:00
   da030      HAMO-2 C5, C6          2012-196T15:31:00      2012-207T15:08:00
   da031      Departure              2012-207T15:19:00      2012-230T06:53:00*
   da032      Departure RC4          2012-230T19:05:00      2012-254T21:49:00
   ===========================================================================
Table 10�1. Vesta Background Sequence Load Bundaries.
The background sequence load boundaries are listed in Table 10-2. Start dates annotated with * indicate that the sequence started late following a spacecraft anomaly (see Table 10-8). The ISB planning ends with C4. The prime mission ends with C9.
   ===========================================================================
   SEQ ID     Phase                           ISB Start Date      ISB End Date
   da220      Approach OpNav 1-2              2014-361T02:46:00      2015-026T17:29:00
   da221      Approach OpNav 3-4, RC1, RC2    2015-026T17:35:00      2015-057T08:28:00
   da222      Approach OpNav 5, FC1 chk       2015-057T08:35:00      2015-084T05:30:38
   da203      Approach OpNav 6-7              2015-084T07:05:00      2015-113T23:58:00
   da300      RC3                             2015-115T02:00:00*     2015-129T09:59:00
   da400      Transfer to Survey, OpNav 8-9   2015-129T10:05:00      2015-155T11:58:00
   da500      Survey C1, C2                   2015-156T12:00:00      2015-162T17:14:00
   da501      Survey C3, C4                   2015-162T18:50:00      2015-168T22:59:00
   da502      Survey C5, C6                   2015-169T00:50:00      2015-175T03:49:00
   da503      Survey C7, C8                   2015-175T05:35:00      2015-181T23:24:00
   da600      Transfer to HAMO                2015-195T21:05:00*     2015-219T10:59:00
   da601      Transfer to HAMO                2015-219T11:05:00      2015-228T23:58:00
   da700      HAMO C1                         2015-229T19:55:00      2015-241T02:59:00
   da701      HAMO C2                         2015-241T04:55:00      2015-252T01:59:00
   da702      HAMO C3                         2015-252T04:00:00      2015-263T02:59:00
   da703      HAMO C4                         2015-263T03:05:00      2015-274T03:55:00
   da704      HAMO C5                         2015-274T04:05:00      2015-285T05:25:00
   da705      HAMO C6                         2015-285T05:35:00      2015-296T20:25:00
   da800      Transfer to LAMO                2015-296T20:35:00      2015-324T08:39:00
   da801      Transfer to LAMO                2015-324T08:45:00      2015-350T00:55:00
   da900      LAMO C1                         2015-352T17:05:00      2016-010T14:59:00
   da901      LAMO C2                         2016-010T15:05:00      2016-033T14:00:00
   da902      LAMO C3                         2016-033T15:05:00      2016-056T14:59:00
   da903      LAMO C4                         2016-056T15:00:00      2016-079T16:00:00
   ===========================================================================
Table 10�2. Ceres Background Sequence Load Boundaries.
The following tables list the MCRs submitted against each version of the Dawn Science Plan.
   ===========================================================================
   MCR         Title                                                                  Request Date    Phase               Comments
   110064      Additional VIR cubes and FC images on Approach                         2010-02-23      Approach            Implemented 7/20-21/2010
   110161      Update the Vesta Approach SciTOL and corresponding
               science system level sequences to remove
               unnecessary FC2 CCD heater off commands                                2010-03-18      Approach            Implemented
   111845      Add VIR shutter test activities to the OpNav_007 window in da002       2011-05-18      Approach            Withdrawn based on risk to shutter.
   111873      Add VIR shutter test activities to OpNav windows in da003              2011-05-25      Approach            Implemented on 2011-202 (07/21/11)
   111915      Add VIR data acquisitions using only the Mass
               Memory mode in the OpNav_007 window in da002                           2011-06-01      Approach            Implemented on 2011-165 (06/14/11)
   111975      Add 10 minutes to OPNAV 18 duration                                    2011-06-15      Approach            Implemented
   112016      Patch FC2 UDP Library to stop excessive warning events                 2011-06-22      Approach            Implemented (6/28/2011)
   112040      Update Science VR Allocations for start of Vesta Orbital Operations    2011-06-24      Approach            Implemented
   112075      Remove VIR activities from Approach observations
               RC_002 and OpNav_018 and move the VIR Shutter
               Test from OpNav_014 to the Comm_003 pass                               2011-07-02      Approach            Implemented by 2011-202 (07/21/11)
   112076      Remove OPNAV 14 and the standalone playback on DOY 192 from da003      2011-07-04      Approach            Implemented
   111565      One extra orbit to Vesta Survey                                        2011-03-14      Survey              Implemented
   112211      Delay Transfer to HAMO by 24 hours exactly                             2011-08-02      Survey              Implemented
   112435      Add 3 VIR HAMO Dry-Run activities to da009                             2011-09-15      Transfer to HAMO    Implemented 2011-262
   111508      Add playback-only orbits to HAMO to mitigate occultation losses        2011-02-25      HAMO-1              Implemented Oct 5, 2011
   112417      Delay HAMO to LAMO transfer begin by one day                           2011-09-13      HAMO-1              Implemented
   112706      Remove OPNAV 2, 3 and bonus science from the da013
               and da014 sequences.                                                   2011-10-31      Transfer to LAMO    Implemented
   111615      Add 6 days to the LAMO sub-phase                                       2011-03-28      LAMO                Implemented
   112621      Update Science VR Allocations for LAMO                                 2011-10-13      LAMO                Superseded by MCR-112694
   112694      Update Instrument Housekeeping VR Allocations for LAMO (da013)         2011-10-26      LAMO                Implemented on 2011-325 (11/20/11)
   No MCR      Whiffen presentation Higher (Safer) LAMO � change from 465
               km to 475 km and beta from average 45° to 46°.                         2011-10-31      LAMO                Implemented
   112743      Remove OPNAV 8 from da014                                              2011-11-03      Transfer to LAMO    Implemented
   112752      Configure DSN 70-m stations to collect dual
               polarization signals to support a bistatic radar experiment in LAMO    2011-11-07      LAMO                Implemented
   113400      Convert da023 and da024 to LAMO sequences -extend LAMO                 2012-03-06      LAMO                Implemented
   113243      Re-order playback priority to swap VR8 and VR4 for HAMO-2              2012-02-03      HAMO-2              Implemented 6/11/2012
   113596      Add VIR observations to the HAMO-2 science
               phase prior to the start of the topography cycles (C0)                 2012-04-10      HAMO-2              Implemented
   113597      Add two additional cycles of topography and VIR observations
               to HAMO-2 (6-Cycle HAMO-2)                                             2012-04-10      HAMO-2              Implemented
   113671      Add a FC1 Non-Pointed Checkout to da026                                2012-04-25      HAMO-2              Implemented
   113751      Update VR Allocations for HAMO-2 (da026)                               2012-05-12      HAMO-2              Implemented
   113837      Add RC5 observations and forced coast window following
               escape from Vesta                                                      2012-05-30      Departure           Withdrawn after RWA3 fault
   113838      Add RC6 observations and forced coast window following
               escape from Vesta                                                      2012-05-30      Departure           Withdrawn after RWA3 fault
   113839      Add a FC2 Single-Station Jupiter calibration to the
               RC4 forced coast window                                                2012-05-30      Departure           Withdrawn after RWA3 fault
   113841      Add Vesta High Phase observations to departure                         2012-05-30      Departure           Withdrawn after RWA3 fault
   114178      Restructure Vesta Departure - specifically the da032 sequence          2012-08-11      Departure           Implemented
   ===========================================================================
Table 10�3. Vesta Mission Change Requests
   ===========================================================================
   MCR         Title                                                                  Request Date      Phase                  Comments
   116020      Add a sixth cycle to Ceres HAMO                                        2014-04-14        HAMO                   Implemented in HAMO ISB
   116163      Add VIR dark-side limb      observations to Ceres RC3 Mission Phase    2014-05-30        RC3                    Implemented in C3 ISB update
   116576      Add a FC2 stray      light and absolute calibration to the
               FT2/3 Thruster Cal in dc078 (October 2014)                             2014-10-01        Cruise                 Implemented in dc078
   116736      Move OpNav 8 from Approach      phase to Transfer to Survey phase      2014-11-13        Transfer to Survey     Implemented
   116791      Add forced coast time to      Ceres Approach timeline to
               power on instruments once at Ceres attitude                            2014-12-02        Approach               Implemented for da221 through da224
   116793      Add a F8 long exposure image following each normally exposed
               F8 image in RC2 to test image de-smear algorithm                       2014-12-04        Approach               Implemented
   117135      Add an eighth orbit to Ceres Survey                                    2015-04-02        Survey                 Implemented
   117394      Add equatorial clear images with "spot" exposures
               to Ceres HAMO Cycles 2,3, and 4                                        2015-06-15        HAMO                   Implemented
   117418      Add 3 additional dark-side playback passes to the
               Ceres HAMO mission phase and reorder C2, C3, and C4 (da700-da705)      2015-06-22        HAMO                   Implemented
   117440      Add 2 additional dark-side playback passes to the Ceres HAMO C1
               and 1 additional dark-side playback pass to C5 (da700, da704)          2015-06-30        HAMO                   Implemented
   117496      Add 1 additional dark-side playback pass to Ceres HAMO C5 (da704)      2015-07-15        HAMO                   Implemented
   117804      Update VR Allocations for Ceres LAMO during da801 to
               increase size of VR8                                                   2015-10-16        LAMO                   Implemented
   ===========================================================================
Table 10�4. Ceres Mission Change Requests
The following tables list the ISA Reports associated with instrument or science operations during each phase of the mission.
   ===========================================================================
   ISA                   Date               Title                                                Sequence
   Initial Checkout
   Z91700                Oct 16, 2007       GRaND SCLK regression in playback packets            dc003
   Z91701                Oct 16, 2007       GRaND telemetry channel mis-defined                  dc003
   Z91705                Oct 18, 2007       VIR false CoolFail error (idiosyncrasy)              dc003
   Z91706                June 17, 2007      VIR induced noise in trickle charge telemetry        dc003
   Z91928                June 28, 2007      VR10 routing for OpNav not enabled on S/C            dc009
   Z91962                June 30, 2007      FC streaks from dust observed in images              dc003
   Z91968                June 30, 2007      FC interference signals at 5 Hz &
                                            45/50/55 Hz in data                                  dc010
   Earth-Mars Cruise
   Z92234                Aug 13, 2011       Pause Resume of continuous playback                  dc013
   Z92425                Aug 22, 2011       FC2 Mechanism Failed flag set by FSW load            dc014
   Z92436                Aug 29, 2011       VIR reduced calibration reduced                      dc014
   Mars Gravity Assist
   Z94274                Feb 9, 2009        S/C Safe Mode: MGA Star Tracker occultation          dc023
   Z93645                Mar 24, 2009       VIR fault protection power off w/ cover moving       dc023
   Z93652                Mar 27, 2009       GRaND unexpected transition to Standby               dc024
   Mars-Vesta Cruise
   Z94116                Nov 12, 2009       FC LLSW 3.03 and UDP 3.03.02 problems                dc034
   Z94155                Aug 15, 2009       VIR dump FR violation not caught in review           VST
   Z94161                Oct 12, 2011       VIR shutter remained closed during geometric calib   dc034
   Z94240                Feb 21, 2012       VIR Dump Stalled                                     dc036
   Z94462                Feb 23,2012        FC UDP Library Bug                                   dc041
   Z94561                Mar 9, 2012        Commanding error resulted in VR3 playback loss       dc041
   Z94594                Apr 2, 2012        FC error logs - VSH                                  ISB
   Z94609                Aug 8, 2012        GRaND CZT9 malfunctioned following anneal demo       dc041
   47426                 Jan 6, 2011        VIR Frames dropped in 6Gb Calibration - VSL          ISB
   ===========================================================================
Table 10�5. Cruise Phase ISAs.
   ===========================================================================
         ISA              Date              Title                                                 Sequence
   Approach
         48673            May 3, 2011       FC2 lossless compression is lossy in OpNav 1          da001
         48726            May 10, 2011      VIR data not played back from OpNav 2                 da001
         48766            May 10, 2011      VIR stuck shutter in 7th cube of OpNav 2   da001
         49161            June 17, 2011     FC2 excessive warning events after OpNav 83           da002
         49280            June 28, 2011     S/C Safe_comm: DCIU single event upset                da002
         49300            June 30, 2011     VIR RC1 reset from single event upset                 da003
         49308            June 30, 2011     FC2 UDP patch for excessive events failed             da003
         49334            July 4, 2011      GRaND CZT9 sensor noise                               da003
         49374            July 11, 2011     FC2 Satellite Search image corruption                 da003
         49462            July 11, 2011     FC2 Satellite Search image sorting                    da003
         49421            July 15, 2011     VIR Partial dumps drop science packets                da004
         49461            July 21, 2011     VIR Data order dependence (direct-to-VR)              da004
   Survey
         49728            Aug 13, 2011
                          Aug 17, 2011      VIR resets in Survey C1 and C3 when using             da006
                                            direct-to-VR mode resulting in data loss              da007
         49818            Aug 22, 2011      FC2 Survey C4 images corrupted                        da007
         49890            Aug 29, 2011      VIR Survey C4 missing science packets                 da007
         49996            Sept 9, 2011      VIR Survey C7 missing 1/3 data frames                 da008
   Transfer to HAMO-1
         50181            Sept 21, 2011     S/C Safe Mode: OBC Reset from VR Re-size              da009
         50221            Sept 27, 2011     GRaND BGO anomalous noise #1                          da009
   HAMO-1
         50271            Oct 4, 2011       FC2 file limit exceeded in HAMO C1                    da010
         50284            Oct 5, 2011       HAMO C2 sequences not uploaded (lost orbit 1)         da010
         50325            Oct 12, 2011      FC2 images going to wrong VR in HAMO C3               da011
   Transfer to LAMO
         50723            Dec 4, 2011       S/C Safe Mode: High turn rate during OMM              da014
   LAMO
         50813            Dec 13, 2011      FC2 reset #1 in LAMO C1                               da015
         51010            Jan 14, 2012      S/C Safe Mode: OBC Reset from Cheby select            da017
         51051            Jan 19, 2012      GRaND telemetry stopped by MUC error                  da017
         51171            Feb 3, 2012       FC2 reset #2 in LAMO C8                               da018
         51363            Feb 21, 2012      S/C Safe Mode: OBC reset from NIPC/Cheby              da020
         51377            Feb 23, 2012      GRaND BGO anomalous noise #2                          da020
         51511            Mar 9, 2012       FC2 reset #3 in LAMO C13                              da021
         51700            Apr 2, 2012       FC2 loss of thermal control in LAMO C17               da023
         51947            May 1, 2012       VR4 & VR8 left paused during playback pass            da025
                                            Departure
         52749            July 30, 2012     GRaND science data overwritten in VR                  da031
         52834            Aug 8, 2012       S/C Safe Mode: RWA3 failure                           da031
   ===========================================================================
Table <10�6. Vesta Phase ISAs.
   ===========================================================================
   ISA          Date               Title                                               Sequence
   Vesta-Ceres
   Cruise
   55396        Nov 15, 2013      S3 CRC error during GRaND Power On/HVPS              dc065
   56567        Jun 23, 2014      S3 CRC error during GRaND Power On/HVPS              dc072
   Approach
   57745        Feb 10, 2015      FC2 streaks from dust observed in images             da221
   58038        Apr 7, 2015       GRaND housekeeping packets are out of order          da223
   RC3
   58135        Apr 27, 2015      S/C Safe Mode: Cheby file not loaded in time         da300
   58153        Apr 27, 2015      GRaND S3 CRC error detected at power on              da300
   58273        Apr 27, 2015      FC image bias incorrectly reported by new FSW        da300
   Transfer to
   Survey
   58350        Jun 8, 2015       VIR cryocooler shows signs of aging in OpNav 9       da400
   Survey
   58350        Jun 15, 2015      VIR reset in Survey C4 losing all science data       da501
   58425        Jun 28, 2015      FC2 loss of thermal control & power off in C8        da503
   58426        Jun 28, 2015      VIR reset in Survey C8 losing all science data       da503
   Transfer to
   HAMO
   58471        July 1, 2015      S/C Safe Mode: FT3 gimbal failure                    da600
   58589        July 27, 2015     GRaND S3 CRC error & corrupted SOH packet            da600
   HAMO
   58761        Sep 7, 2015       FC2 warm reboot in HAMO C2                           da701
   58793        Sep 14, 2015      FC2 loss of thermal control & power off in C3        da702
   LAMO
   59171        Dec 22, 2015      FC2 warm reboot in LAMO C1 loss of 14 images         da900


   ===========================================================================
Table 10�7. Ceres Phase ISAs.
The Dawn spacecraft has two forms of safe modes: safe_comm discontinues sequenced spacecraft operations and orients the spacecraft for HGA communications with the DSN and safe_mode also discontinues sequenced operations, but takes additional measures and orients the spacecraft using the sun sensors and provides only low-rate communications through the LGAs. Table 10-8 lists all of the unplanned Dawn safe_mode and safe_comm entries.
   ===========================================================================
         Date                  Type            Cause                                                               Phase                        ISA
   Launch through Cruise to Vesta
         2007-11-28            safe_mode       OBC reset � unknown cause (2007-332T05:50)                          Initial Check Out            44429
         2008-01-15            safe_mode       ACE Single event upset (2008-015T05:54:15)                          Earth-Mars Cruise            44446
         2008-04-08            safe_comm
                               safe_mode       IPS DCIU software (2008-099T16:02:45)
                                               Erroneous command sent(2008-099T16:35:46)                           Earth-Mars Cruise            44475
         2009-02-16            safe_mode       Sticky bit for star tracker occultation (2009-049T00:41:59)         Mars Gravity Assist (dc023)  44569
         2011-04-13            safe_comm       Incorrect jet pulse period during auto momentum adjust (2011-103)   Mars-Vesta Cruise            48513
   Vesta      Mission
         2011-06-27            safe_comm       IPS DCIU Single event upset (2011-178T09:02)                        Vesta Approach (da002)       49280,
                                                                                                                                                49342
         2011-09-21            safe_mode       Inadequate time for VR Re-size (2011-265T05:01:01.896)              Vesta Transfer (da009)       50181
         2011-12-04            safe_mode       High turn rate during thrusting (2011-338T04:58)                    Vesta Transfer (da014)       50723
         2012-01-14            safe_mode       Two Chebys loaded to same slot (2012-014T06:49:36)                  Vesta LAMO (da017)           51010
         2012-02-21            safe_mode       Command sent during Cheby load (2012-053T03:13:30)                  Vesta LAMO (da020)           51363
         2012-08-08            safe_comm       RWA3 failure (2012-222T01:45)                                       Vesta Departure (da031)      52840
   Vesta-Ceres      Cruise
         2014-09-11            safe_comm
                               safe_mode       IPS DCIU Single event upset (2014-254T10:41:10)
                                               Attitude reference lost (2014-254T16:33:56)
                                                                                                                   Vesta-Ceres Cruise (dc075)   57018
   Ceres      Mission
         2015-04-27            safe_mode       Cheby file not loaded in time                                       Ceres RC3 (da300)            58135
         2015-07-01            safe_mode       FT3 gimbal failure                                                  Ceres Transfer to
                                                                                                                   HAMO (da600)                 58471


   ===========================================================================
Table 10�8. Spacecraft Safe_mode and Safe_comm Entries.