Dawn Gamma Ray and Neutron Detector DC041 Activity Report
NASA Dawn Mission document, Version 1.0, 20-Sep-2010
Thomas H. Prettyman and Karly M. Pitman
Planetary Science Institute
Activities Completed
Name       Description                    RSOE file(s) [1]
----       -----------                    ----------------
DC003      Initial Checkout [2,4]         dc003a.03.rsoe.pdf
DC014      Earth-Mars Cruise [2,4]        dc014b_payload.02.rsoe.pdf
DC022      Earth-Mars Cruise [3,4]        dc022a.00.rsoe.pdf
DC023      Mars Gravity Assist [3,4]      dc023b.00.rsoe.pdf
                                          dc023c.00.rsoe.pdf (safe mode recovery)
DC024      Mars-Vesta Cruise [4]          dc024a.01.rsoe.pdf
DC034      Mars-Vesta Cruise              dc034b.00.rsoe.pdf
DC041      Mars-Vesta Cruise              dc041b.00.rsoe.pdf
Summary
GRaND was operated during DC041 (Mars-Vesta Cruise) from 19-Jul-2010 to 25-Jul-2010. The primary objective of the activity was to demonstrate GRaND's anneal mode for the first time in flight, validating the anneal command sequences and providing thermal characterization data prior to a long anneal, currently planned for DC048 on approach to Vesta. In addition, GRaND's compatibility with Flight Software (FSW) 9 was assessed and a formal check list for GRaND sequence product review was implemented. Software to read and merge spacecraft engineering data for external temperature sensors and current monitors with GRaND state-of-health (SOH) data was developed.
Conditions, issues, and events:
* As in all previous activities, science data were fortuitously acquired
under quiet Sun conditions;
* Based on monitoring SOH data from DMDs and analysis of play back data,
GRaND functioned nominally;
* A review of the SOH telemetry indicates that GRaND is compatible with FSW
9;
* Playback of post-anneal science and SOH data were delayed due to a DSN
outage; the full GRaND data set for DC041 was delivered for processing
and evalution by the GRaND team on 24-Aug (note permanent gap in S/C
engineering data from 2010-07-25T06:00 to 2010-07-26T01:45 SCET);
* Anneal demonstration results:
o Power consumption with anneal heaters on was the same as in pre-
ship tests;
o CZT temperatures exceeded 60°C; however, the duration was
insufficient to observe regulation of heater power by the
thermostat;
o No adjustment in the thermal environment is needed for the long
anneal planned for DC048;
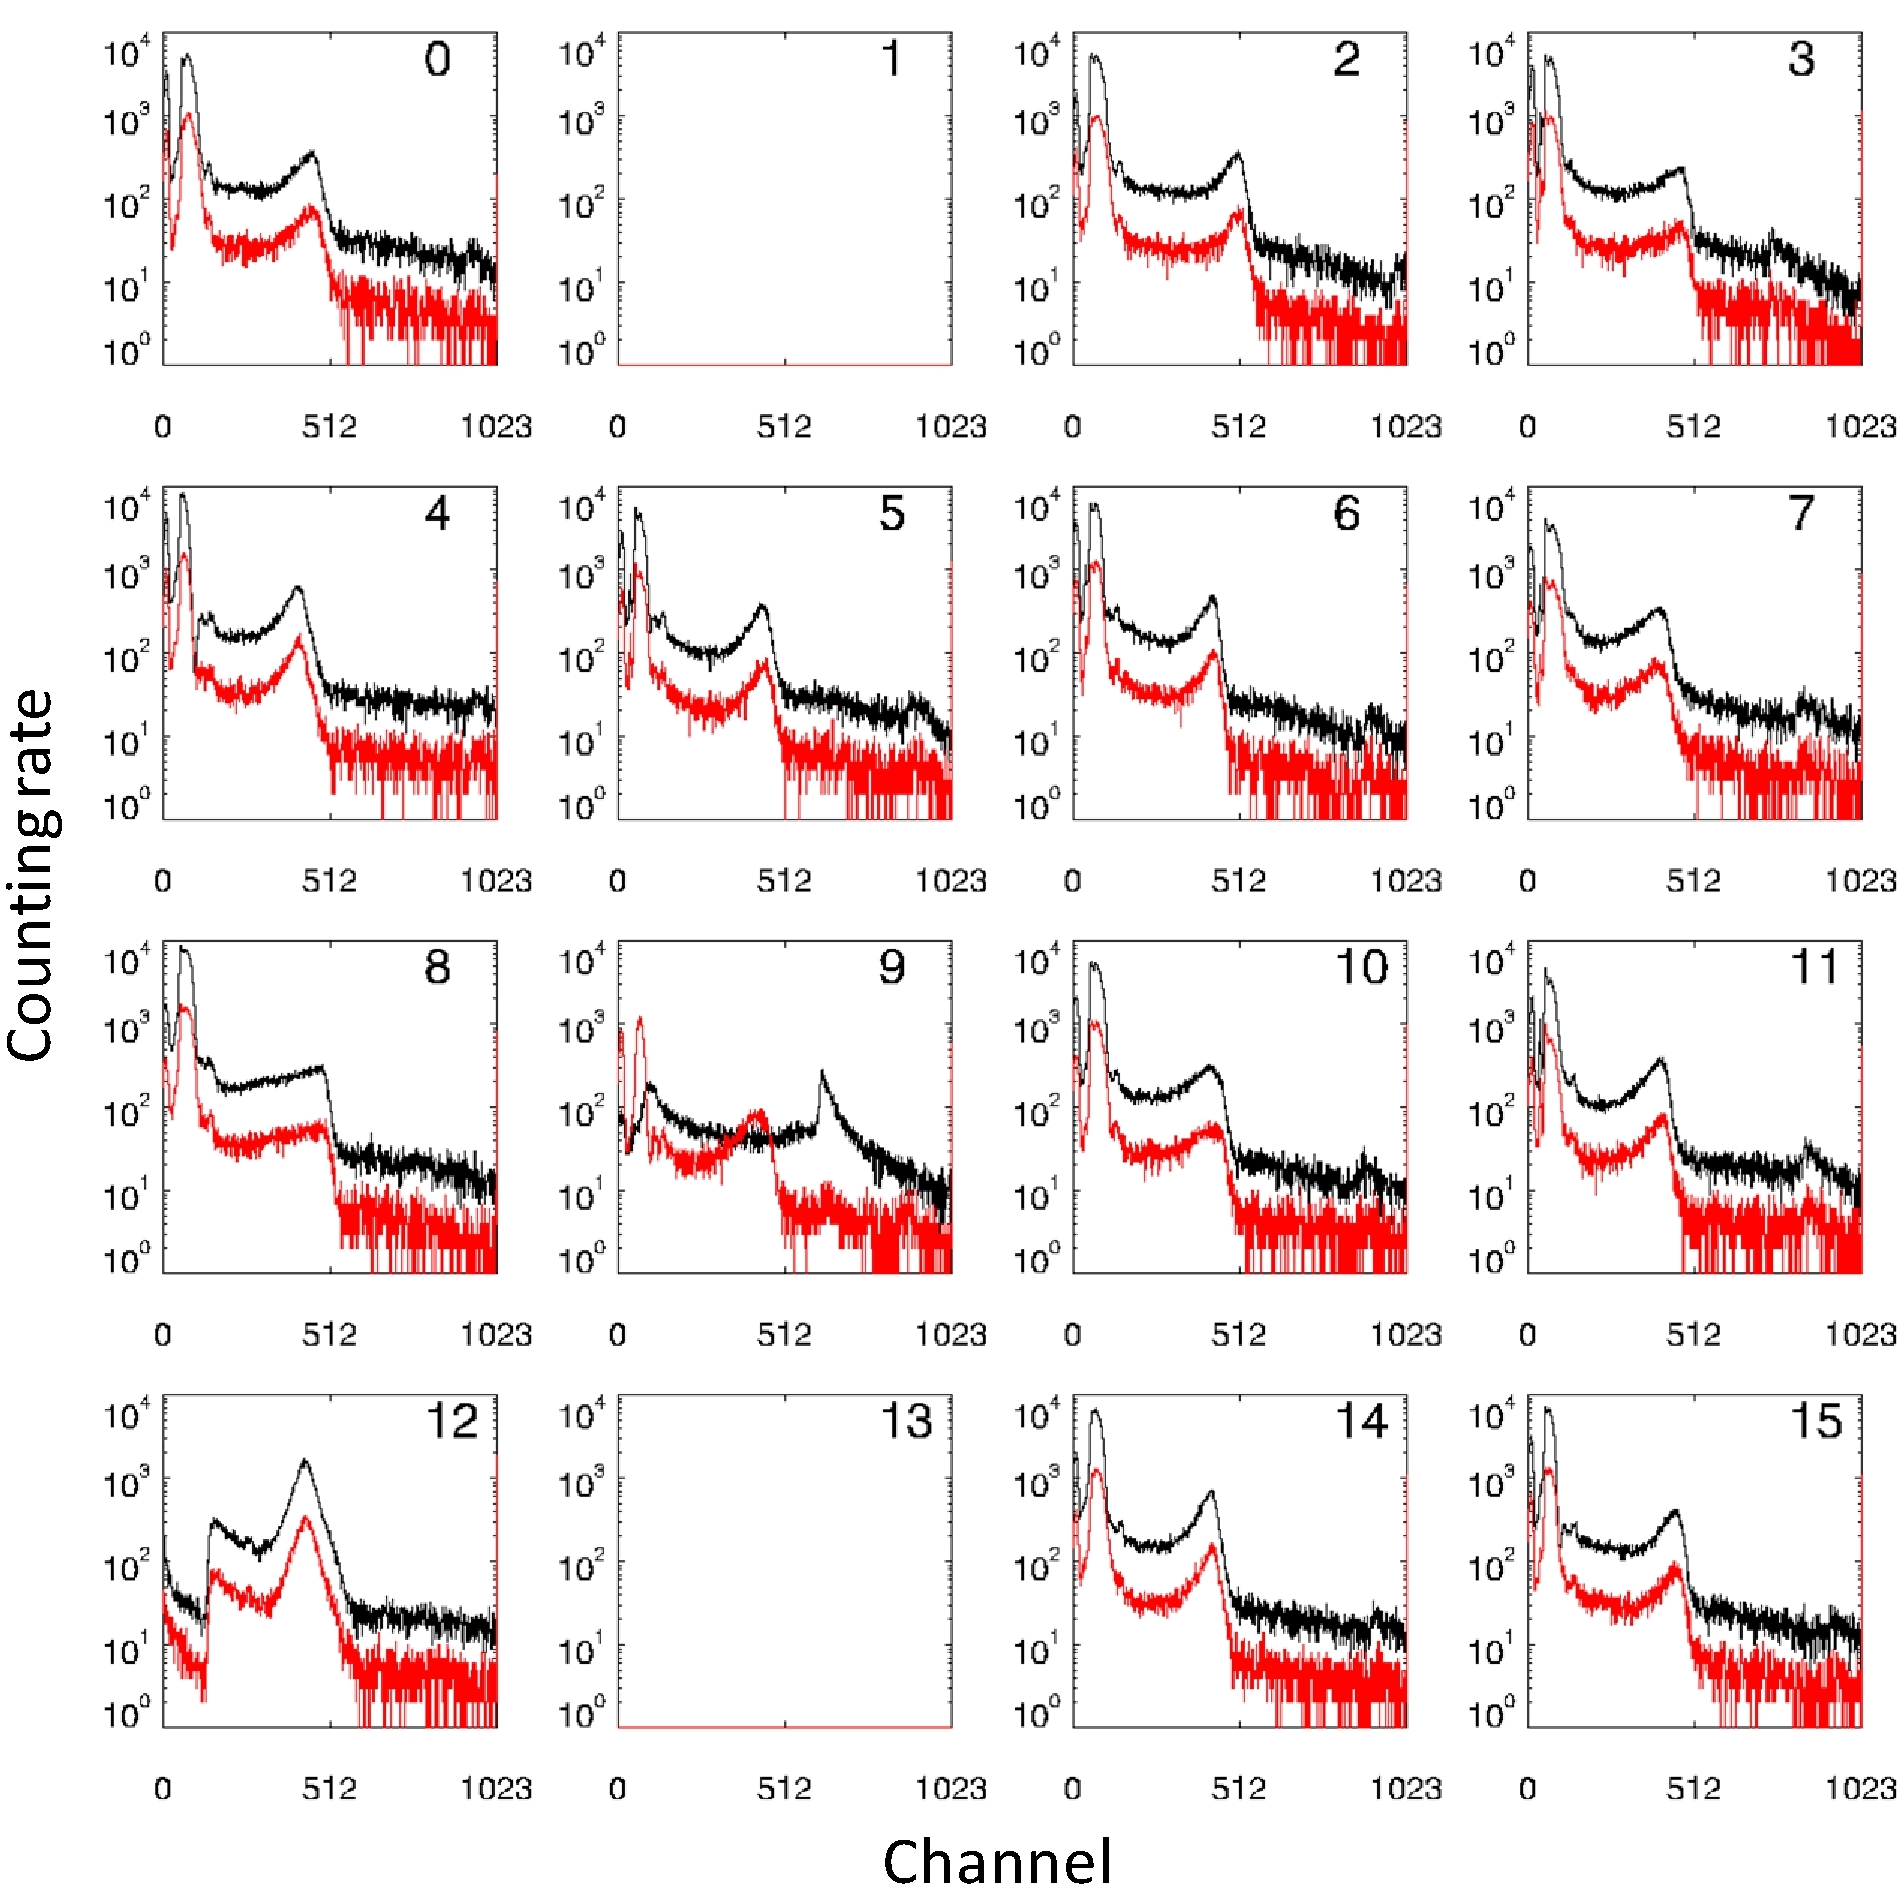
o A detailed analysis of the science data revealed that one of the CZT
sensors (CZT9) was malfunctioning following the anneal; all other
sensors were nominal;
Actions:
   *  The GRaND team is attempting to determine the root cause of the
      malfunction of CZT9

   *  The GRaND team requests that DMD temperature displays (for GRANDITAR) be
      adjusted to show the data on scale (-10°C to 70°C)
In this report, a simple thermal model of the GRaND CZT array is presented. Parameters of the model are determined from data acquired during thermal cycling of GRaND in vacuum (TVAC), where the anneal function was first tested. The TVAC- determined parameters are used to predict the range of temperatures during DC041’s 1.5h anneal. The DC041 data show that high temperatures can be achieved such that no further adjustment in the thermal environment is needed. The performance of GRaND before and after the test is compared.
Data
Level0 data were processed by the Level1a pipeline [4] and were delivered to the Dawn Science Center (DSC) for distribution to the project and science team. The data and instrument state sequence are summarized in Table 1.
Table 1. Level0 data summary. The number of science records (NSR) processed and the number of instances of SCLK regression (SCR) of science data packets is provided. The observed sequence of state changes (from the Level1a .STA file) is summarized.
  Level 0 PB   Science UTC           NSR/SCR   Instrument state sequence
  directory    Begin/End

  10235\       2010-07-19T18:41:55   2194/0    * Power on and high voltage rampup;
               2010-07-25T21:06:51               configure for data acquisition.
                                               * Acquire science data for 22.5h
                                                 (STATE=105)
                                               * High voltage ramp down and
                                                 STANDBY mode for 1h
                                               * Apply anneal heater power for
                                                 1.5h
                                               * Cool down for 17.5h in STANDBY
                                                 mode
                                               * Ramp up high voltages and
                                                 configure for science data
                                                 acquisition
                                               * Acquire science data for 101h
                                                 (STATE=216)
                                               * High voltage ramp-down and power
                                                 off
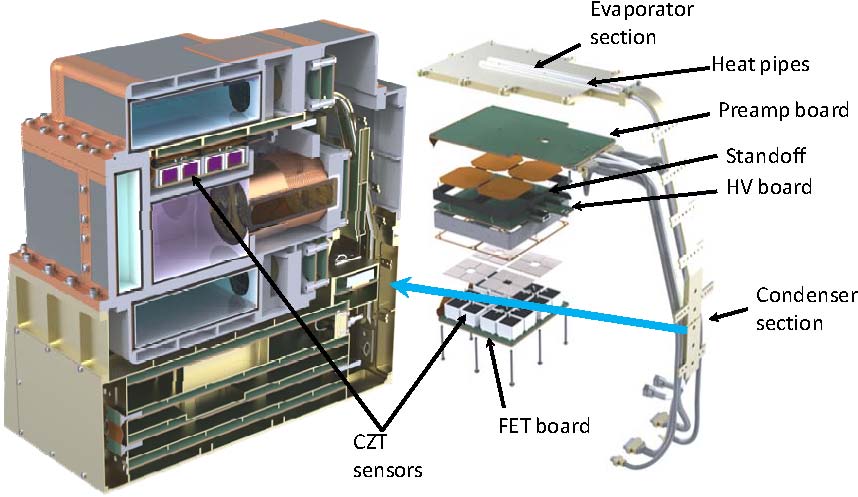
Figure 1. A cutaway view of GRaND shows the location of the CZT array and heat pipes (left). An assembly diagram of the CZT subsystem (right) shows components of the array. During science data acquisition, the bulk of the power is dissipated by the preamplifier board which is thermally coupled to the evaporator section of the dual, copper-methanol heat pipes. The heat pipes efficiently transfer heat to the condenser section which is coupled to GRaND’s aluminum chassis, keeping the CZT array cool (about 20°C during cruise). In order to anneal the array to high temperature, heater power (about 4W) is applied to the high voltage (HV) board on which the CZT sensors are mounted. The thermal path from the high voltage to the evaporator section is relatively long compared to the path from the preamplifier board, resulting in elevated temperatures (regulated by a thermostat between 47° and 61°C).
Annealing prior to flight
GRaND anneal heaters were operated twice in during thermal cycling in vacuum (TVAC) at LANL, providing information on the thermal time constant of the CZT array and maximum temperatures as a function of operating temperature. A brief description of the anneal function is given in Fig. 1. Prior to DC041, the data from TVAC were re-analyzed using a simplified, heat balance integral model, which gives the average temperature of the CZT sensors as a function of time:

where t is time (s), T0 = T(0) is the initial temperature (°C or K), TC is the temperature of the condenser section of the copper-methanol heat pipe (assumed constant), the saturation temperature difference ΔTS is a function of the applied heater power and thermal parameters, and τ is a characteristic time constant. T(t) is measured by the four AD590 temperature sensors on the high voltage board of the CZT array. The model is given in terms of "lumped" thermal parameters. The saturation (asymptotic) temperature difference is given by

where L is the thickness of the array assembly (m), A is the cross sectional area of the array (m2), P is the applied power (W), and k is the bulk thermal conductivity of the assembly (W m-1K-1). The parameter Β is given by

where Bi = hL/k is the Biot number, which depends on the effective heat transfer coefficient, h (W m-2K-1), of the heat pipes (assumed to be constant with temperature). The time constant is given by

where α is the thermal diffusivity, given by k/ρcp, where ρ is the density (kg m-3) and cp is the specific heat of the array materials (J kg-1K-1). By comparing Eqns. 2 and 4, we find that ΔTS and τ are related by

where C = P/(LA ρ cp. Assuming ρcp does not vary with temperature, C is a constant. Thus, the time variation of the array temperature given by Eq. 1 depends on two parameters, C and τ, which can be determined experimentally from data acquired in TVAC.
In TVAC, GRaND was thermally coupled to a base plate that was held at nearly constant temperature during anneal operations. Tests were carried out at low-and high-temperatures. The data from these tests are summarized in Fig. 2. Data from the high temperature test were used to determine τ, by fitting Eq. 1 to the data acquired while the heater power was off. C was determined given τ from data acquired while the anneal heater power was on. Using this approach, the values for C and τ were found to be 0.034 K/s and 1246 s (20.8 minutes), respectively, which gives a saturation temperature difference (Eq. 5) of 42K. The parameters determined from the high- temperature test were then used to predict the low temperature test data acquired with heater power on; however, the observed temperature change for the low-temperature test was much greater than 42K, which implies that heat transfer is less efficient at low operating temperatures. In order to fit the data, we adjusted τ to 1800s (30 minutes). The fitted functions are compared to the data in Fig. 3.
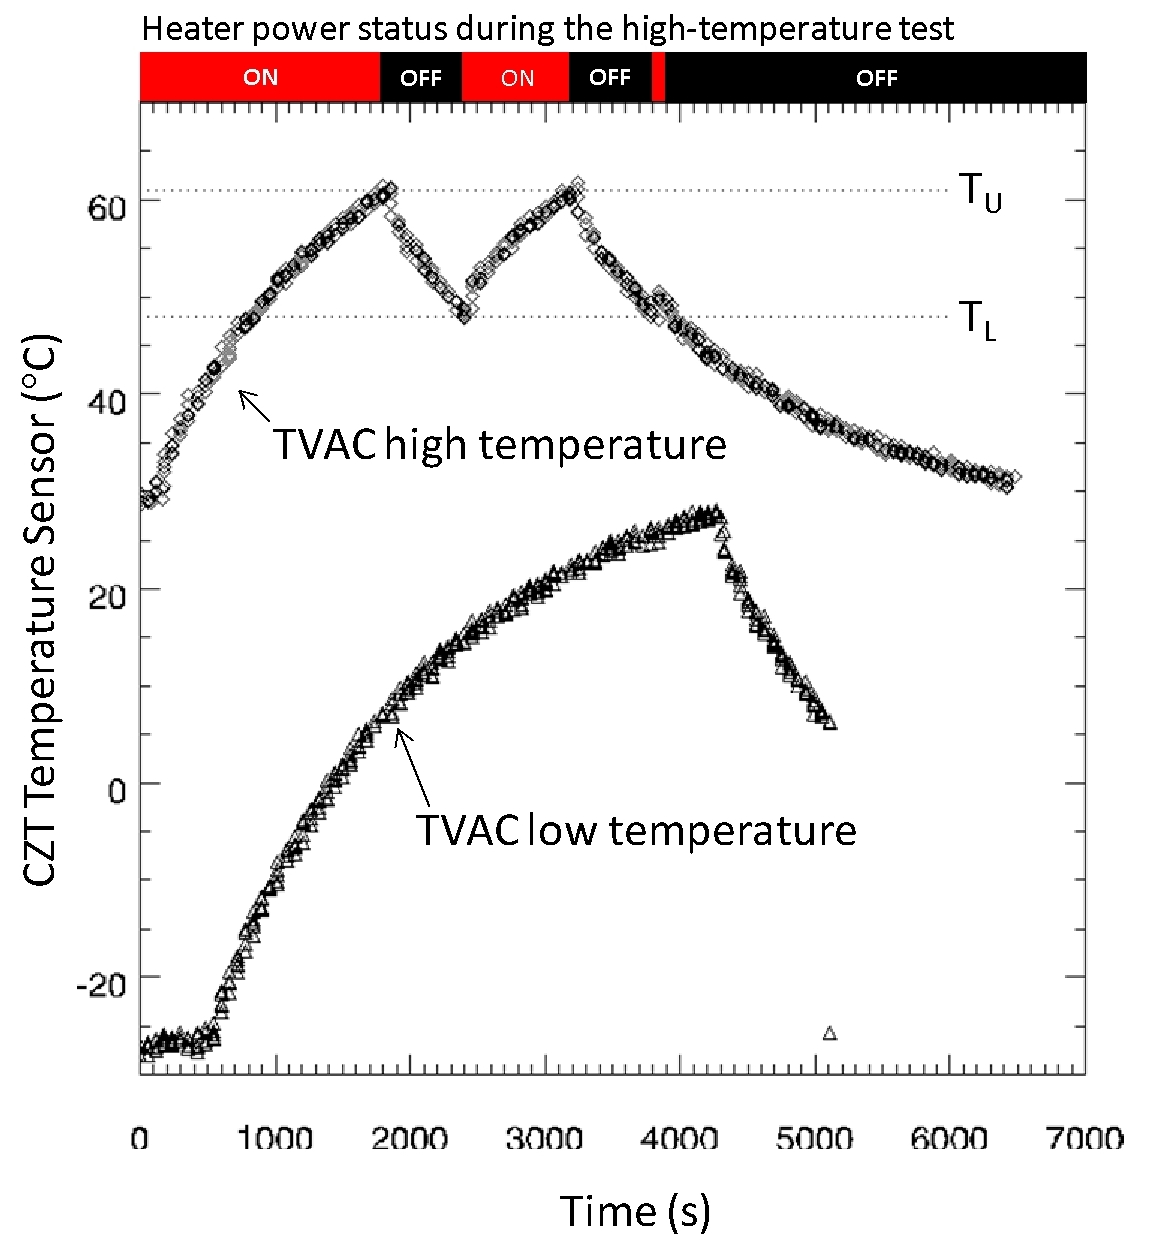
Figure 2. Data acquired during anneal tests carried out at low-and high- temperatures. Data from one of the CZT temperature sensors (CZT1) is shown. The dashed lines indicate the range over which the thermostat for heater power operates. If TU is exceeded, heater power is turned off. Power is restored when the temperature drops below TL. Note that at for the high temperature test, the thermal regulation circuit went through two complete cycles before the test was terminated.
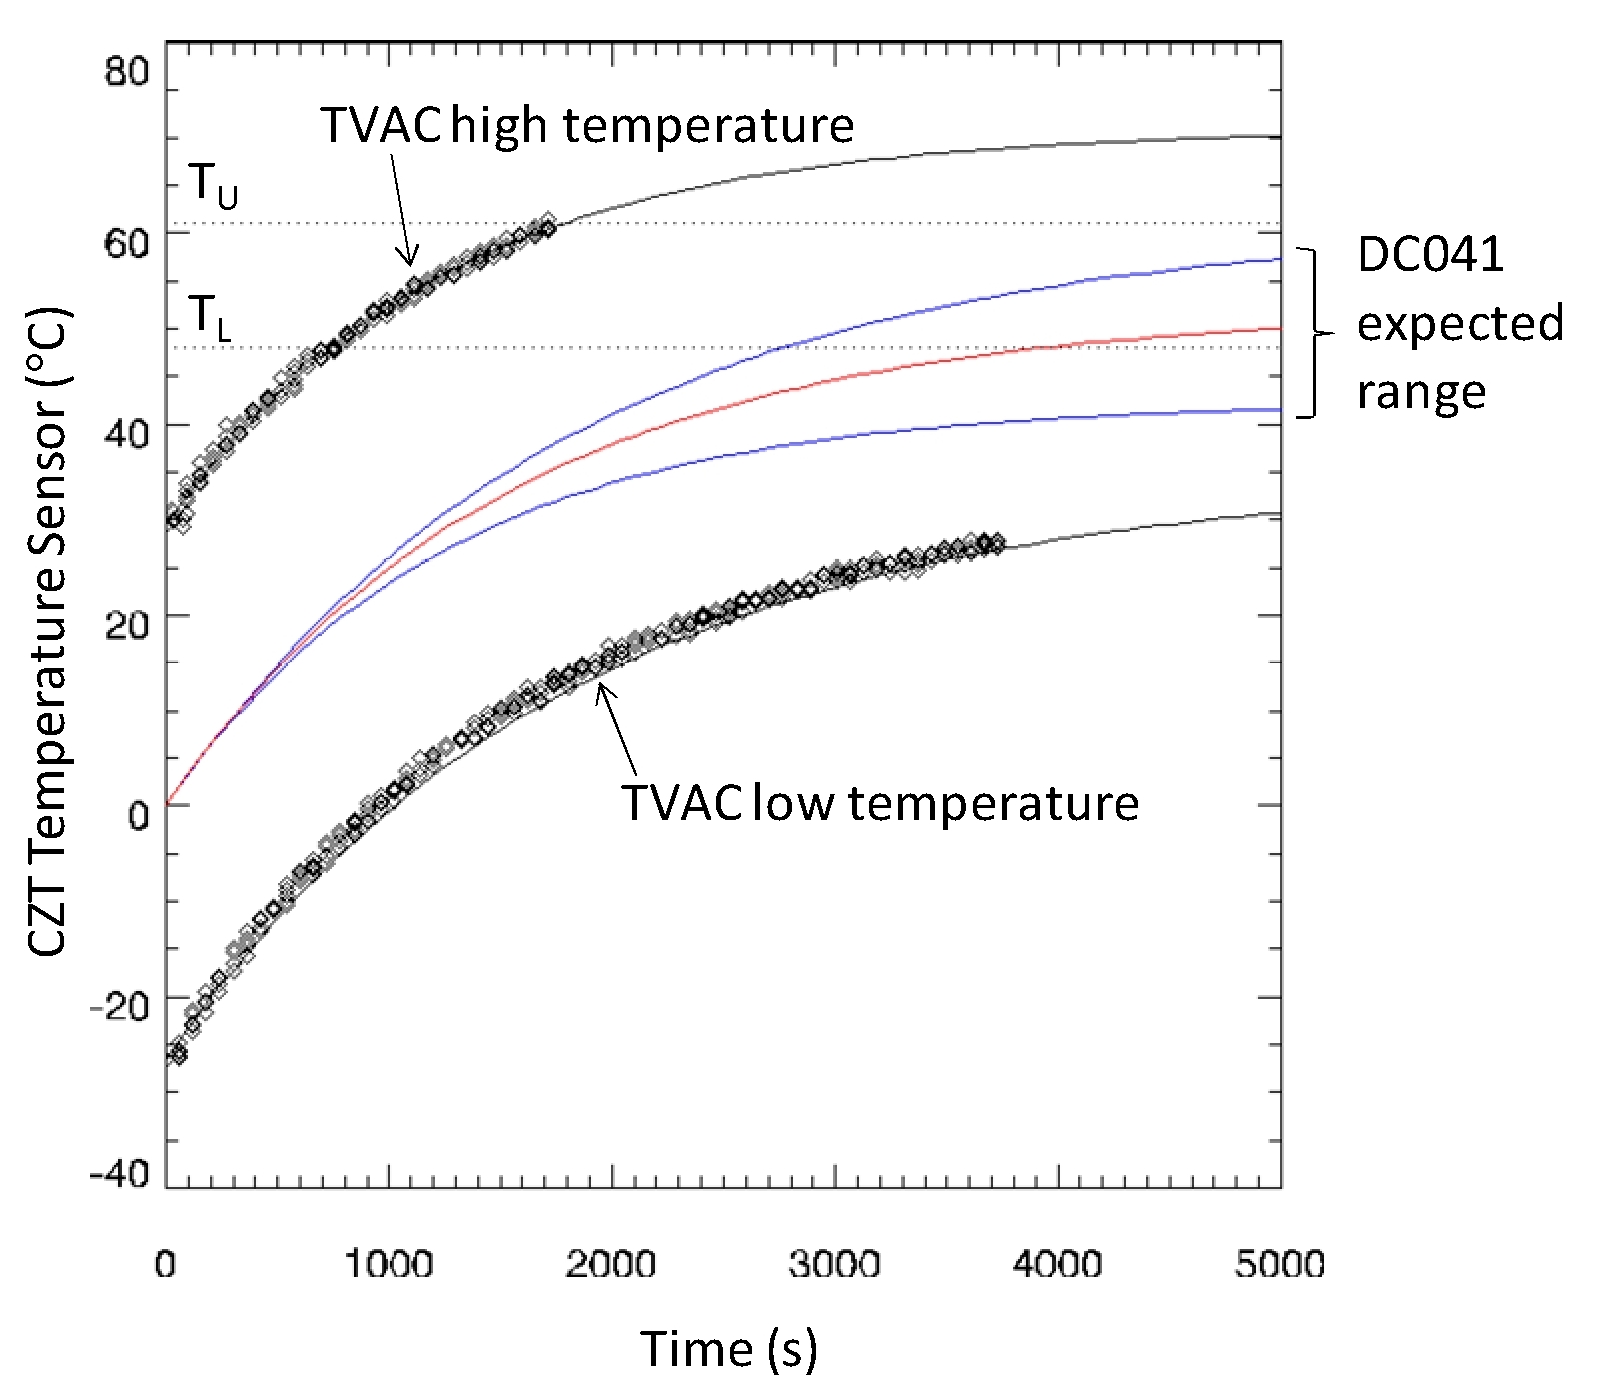
Figure 3. Model-predicted anneal temperatures are compared to values measured in TVAC for the CZT temperature sensors. The blue curves give the range of values expected in DC041. The TVAC data indicate that the heat pipes are more efficient at higher radiator temperatures.
Given the two values for τ determined from TVAC, we predicted the range of temperatures for DC041 (approximately 1.5h with heater power on), assuming the temperature of the condenser section was 0°C. The maximum value for the range is close to, but lower than, the temperature at which the heater circuit regulates (TU). Regulation is desired to guarantee a high average temperature to maximize the effectiveness of the anneal in removing radiation damage.
A Simplistic View of Annealing
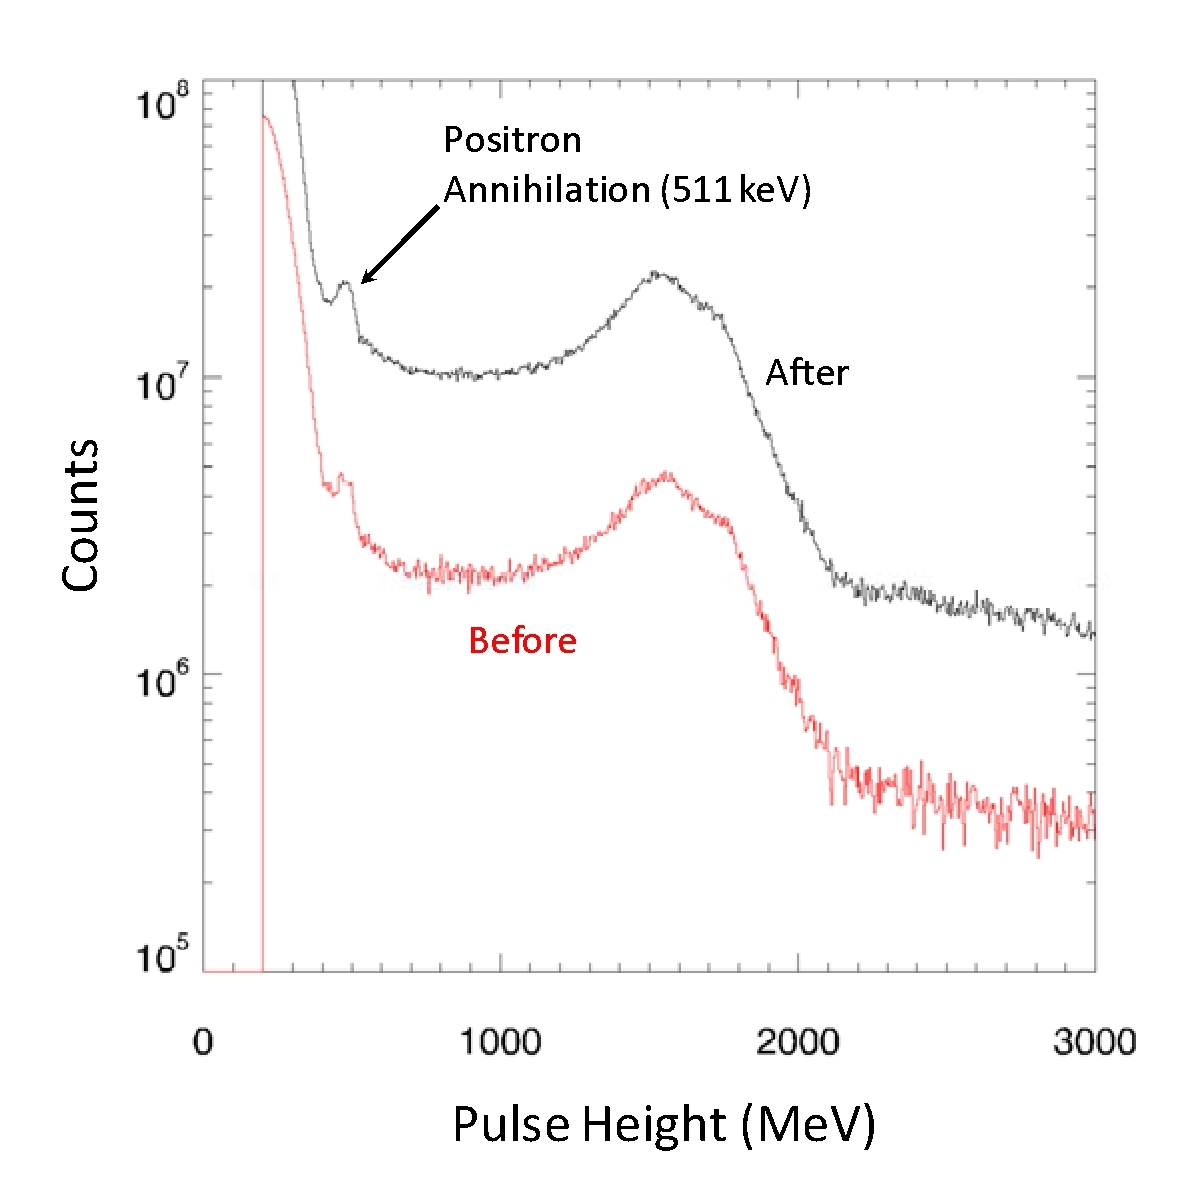
The resolution of the CZT sensors is controlled in part by the trapping length for electrons, which is given by the product of the electron’s mobility μ (about 1000 cm2/V-s) and lifetime τn (about 5 microseconds), and the strength of the applied electric field E (about 1000 V/cm). Radiation, such as in the form of galactic cosmic rays, can induce damage in the crystal, thus changing the crystal's electronic properties. For example, energetic protons can create defects in the crystal lattice, which introduce electron traps, resulting in a reduction in electron lifetime. Increased electron trapping results in reduced pulse amplitude, the addition of a low- energy tail below the peak, and a broadening of full energy peaks, which has been observed in cruise.
A test to see if the observed reduction in resolution is due to a change in μτnE, is simply to change the HV on the array. Increasing HV would improve resolution, which can be tested in future activities.
In practice, the damage can be removed (and resolution restored) by warming the crystal up, allowing thermal agitation to remove the damage. To first order, the process is controlled by an unknown activation energy, and the rate at which the damage is removed is given by an Arrhenius equation:

where A0 is a constant, independent of temperature, E is the activation energy (eV), k0 is Boltzmann's constant (8.61734E-05 eV/K), and T is temperature in Kelvin. Very approximately, the concentration of defects should decrease exponentially with time (in other words, the time rate of change in defects is proportional to the concentration of defects N ):

where N0 is the initial concentration of defects. Equations 6 and 7 suggest the following relationship for the ratio of the amount of time needed to recover the performance for a damaged crystal at two different temperatures:

Consequently, the difference in the amount of time is strongly controlled by the activation energy and anneal temperature. If the activation energy were 0.1 eV, for example, then it would take 1.4 times longer to restore the crystal to full resolution at 20°C than at 50°C.
The amount of time required to restore a CZT sensor to full resolution depends on temperature and the initial amount of damage ( N0). The observed level of damage is such that the 511 keV peak can still be seen in most of the spectra acquired by GRaND's CZT sensors. For low levels of damage, such as that observed, the anneal time is likely on the order of a few days (e.g., [5]).
Results of the DC041 Anneal Demonstration
Given the foregoing discussion on annealing, we desire maximum temperatures for the long duration anneal scheduled for DC048. For the thermal environment on Dawn, would the CZT array reach temperatures in excess of 60°C, enabling the thermostat to function? DC041 was intended to characterize the thermal response of GRaND to the anneal heaters and to validate anneal command sequences. The general plan (see Table 1) was to power on GRaND and acquire science and SOH data for a pre-test characterization. HVs were then ramped down and GRaND was set to mode STANDBY. After a short wait, GRaND was set to mode ANNEAL and heater power was applied to the CZT array for 1.5h after which GRaND was allowed to cool for 17h. The cooling period was followed by GRaND science data acquisition for post-anneal characterization.
External and internal temperatures were recorded in the S/C engineering telemetry and in GRaND's SOH data. These included data from AD590 temperature sensors mounted on the HV board of the CZT array and beneath the BGO crystal. The latter is buried deep within the GRaND scintillator assembly, which contains materials that have relatively low thermal conductivity. External thermocouples are shown in Fig. 4. Of particular interest is E-0421, which is located at the condenser section of the heat pipes. The difference between the internal CZT temperature and E-0421 provides a direct measurement of T(t)-TC>(Eq. 1).
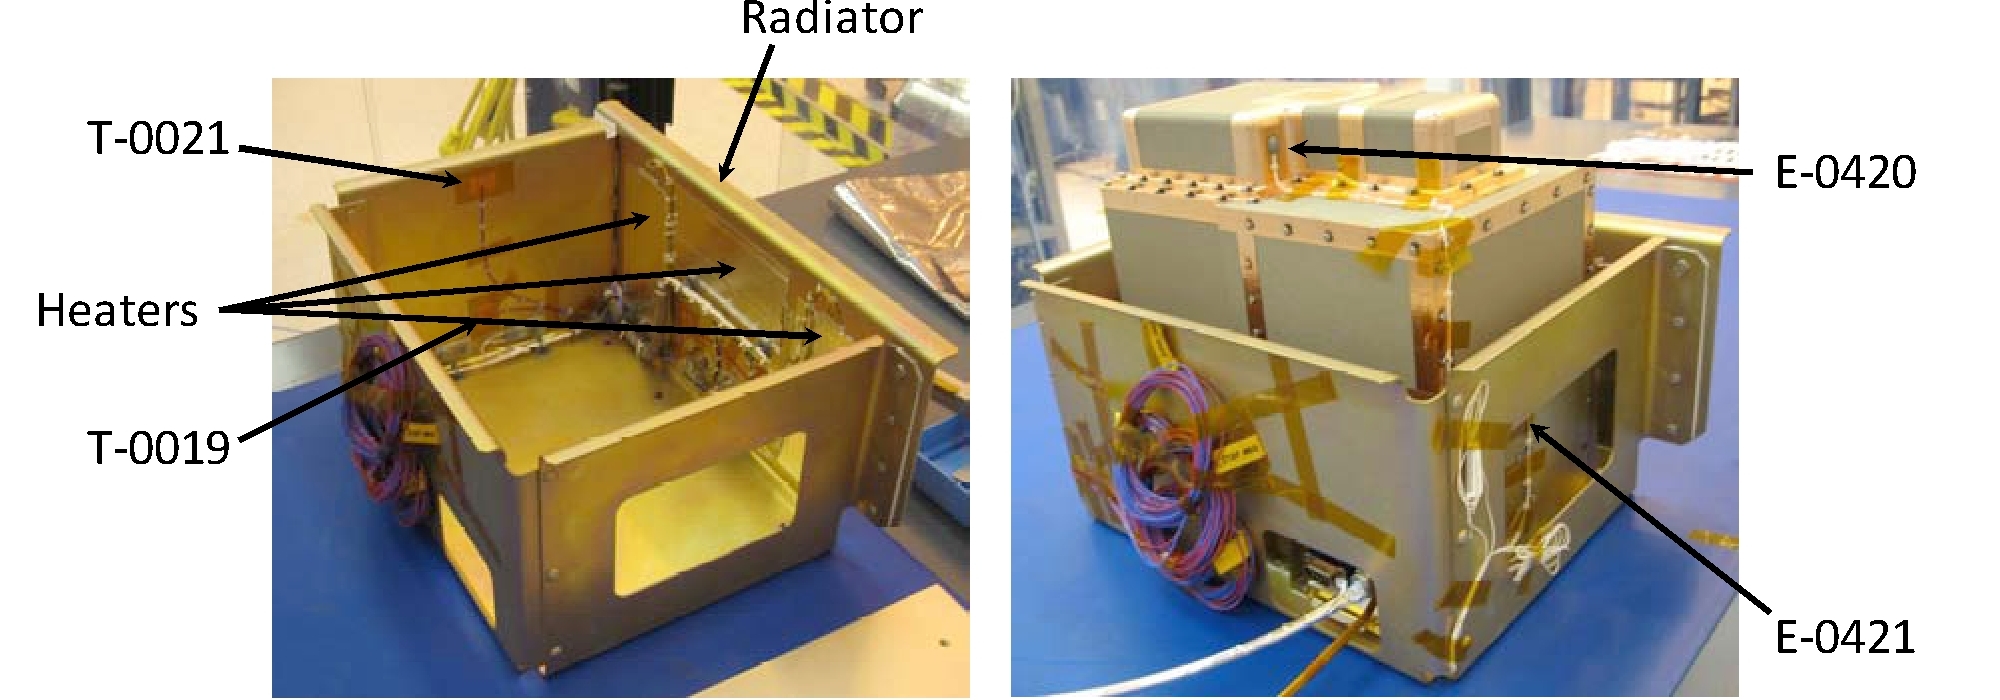
Figure 4. Location of GRaND�s external temperature sensors. GRaND sits in an anodized aluminum frame to which the thermal blanket is attached. The frame is thermally-isolated from the spacecraft. Thermal control is accomplished using a radiator equipped with resistive heaters, which is attached to the frame and located on the +Y side of GRaND in flight. Temperature sensors are attached to the frame and to GRaND. E-0421 is located on GRaND’s aluminum chassis in proximity to the condenser section of the CZT heat-pipes (see Fig. 1).
A survey of the thermal data acquired in DC041 is presented in Fig. 5. The power profile shows that the anneal heaters consume about 5.8W and that the total anneal power is less than that consumed during science data acquisition, consistent with the results of operations in TVAC. Stabilization of GRaND’s internal temperatures requires a few days. The BGO temperature lags the CZT and has the longest time constant due to the long thermal path from the sensor to the radiator. The external sensor mounted on the top of GRaND (E- 0420 in Figs. 4 and 5) also takes a long time to stabilize. The CZT sensor and the condenser sensor (E-0421) respond promptly to changes in power. Over long periods of time, these sensors follow the gradual changes in the distribution of heat within the instrument, controlled by the thermal properties of the scintillators and noryl housing, which have high heat capacity in comparison to aluminum. Overall thermal regulation is provided by an external thermostat, which monitors thermocouples (T-0019 and T-0021), mounted on the radiator frame on the side of GRaND opposite the heat pipes, and regulates power to resistive heaters mounted on the radiator panel (Fig. 4). As can be seen in Fig. 5, T-0021 varied by less than 5°C and was kept below 0°C by the thermostat.
During the application of heater power (Fig. 5), the CZT temperature increased rapidly, achieving maximum value close to 61°C before the heaters were commanded off. The anneal duration of 1.5h was not sufficient to trip the upper limit of the thermostat. During the application of heater power, the temperature at the heat pipe condenser (E-0421) increased by a few degrees, closely following the profile of the CZT temperature. The response of the BGO and top sensor (E-0420) lagged the CZT temperatures.
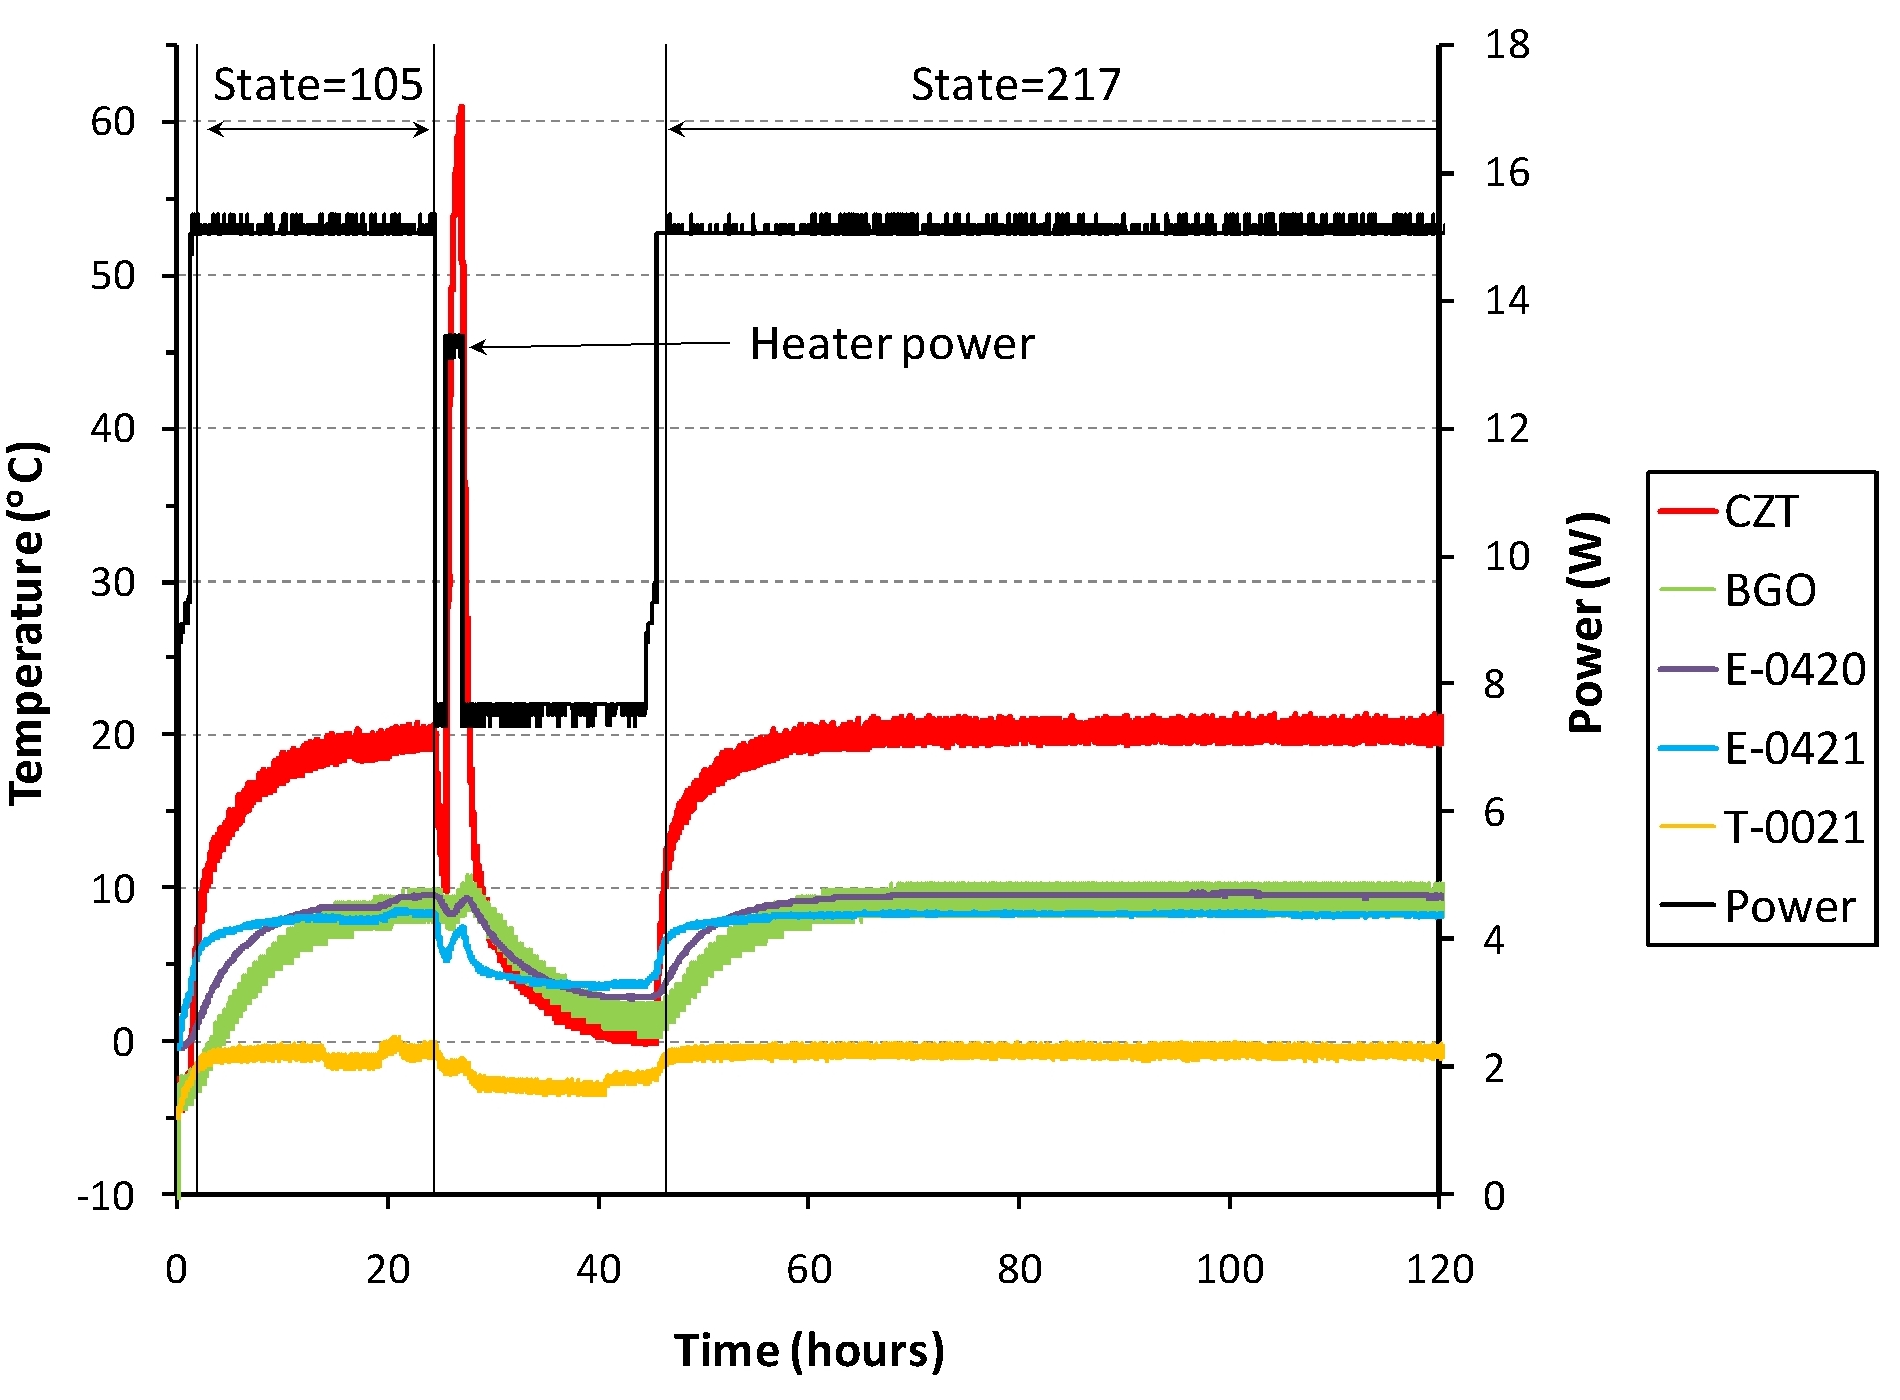
Figure 5. Thermal data acquired in DC041. CZT and BGO refer to internal temperatures included in GRaND�s SOH telemetry (see text). The remaining temperatures are from external sensors recorded in the S/C engineering telemetry. Fig. 4 shows the location of the external sensors. In addition, the power consumed by GRaND is shown. The power was determined by multiplying GRaND�s current (from the S/C telemetry) by 32V, which is the approximate voltage observed on the DMD GRANDITAR display during the activity. The state indices for science data collection before and after the anneal are given.
The long term behavior of the temperature readings during the cool-down phase (17.5h) following the application of heater power is puzzling in that the internal temperatures drop below the external values (e.g., compare BGO and CZT to E-0421 and T-0021). This is likely caused by errors in the calibration offset for either the AD590 internal sensors or the exterior thermocouples.
Nonetheless, we proceeded with a thermal analysis using Eq. 1 assuming that T(t)-TC was given by the difference between the CZT(1) sensor and E- 0421. A plot of the temperature difference during the anneal and cool down periods is shown in Fig. 6. The increase in temperature is best fitted by C and τ of 0.036 K/s and 1500 s (25 minutes), respectively. The fitted saturation temperature difference was ΔTS = 54°C, which implies a peak temperature of 62°C for a condenser saturation temperature of 8°C. The analysis indicates that the CZT temperature was nearing the saturation value when the heater power was turned off. The slight adjustment in C from the value of 0.034 K/s determined in TVAC was necessary to fit the curvature of the leading edge of the temperature pulse. The value of τ determined for DC041 falls between the values determined for the low- and high-temperature TVAC tests. Eq. 1 was used to calculate the temperature profile during cool-down given the fitted value of τ. The model does not match the observed die-away over long time scales. At least one additional long-term exponential may be needed to fully describe the behavior of the system, which would slightly increase the predicted peak temperature.
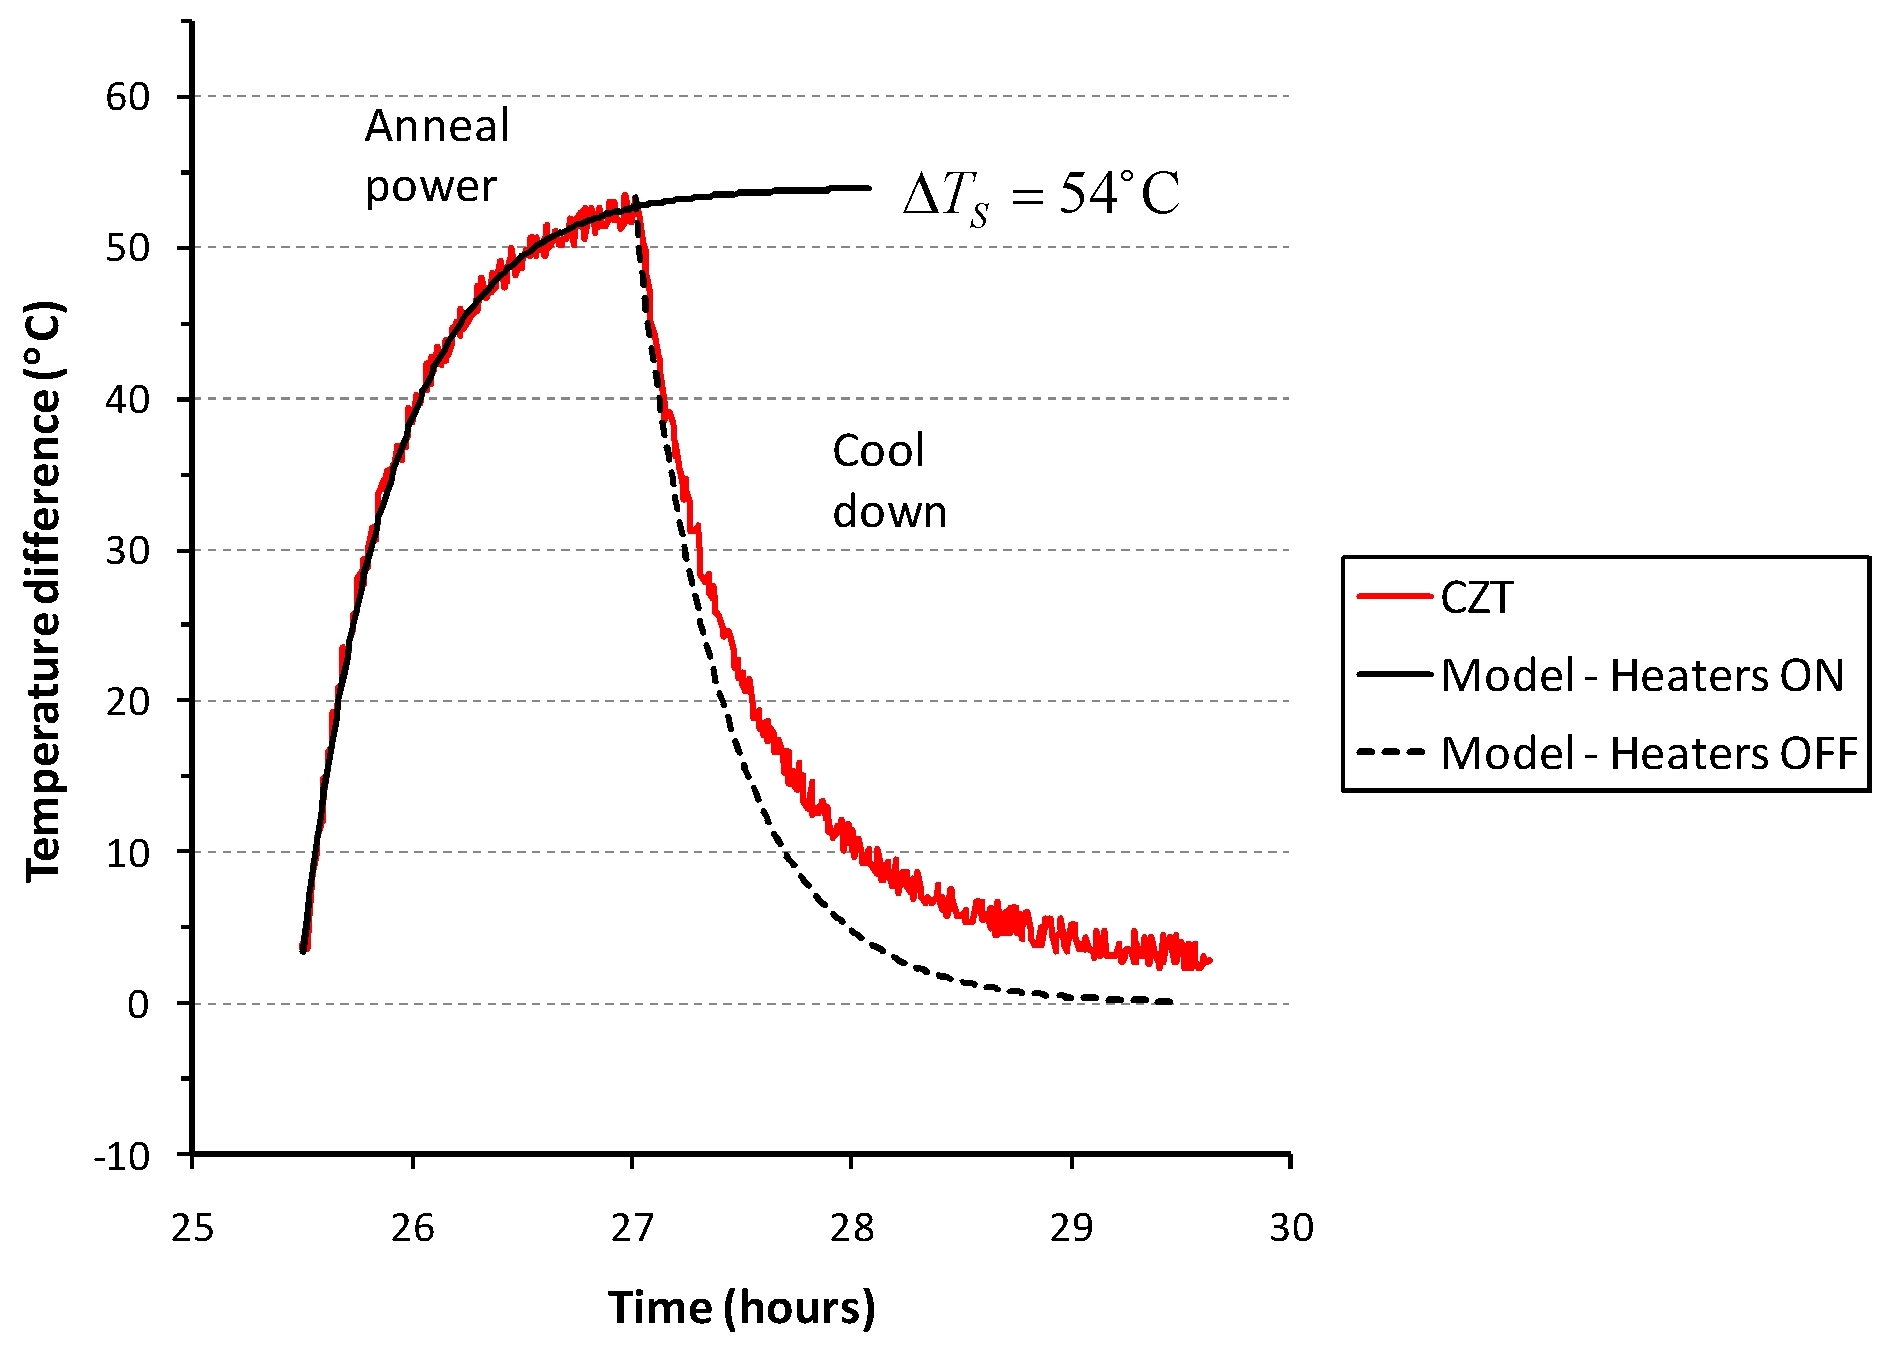
Figure 6. Fits of Eq. 1 to the temperature difference (CZT-condenser) measured during the anneal test of DC041. The increase in temperature is best fit by C and τ of 0.036 K/s and 1500 s (25 minutes), which gives a saturation temperature difference of ΔTS = 54°C.