GRaND Operations During Cruise: DC003 and DC014
NASA Dawn Mission
Thomas H. Prettyman Planetary Science Institute Albuquerque, New Mexico
Version 1.3
26-Sep-08
Introduction
The Gamma Ray and Neutron Detector (GRaND) is one of the three science payload instruments on the Dawn spacecraft (S/C), which is on its way to the main asteroid belt. GRaND will measure the spectrum of gamma rays and neutrons originating from Vesta and Ceres while the S/C is in orbit around each body. The instrument, which is mounted on the +Z deck of the spacecraft, consists of 21 sensors designed to separately measure radiation originating from the surface of each asteroid and background sources, including the space energetic particle environment and cosmic ray interactions with the spacecraft. The nuclear spectroscopy data provided by GRaND will be analyzed to determine the abundance of major rock forming elements, such as Fe, Ti, Al, Mg, and Ca, and radioactive elements, including K, U, and Th, as well as light-elements such as H and C, which are the primary constituents of ices.
In November of 2009, the Dawn S/C will fly by Mars. At closest approach, the altitude and accumulation time will be sufficient to measure gamma rays and neutrons originating from Mars. Direct comparisons between measurements made by the 2001 Mars Odyssey gamma ray and neutron spectrometer subsystems and GRaND will enable accurate calibration of GRaND for determining elemental abundances at Vesta and Ceres and to determine the sensitivity of GRaND to planetary emissions. Following launch in September of 2008, GRaND was operated and measured the background space environment for 14 days in two separate tests, during initial checkout (DC003) and cruise (DC014). During the time GRaND acquired science data, the space environment was quiet, in that the flux of solar energetic particles (SEP) was minimal, and the response was dominated by galactic cosmic rays (GCR). When in orbit around the target bodies, a quiet space environment is ideal for acquiring data for determining elemental abundances, because the source (GCR) is constant and well-characterized. In addition, GCR produce copious neutrons and gamma rays in the near surface of planetary bodies, providing a signal that is strong compared to the energetic particle background. Consequently, the measurements made during ICO and cruise are important for determining the response of GRaND to the space environment (galactic protons, gamma rays, etc...) and radiation induced by GCR interactions with the spacecraft. The data acquired during ICO and cruise will supplement data acquired during the laboratory and MGA to fully characterize GRaND prior to encountering Vesta and Ceres. Questions include:
	  1.  What is the direct response of GRaND to energetic particles from the
	      space environment?

	  2.  What are the background levels associated with GCR interactions with the
	      spacecraft and how does GRaND respond as a function of fuel loading?

	  3.  What is the response of GRaND as a function of particle type, energy,
	      and direction?

	  4.  What is the sensitivity of GRaND to planetary sources of gamma rays and
	      neutrons from Mars, Vesta, and Ceres?
The answer to these questions, involves detailed modeling of the instrument and spacecraft and analysis of the calibration and flight data, which is underway. A summary of data acquired during DC003 and DC014 are reported and consequences for the instrument's performance and state-of-health are discussed.
Data Products
The GRaND instrument consists of 21 sensors, which are read out by analog pulse processing electronics. Signals from the analog circuit are processed by a field programmable gate array (FPGA), and events (radiation interactions) are divided into categories associated with gamma ray and neutron interactions (Fig. 01). Examples of data products for measurements made during calibration are shown in Fig. 02. A microcontroller sorts events from the FPGA, binning them into histograms and recording a stream of event mode data for post-processing on the ground. The microcontroller sends fixed-length science and state-ofhealth (SOH) telemetry records to the spacecraft via an RS422 interface at regular intervals. The accumulation times for science data acquisition and the time interval between updates of the (SOH) data are commandable.
Science data (APID 190) are stored in VR5. SOH data (APID 191) are stored in VR3. The data are transmitted to Earth via the high gain antenna (HGA) and are delivered by the Dawn Science Center to the GRaND team as level0, raw telemetry files with packets ordered in time and corrupt packets discarded. The level0 data are processed by the GRaND team to produce higher level products. Level1a data are processed via reversible operations (such that the level0 data can be reconstructed from the level1a data). Operations include decompression of spectral histograms and decoding of the event mode data for gamma rays and neutrons. Level1b data involve irreversible processes to produce a time series of counting data and derived histograms, with energy calibrations applied and with artifacts, such as the differential nonlinearity of the ADC, removed. The time-series, level1b counting data will merged with ephemeris data to produce the final level1b data set for delivery to the PDS. The ephemeris data will be reported as follows:
1. <distance to body center>, <direction to body center(cosines)>, <velocity vector> for MGA and when in orbit around Vesta and Ceres;
2. <heliocentric distance>, <Sun direction (cosines)>, <velocity vector> during cruise.
The direction cosines (u, v, w) and velocity vector are given in the Cartesian reference frame of the spacecraft (X,Y,Z) relative to the body of interest: Mars, Vesta, Ceres, or the Sun during cruise. The ephemeris data can be combined with a shape model and a physical model of the surface (elemental composition and layering) to calculate the response of GRaND for all of the bodies that will be encountered, including Mars for which the motion of the S/C relative to thermal neutrons must be considered.
DC003 (ICO)
Initial check out was performed in October of 2007 following a successful launch in September. The S/C was at a heliocentric distance of approximately <ICO-HCD> AU. For the purpose of powering on and configuring the instrument, commands and telemetry were in real time. The GRaND team participated at DSC, with the GRaND Team Leader on the VOCA providing approval for each command block (for example, 100DN increments in high voltage for each channel) following verification that the instrument was functioning properly. All of the commands sent to the S/C were received and executed by GRaND. The process of configuring the instrument, which included ramping up all of the high voltage power supplies, took 3 hours and 32 minutes (powered on at 2007-10-16T17:16 SCET/UTC and fully configured for science data acquisition at 2007-10-16T21:48). Once configured, GRaND collected science data with an accumulation time (TELREADOUT) of 70s for 5.9 days with the SOH readout interval (TELSOH) set to 10s. The instrument was monitored remotely by the GRaND team via the DMDs and the Rampage web site. External temperatures remained within limits and engineering data were nominal throughout the test. Power consumption during power up and operation was the same as observed during ATLO and in the laboratory. On 22-October (2007-10-22T16:05), the power down command was sent to the spacecraft to conclude the test.
Two Incident Surprise Anomalies (ISAs) were written during DC003. They are summarized here:
   1.  ISA #: Z91700: GRaND Playback apid_190 has SCLKs out of order but
       sequence is in order During GRaND instrument checkout, it was observed
       that the SCLK values periodically regressed while the ERT values were
       monotonically increasing.  In addition, the packet sequence counter was
       monotonically increasing. This results in TDS fragmentation, which could
       prohibit long-term data acquisition during cruise unless modifications
       are made to the GDS software. The project can accommodate the time
       regression problem during MGA; however, measurements during cruise could
       be limited until the GDS software is revised to accommodate the problem.
       A review of the data acquired by GRaND reveals that time regression was
       present during instrument development through ATLO and cruise.  Since the
       packets are always in the correct order when sorted by SCET and SOH time
       stamps do not regress in time, the source of time regression is probably
       internal to GRaND.  A description of the problem along with an approach
       to minimize the number of science data records with time regression is
       described in Appendix A.

   2.  ISA #: Z91701: GRaND Channels G-3407, G-3408 and G-3409 mis-defined 8-bit
       data numbers provide information on the status of the FPGA contain.  Each
       bit gives the status of a particular aspect of the FPGA.  The data
       numbers were not properly decoded and reported in association with FPGA
       functions.  This ISA needs to be addressed prior to MGA.
Level 0 raw telemetry data were delivered by DSC to the GRaND team, which processed level1a and level1b data. The science data file contained 7267 records. The SOH file was attenuated by a factor of 3 (every third SOH packet was included in the file). Note that the S/C decimates the SOH data by a factor of 3 on its way into VR3. In order to increase the sampling rate in future tests (for example, MGA), the filter factor could be adjusted from 3 to 1, which would have an impact on available storage and playback. Level1b data (without the ephemeris data) were delivered to the Dawn team for review. Note that some SOH data files were acquired in real time (for example, "grd_191rt_072900230_2400_0.dat") and were not attenuated.
The GRaND team evaluated the SOH and science data to determine the performance of GRaND relative to previous tests carried out during ATLO and in the laboratory prior to delivery. SOH data for internal temperatures were within limits given in the GRaND User's Manual [Prettyman et al., 2006] throughout DC003. High voltage measurements were steady and consistent with values measured during ATLO.
Scalar counting data included in the science data records varied slowly during the test (Fig. 3). The CZT event scalar (denoted S14) increased over a 26 hour time period and leveled out, achieving a constant value, for the remainder of ICO. Spurious increases in S14 counts were also observed early in the test. The scalar counting rates for all of the scintillators showed a slow decrease throughout ICO (a 6% reduction in the total number of interactions over the entire time after correction for dead time, which was approximately 11s per measurement interval). A portion of the observed initial increase in counting rate for the CZT array may be due to stabilization of the temperature of the counting system. The vertical line in Fig. 3 gives the approximate time at which the CZT array reached its final, equilibrium temperature, at which time the CZT scalar counts were approaching a constant value.
The scalar counter for coincidences between three or more sensors (denoted S16 and labeled "threefold coincidence" in Fig.03) is an indicator of the flux of high energy particles (for example, GCRs and solar energetic particles) and accounted for 20% of the total events. The time variation of S16 is not the same as the scintillators or the CZT array. Differences in the time variation observed for the scalar counting values recorded by GRaND, including the spurious increases in counting rate for the CZT array, indicate that GRaND is sensitive to the energy distribution of particles in the space environment. Additional analysis, modeling, and operational experience will be needed in order to use the data to determine the type, energy distribution and flux of incident particles.
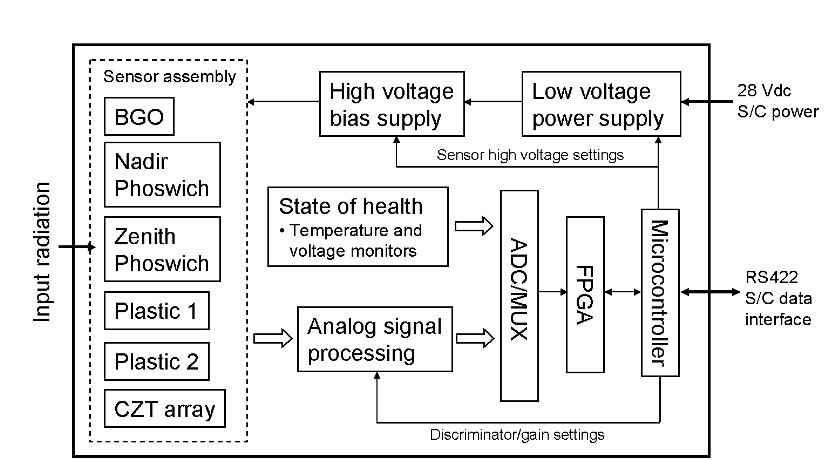
                              Overview of Event Categorization:
             Thermal and epithermal neutrons   Cat 1  - Single interaction in phoswich
             Epithermal neutrons               Cat 2  - BGO -Plastic coincidence
             Fast neutrons                     Cat 4  - Double interaction in and plastic scintillator
             gamma-background suppression      Cat 7  - CdZnTe -BGO coincidence
             gamma-spectrum low resolution     Cat 9  - BGO single
             gamma-spectrum high resolution    Cat 10 - CdZnTe single
             2-fold or higher coincidence multiplicities are rejected. Special scaler for
             counting higher order multiplicities.
Figure 1. Electronics block diagram for the GRaND instrument is shown along with event categories recorded in the science data.
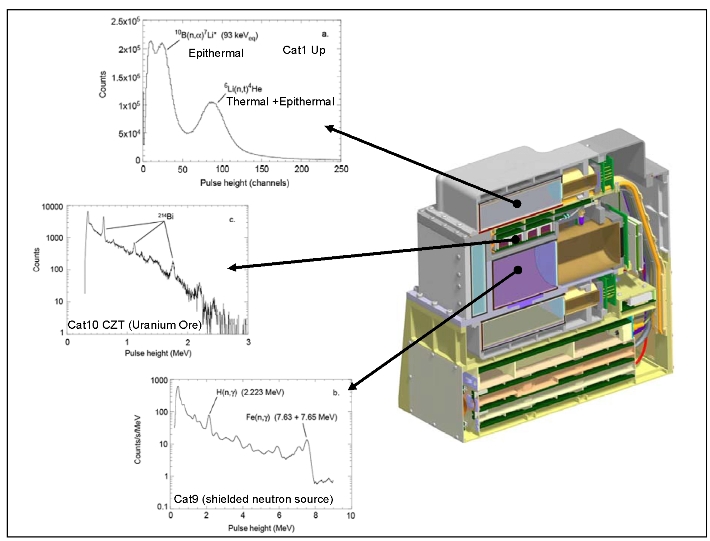
Figure 2. Cutaway view of the GRaND instrument showing internal components, including the top and bottom phoswiches, one of the side scintillators, the CdZnTe (CZT) array, and the BGO crystal, along with photomultiplier tubes and electronics boards, heat pipes for the CZTe array, structural and housing materials. Three data products are shown as pulse height spectra: a) Cat1 histogram for the upper phoswich acquired for a neutron source with an energy distribution similar to that expected at Vesta and Ceres; b) Cat9 histogram for the BGO scintillator for an iron slab coupled to a neutron source containing polyethylene; and c) Cat10 histogram for the CZT array for carnotite, which is an uranium-bearing ore.
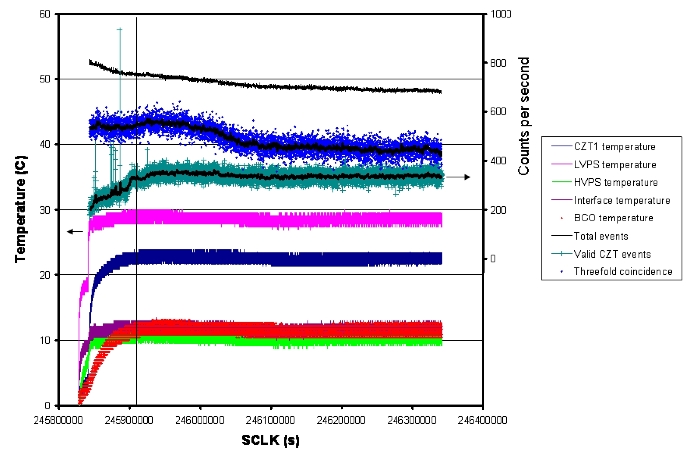
Figure 3. Selected internal temperatures and scalar counting rates corrected for dead time measured during ICO (DC003). A linear stretch (slope of 15 with an offset of 2000) was applied to the threefold coincidence counts (S16) in order to emphasize time variations. A linear stretch was also applied to the valid CZT events (slope of 17 with an offset of 500).
DC014 (Earth-Mars Cruise)
DC014 occurred in April of 2008 while the spacecraft was in transit between Earth and Mars at a heliocentric distance of approximately TBD AU. DC014 was the only test of GRaND aside from ICO prior to MGA. In contrast to ICO, the entire set of commands for power on and configuration was uploaded and executed on the spacecraft while the telemetry data were monitored at DSC by the GRaND team. Power on and configuration lasted 1.9 hours, starting at 2008-04-01T02:31 and ending at 2008-04-01T04:25 SCET/UTC. Once configured, GRaND collected science data with an accumulation time (TELREADOUT) of 200s for 7.6 days with the SOH readout interval (TELSOH) set to 10s. No anomalies were noted during power on and configuration for science data acquisition. Internal and external temperatures were within limits throughout the test. HV readouts were consistent with values recorded in ATLO at each step during ramp up. Power consumption was consistent with ICO and tests carried out in ATLO and in the laboratory. During DC014, the GRaND team issued a request to adjust instrument settings using the NIPC process, which was successfully demonstrated. Based on a review of the science data prior to the NIPC request, GRaND was functioning optimally. Consequently, the requested changes involved minor adjustments in coincidence windows for Cat2 data products. On 8-April (2008-04-08T16:03), the power down command was issued to GRaND by the spacecraft fault protection system when the spacecraft unexpectedly went into safe mode.
During the test, 3268 science records were stored in VR5. A review of the SOH data file shows that the SOH playback data were attenuated by a factor of 3, as discussed in the section on ICO; however, there were short periods of time in which real time data were available. The DSC delivered the raw telemetry data (level0) to the GRaND team and the data were analyzed to produce level1a and level1b data sets. Scalar counting data, corrected for dead time, and temperature data are shown for selected channels in Fig.04. Both the scalar counting data and temperatures are similar in magnitude to those observed in ICO (Fig.03); however, the time variation of scalar counting rates is different. For example, the CZT channel does not contain spurious increases in counting rate and steadily decreases throughout the test, perhaps in response to external variations in the space radiation environment. Acquisition of data over longer (perhaps months) periods of time is desired in order to monitor the space background and compare measurements made by GRaND to other instruments (such as ACE). Such comparisons may help rule out instrumental drift as a source of the observed time variation in the scalar counting data.
One important difference between ICO and DC014 was the accumulation interval for science data specified by TELREADOUT. Both the SOH and science data files contain scalar counting data, including the dead time counter (DTC), recorded by 16 bit registers. The scalar data are needed for data reduction and analysis. For very long measurement intervals, the registers roll over. If rollover is not detected, then the wrong value is used in the analysis resulting in systematic errors in the derived data products. Since register overflows are not reported in telemetry, the sampling rate of the SOH data needs to be set high enough to observed rollover events. For example, Fig. 4-1 shows how setting TELSOH=10s enables the detection of rollover events for the DTC. The need to detect rollover events puts constraints on the length of SOH intervals. Setting TELSOH to be very large in order to avoid time regressions would result in loss of important information. Similarly, setting TELSOH=TELREADOUT when TELREADOUT is large (for example, 200s) would also result in not knowing how many times the DTC or other scalars rolled over.
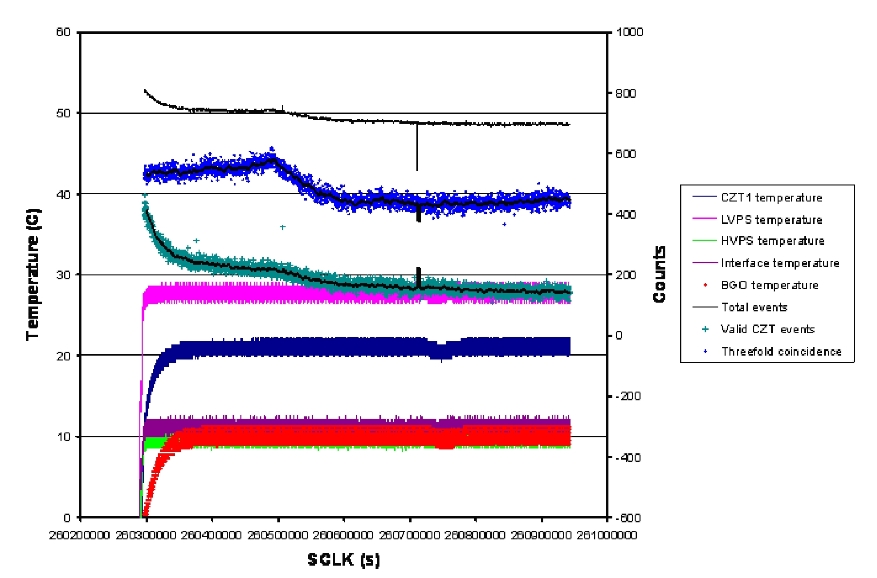
Figure 4. Selected internal temperatures and scalar counting rates corrected for dead time measured during Earth-Mars cruise (DC014). A linear stretch (slope of 15 with an offset of 2000) was applied to the threefold coincidence counts (S16) in order to emphasize time variations. A linear stretch was also applied

Figure 4-1. SOH data from DC014 showing the transition from TELREADOUT=70s to TELREADOUT=200s. Note that the dead time counter (DTC) rolls over twice during each of the 200s acquisition intervals. The DTC, which is 16 bits, does not achieve the maximum value when the acquisition interval is 70s. The scalar counting data are reset at the beginning of each science data acquisition interval.
Science Data Products
Science data acquired by GRaND during ICO and DC014 were analysed to produce level1a and level1b data, which were summed to produce cumulative pulse height spectra. Data products contained in the level 1b files include:
   * Cat1 histograms (Up/Down)
   * Cat2a histograms
   * Cat4 histograms (early minus late)
   * First event, second event, and TTSP
   * BGO spectrum (ADC DNL corrected)
   * CZT spectra (16)
   * CZT cumulative spectrum with energy calibration The data products for
     ICO and DC014 were qualitatively similar.  Results from ICO are
     presented here for illustration.
The Ca1 pulse height spectra for the upward and downward looking phoswiches are shown in Fig. 05. Cat1, which is single interaction with either of the phoswiches, is sensitive to the flux of thermal and epithermal neutrons. When thermal and epithermal neutrons are present, peaks appear in the Cat1 data, corresponding to neutron capture by 10B (in the plastic) and 6Li in the lithiated glass. The Ca1 histograms measured during ICO show a continuum, which indicates that thermal and epithermal neutrons are below the detection limits. The Cat2a histograms are shown in Fig. 6. Cat2a is a coincidence between the plastic scintillators or phoswiches and the BGO sensor, energy gated to detect coincidences between the 93 keVeq recoil energy of the 10B(n,α) reaction in the plastic and the deposition of 478 keV in the BGO by the associated gamma ray. Experiments with laboratory sources of thermal and epithermal neutrons show strong peaks in the BGO and plastic channels, which are absent in the data acquired during ICO, with the exception of the left and right plastic channels (Fig. 06). The data show that thermal and epithermal neutrons are at or below the detection limits of GRaND, which indicates that the spacecraft does not strongly moderate neutrons produced by galactic cosmic rays. Evidence for GCR interactions can be found in the strong fast neutron signature (Cat4), shown in Fig. 07 for the upward and downward looking phoswiches. The downward looking sensor, which is on the spacecraft side of GRaND, has a higher counting rate than the upward looking sensor, which indicates that the spacecraft is the source of neutrons. The time-tosecond-pulse spectrum shows the characteristic die-away associated with moderation and absorption of neutrons in the plastic scintillator in addition to an artifact (peak) at short die-away time associated with after pulsing, which was also observed on Mars Odyssey and Lunar Prospector.
Uncalibrated pulse height spectra acquired by the CZT array are shown in Fig.08 for individual crystals (inset). Event mode CZT spectra were combined to form a single pulse height spectrum using energy calibration curves measured in the laboratory. The summed spectrum reveals a strong 511 keV peak from positron annihilation in surrounding high Z materials, superimposed on a continuum. The broad peak observed between 1.5- and 2.-MeV was unexpected. The peak centroid varies between detectors, which may indicate that the source of the peak is energetic particles that traverse different path lengths through exposed portions of the CZT crystals. The counting rate for the peak is consistent with the 4 cm 2/s flux of GCR protons; however, the centroid is somewhat lower than expected for minimally-ionizing protons. Modeling, which is underway, will be needed in order to identify the source of the peak.
A calibrated pulse height spectrum measured by GRaND during ICO is compared with the cruise spectrum for Lunar Prospector in Fig. 09. The LP spectrometer was mounted on a boom, and saw less exposure to radiation generated in the spacecraft than GRaND. The proximity of GRaND to the spacecraft will reduce the sensitivity of GRaND to planetary sources of gamma rays. Data from Mars Flyby along with modeling will be effective in predicting the elemental sensitivity of GRaND at Vesta and Ceres. The data acquired in DC014 (also in combination with models of the spacecraft and instrument) will provide essential information needed to determine the background from the spacecraft and space environment.
Conclusion
The data acquired during ICO and DC014 show that GRaND is functioning nominally following launch. The datasets will be useful in characterizing the response of GRaND to background sources, including the spacecraft and space environment. The ISA on timestamp regression identified in ICO does not need to be resolved before MGA; however, because the problem makes it difficult to acquire GRaND data over long periods of time, a resolution is needed for Mars-Vesta cruise and encounters with the asteroids. We propose that a test be carried out prior to Mars closest approach to determine if adjusting TELSOH such that SOH data packets are not written at the same time as science data packets will eliminate instances of time regression (see Appendix A). The need to use TELSOH to monitor rollover of scalar counting registers makes it desirable to subsample the science acquisition interval and to change the playback decimation factor from 3 to 1. The report will be updated as additional information from modeling and data analysis work is available.
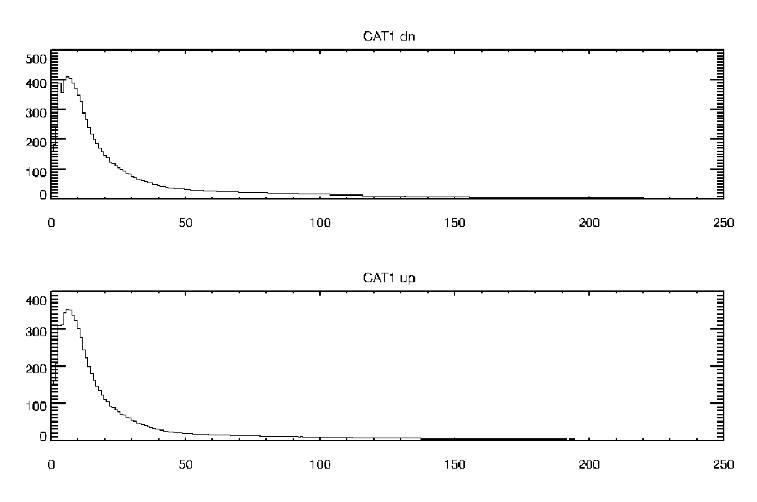
Figure 5. Cat 1 pulse height spectrum (the x-axis is channel number) for the upward looking (up) and downward looking (dn) phoswiches. The downward looking phoswich is on the spacecraft side of GRaND. The upward looking phoswich faces nadir during science data acquisition at Vesta and Ceres.
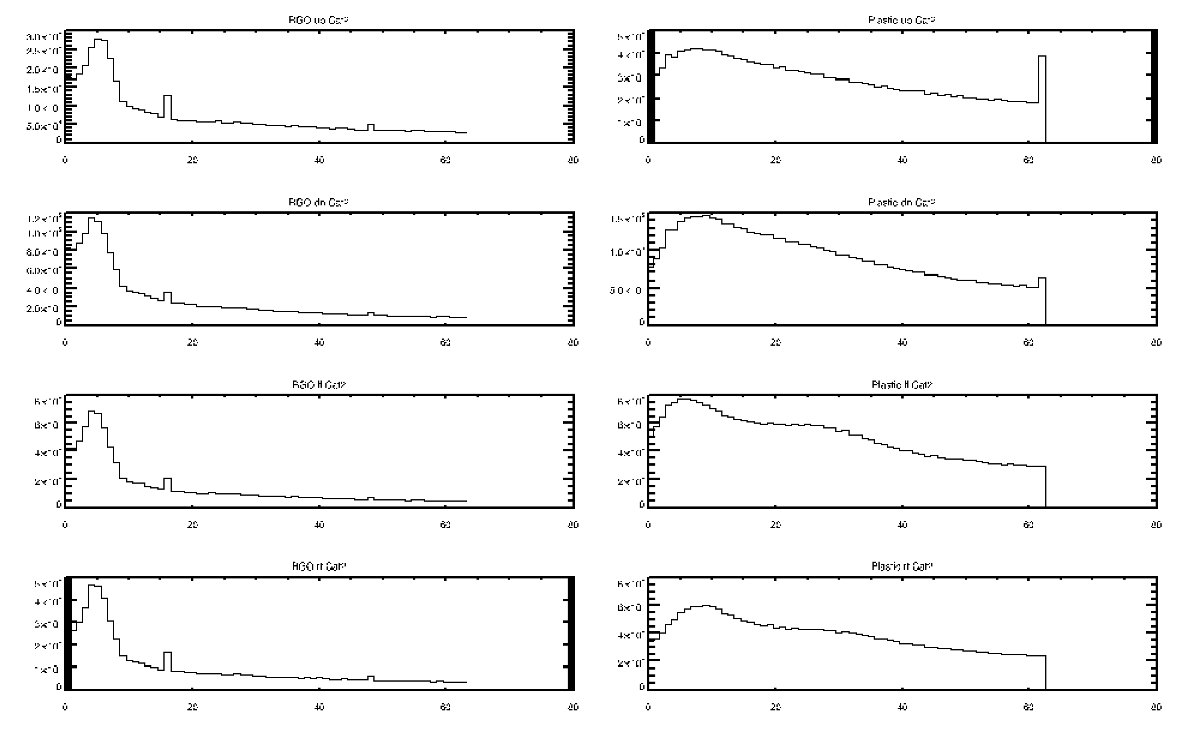
Figure 6. Cat 2a histograms for all four plastic scintillators. The BGO pulse height spectrum for each scintillator is shown on the left. The pulse height spectrum for boron-loaded plastic is shown on the right.
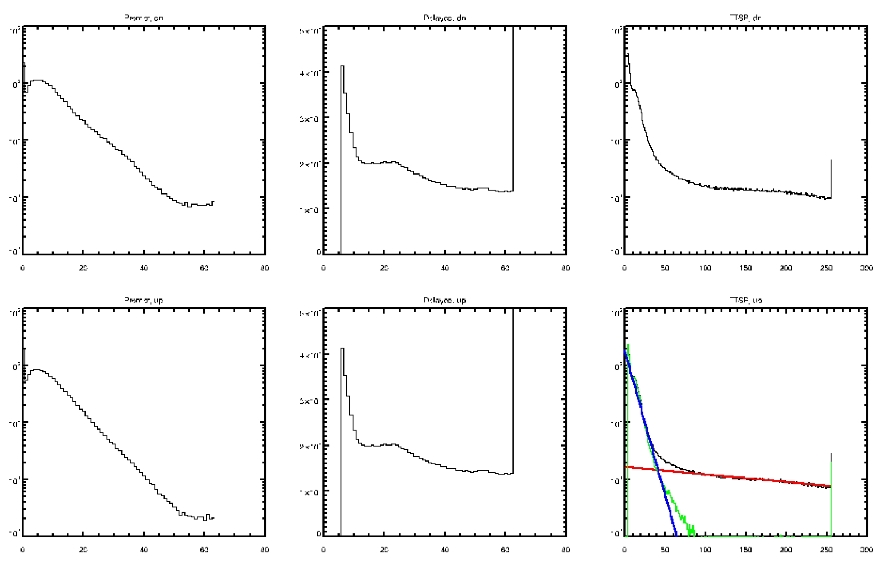
Figure 7. Cat 4 histograms [Prompt, delayed and time to second pulse (TTSP)] are shown the upward looking (up) and downward looking (dn) phoswiches. The prompt histogram is the fast neutron spectrum. The x-axis on the first two plots (left to right) gives channel number. The third axis is time in 10s of microseconds. The downward looking phoswich is on the spacecraft side of GRaND. The upward looking phoswich faces nadir during science data acquisition at Vesta and Ceres.
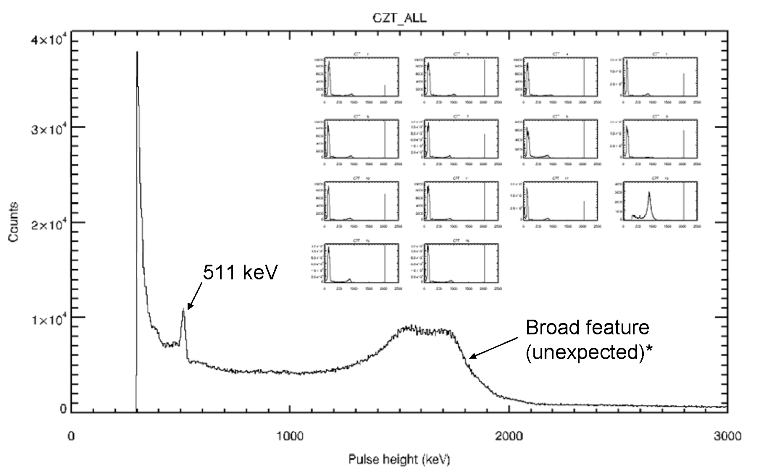
Figure 8. Data for the CdZnTe array are shown as individual pulse height spectra (inset) for each active channel and as a summed spectrum, calibrated so that pulse height is in keV. *The broad feature at high energy may be caused by energetic charged particles (see text for details).
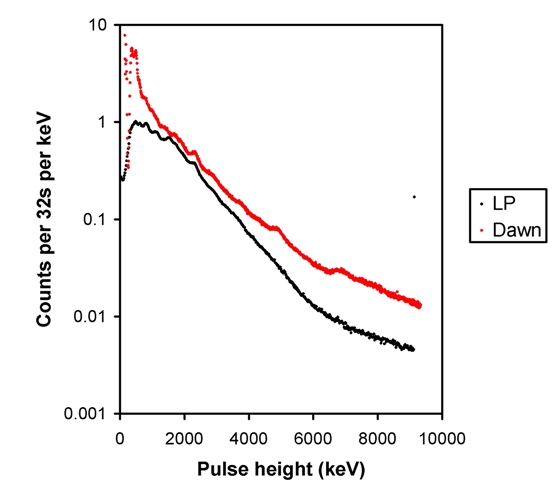
Figure 9. The pulse height spectrum measured by the BGO sensor during ICO is compared to the cruise spectrum for Lunar Prospector (LP).
Appendix A: Time Regression
GRaND's science data records (APID 190) consist of 23 packets, the first 22 of which contains 1017 bytes of data (not including the header). The last packet contains 39 bytes of data (for a total of 22574 bytes, including the 7-byte packet headers). Each packet is tagged with a SCLK value, which originates from the S/C "heartbeat," which is sent to GRaND as packetized data every 60s. The SCLK value stored in each science packet has a resolution of 1s and is updated at the time of transmission by the number of pulses received from the S/C 1pps signal from the last 60s heartbeat. The 1pps signal has a dedicated line on the RS 422 interface and is monitored by the FPGA. In principle, the time of the end of each science data record is known to within 1s. Here, we use GCLK to refer to the value for SCLK returned in APID 190 by GRaND. GRaND also assigns each packet an identification number, known as the packet sequence counter (PSC). If the PSC is monotonically increasing in increments of 1, then the packets can be decoded to extract science data. In addition, the time (SCET) at which the S/C receives each packet is recorded by VR5. SCET and PSC have been observed to increase monotonically during ICO and DC014; however, GCLK has been observed to periodically increase and then decrease, when SCET and PSC were increasing. This resulted in fragmentation of files created by the GDS, which is problematic for the acquisition of data over long periods of time.
A predictive model of time regression was developed, which can be tested using data acquired during ICO and cruise. The GRaND SOH data (APID 191) are written using a different mechanism that the science data at intervals determined by the commandable parameter TELSOH. A crucial difference between the science and SOH packets is that SOH packets use a SCLK value given by the last heartbeat, which has a cadence of 60s. For ICO and DC014, TELSOH was 10s, while TELREADOUT was 70s. This means that at the end of the science data acquisition interval, SOH and science data were being prepared and transmitted at roughly the same time. Note that due to the volume of the data, all of the science data cannot be sent in one transmission. In contrast, each SOH transmission consists of one data packet. So, it is possible that a portion of the science packets are sent out, followed by the SOH data packet, followed by the rest of the science data packets. Preparation of the SOH data overwrites the register containing time with the last heartbeat value. Consequently, all of the remaining science packets in the record are assigned a GCLK value that is less than the value reported for the first set of science packets. The difference in time between the two sets of science packets is the difference between the last heartbeat and the end of the science acquisition interval, unless the SOH packet was written out before the science packets.
GCLK regression is illustrated in Fig. 1A for science records acquired during DC014 when TELREADOUT was 200s and TELSOH was 10s. Each record ends with a packet containing 39 bytes of data (NBTF), not including the header. The first, second, third, and fifth record contain packets with two different GCLK values, for which the second set of GCLK values is less than the first. The difference between the low and high values for GLCK in each science record is shown in Fig. 2A (for DC014 data file grd_190pb_080930800_0030_0.dat). The high values for GCLK were fitted to a line to determine the cadence of the science data records, which was found to be 200.0s. The deviation of the data from the linear fit was no more than -16s. A similar fit to the GCLK_LO values revealed greater deviation (from -48s to 0s). Neither the low or the high values for GCLK were found to match SCLK values retrieved from the SOH telemetry file, which implies that the low value was not derived from a heartbeat packet; however, since the packets in the SOH file were attenuated by a factor of 3, it is possible that the relevant SCLK values are missing from the SOH file.
To determine if the heartbeat SCLK values correspond with high and low GCLK values, data from a test carried out during laboratory testing of GRaND were examined. The SOH files for these tests were not attenuated. For example, SOH data, shown in Fig. 3A, reveal the transmission of 13 science data records.
During the time period shown, 15 timestamps (heartbeats) from the SCSIM were received. GCLK values for the packets in each science data record are shown in Fig. 4A. In addition to records with time regression, there are adjacent records that have exactly the same time. The relative GCLK time of the last record was 768s, which is 12s less than the elapsed time expected for 13 records (13 records x 60s/record = 780s). Other science data files for which TELREADOUT=60s also show the time increasing two records at a time, which may have implications for how to go about accurately determining the start time of each packet. Horizontal lines in Fig. 4A indicate unique values of SCLK from the SOH data file, which presumably correspond to the heartbeat from the SCSIM. None of the heartbeat values match the GCLK values (high or low) in the science data file. It does not seem like the GCLK values can be determined from the heartbeat values using a simple algorithm (such as adding the elapsed number of seconds from the last heartbeat).
Addition information is provided in Fig. 5A, in which GCLK regression is examined for 15 science records acquired during ICO for which TELREADOUT=70s and TELSOH=10s. The high values for GCLK are separated by 70s; however, the low values appear close to (but not numerically equal to) the most recent value of the heartbeat. In order to determine the validity of the timestamp, an analysis of real time data for TELREADOUT values different from 70s (ICO) and 60s (testing prior to delivery) is needed. Real time data are available for short intervals during DC014 (TELREADOUT=200s) and for other periods of time during ATLO (for example, M05, M10, and M12).
For data acquired during testing prior to delivery, the frequency for which time regression was observed can be determined for different (TELREADOUT, TELSOH) combinations: (60, 10); (60, 20); and (60, 60). We searched for files for which the instrument was configured and acquiring science data, and that contained more than 5 records and the selected combination of readout times. For (60,10), there were a 37 files with a total of 384 science records of which 63 records presented time regression. All but 5 of these files had records with time regression. For (60,20), there were 9 files with a total of 1085 records, 154 of which presented time regression. With the exception of 1 file, all of the (60,20) files had records with time regression. For (60,60), there were 115 files containing 3364 records, 19 of which presented time regression. Six of the files contained records with time regression. The most records with time regression in a single file was 10. For this file, the regressed record was always the last (39 byte) record.
Setting TELSOH=TELREADOUT=60s resulted in a drastic reduction in the number of records containing time regression, which indicates that the SOH data were systematically written immediately before or immediately after the science data. The presence of adjacent records with the same GCLK time in most of these files could imply that SOH data were alternatively written out before and after the science records, such that all of the packets in the second record has packets that are "regressed" in time. The timing of writing SOH and science records needs to be characterized. For example, is the start of the science acquisition interval always synchronized to correspond to the start of an SOH interval? If not, then the start of SOH acquisition could be staggered via the relative times for commands to set TELSOH and TELREADOUT so that SOH telemetry does not occur at the same time as science telemetry. This might explain why setting TELREADOUT=TELSOH resulted in relatively few time regressions in that there was relatively low probability of sending the TELREADOUT command within the 10- to 20s interval that science data was written. If the commanding was random in time, then as few as 1/6 of the files would show regression. This is somewhat higher than observed. So, the commanding may have been systematic or there may be other explanations as to why setting TELREADOUT=TELSOH is beneficial.
If the cause of time regression is that SOH packets are written during the period of time for which the science data are written, then instances of time regression can be reduced by selecting TELSOH so that SOH packets are never or rarely written at the same time as science packets. For example, setting TELSOH=13 when TELREADOUT is 70s might reduce the number of collisions between SOH and science packets. Another alternative might be to set TELSOH to a very large value; however, in DC014, scalar counting registers had clearly rolled over (overflowed) several times during each counting intervals. The only way to monitor overflow is to watch the SOH data increment at short time intervals compared to the science interval. To resolve the problem, additional research on how GRaND treats times and writes data is needed along with testing, which can be carried out at the beginning of MGA.
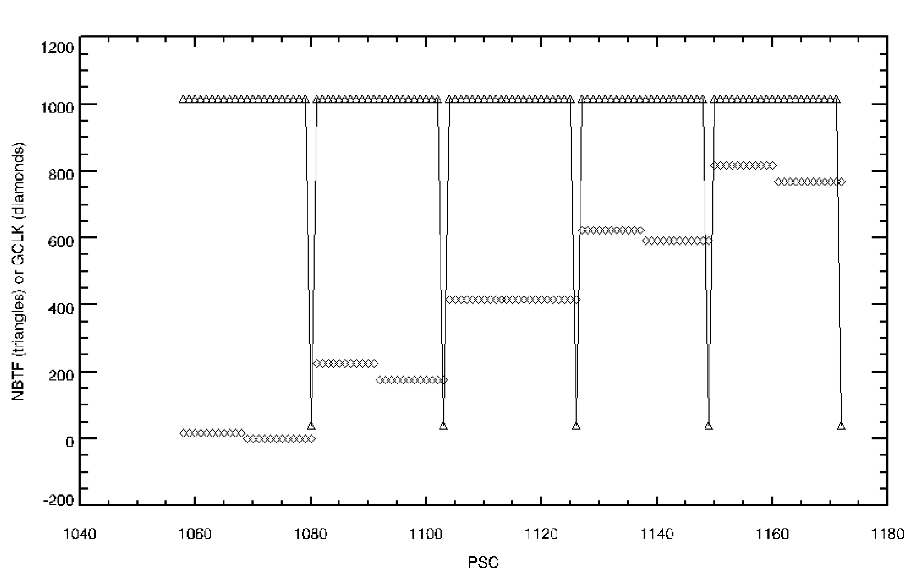
Figure 1A. Illustration of time regression in five science data records acquired during DC014 with TELSOH=10s and TELREADOUT=200s. The data are ordered according to the packet sequence counter (PSC). The number of bytes to follow (NBTF) the packet header is shown for each packet (triangles). The GCLK value (s) for each packet is shown as diamonds. The minimum GCLK value for the five records was subtracted prior to plotting the on the chart.
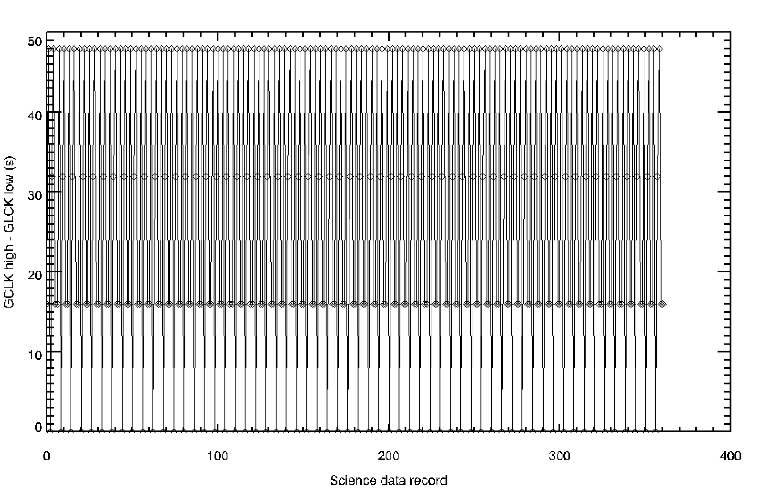
Figure 2A. Difference between the high and low GCLK values for a portion of the science data records acquired during a portion of DC014 (following instrument configuration). The difference has discrete values at 0s, 16s, 32s, and 48s.
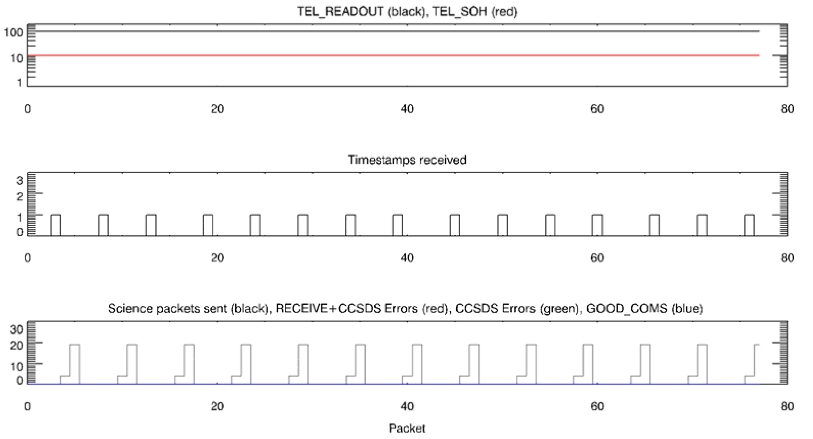
Figure 3A. SOH telemetry data acquired during laboratory testing of the GRaND instrument (05-10-20_1221-24-SOH). TELREADOUT was 60s and TELSOH was 10s. The data show that 13 science data records were transmitted and 15 timestamps were received from the SCSIM. Since the file was a continuation of data acquisition, there were 16 unique timestamps in the SOH data.
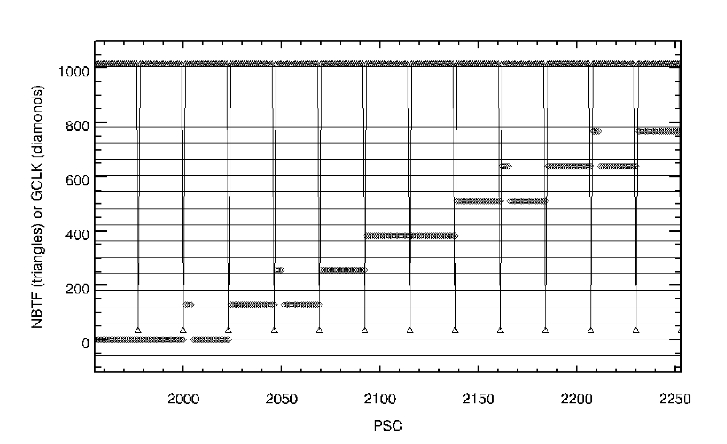
Figure 4A. Time regression observed in a science data file acquired by the GRaND instrument (05-1020_12-21-24-SCI). Data from the accompanying SOH data file are shown in Fig. 3A. The data are ordered according to the packet sequence counter (PSC). The number of bytes to follow (NBTF) the packet header is shown for each packet (triangles). The GCLK value (s) for each packet is shown as diamonds. The minimum GCLK value for the 13 records shown was subtracted prior to plotting the on the chart. Unique values of SCLK from the SOH data file (corresponding to heartbeat values from the SCSIM separated by 60s) are shown as horizontal lines.
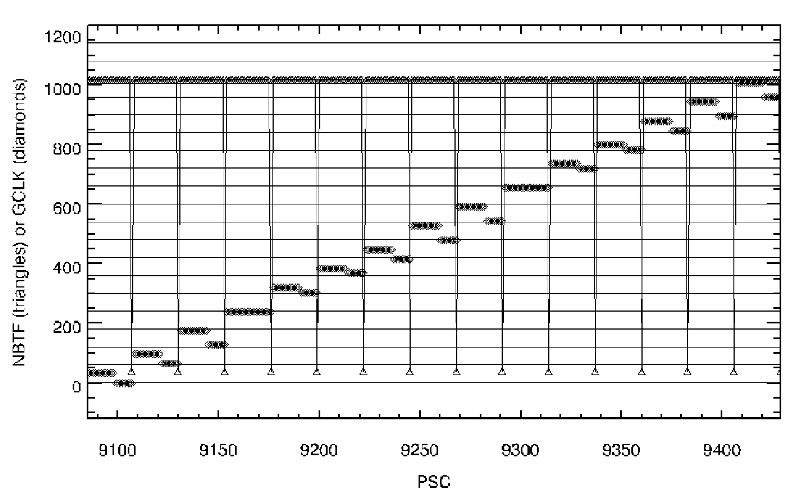
Figure 5A. Time regression observed in a portion of a science data file acquired during ICO (grd_191rt_072900230_2400_0.dat). The data are ordered according to the packet sequence counter (PSC). The number of bytes to follow (NBTF) the packet header is shown for each packet (triangles). The GCLK value (s) for each packet is shown as diamonds. The minimum GCLK value for the 15 records shown was subtracted prior to plotting the on the chart. Unique values of SCLK from the SOH data file (corresponding to heartbeat values from the S/C separated by 60s) are shown as horizontal lines.