PLANETARY SCIENCE INSTITUTE
Data processing for the reduction of gamma ray and neutron spectroscopy data acquired by the NASA Dawn mission's Gamma Ray and Neutron Detector (GRaND) is described.
Cover page artwork provided by S. Storms of Los Alamos National Laboratory.
Contents ...................................................................  1
Introduction ...............................................................  4
Instrument Overview ........................................................  4
Radiation Sensors ..........................................................  6
Electronics ................................................................  8
Operational Modes ..........................................................  8
Event Categories ...........................................................  8
Scalers..................................................................... 10
Telemetry, Data Volume, and Time ........................................... 11
Operational Considerations ................................................. 13
Data Overview and Scope .................................................... 14
LEVEL1A Processing ......................................................... 17
Processing ................................................................. 17
Ancilliary Data ............................................................ 18
Summary of processed data .................................................. 18
LEVEL1B Processing ......................................................... 21
Time Binning ............................................................... 22
Ancilliary Data ............................................................ 24
Spectrum Analysis .......................................................... 27
ADC Differential Nonlinearity corrections .................................. 28
Dead Time and Roll Over Corrections ........................................ 31
CAT1 Processing: Thermal and Epithermal Neutrons ........................... 31
CAT2 Processing: Thermal and Epithermal Neutrons ........................... 36
CAT4 Processing: Fast Neutrons ............................................. 38
CAT9 Processing: BGO PULSE HEIGHT SPECTRUM ................................. 40
CAT7 and CAT10 Event Processing ............................................ 42
Software Distributed with the PDS Data ..................................... 48
Validation: Comparison between GRaND and ODyssey ........................... 49
Qualitative Comparison...................................................... 49
Bibliography ............................................................... 52
Figure 1. Cutaway views of GRaND ........................................... 15
Figure 2. Instrument electronics block diagram ............................. 16
Figure 3. CMA time structure. .............................................. 23
Figure 4. DTS Time Structure. .............................................. 23
Figure 5. Ephemeris and pointing diagram for Mars Gravity Assist ........... 26
Figure 6. Background CMA time window ....................................... 28
Figure 7. Differential nonlinearity correction (256-channel spectrum) ...... 29
Figure 8. Differential nonlinearity correction (2048-channel spectrum) ..... 30
Figure 9. CAT1 pulse height spectrum measured in the laboratory............. 33
Figure 10. CAT1spectrum analysis: Log-Log quadratic background.............. 34
Figure 11. CAT1spectrum analysis: 93 kevee peak ............................ 35
Figure 12. CAT1 spectrum analysis: Li-glass reaction peak .................. 35
Figure 13. Time Series CAT1 counting rates for Mars flyby .................. 36
Figure 14. CAT2 spectra for the -Y BLP scintillator ........................ 37
Figure 15. Time series CAT2 counting rates for Mars flyby .................. 38
Figure 16. Fast neutron (CAT4) Processing .................................. 39
Figure 17. Time series CAT4(fast neutron) counting rates for Mars flyby .... 40
Figure 18. BGO energy calibration........................................... 41
Figure 19. Time series counting rates for the 511 keV gamma ray (BGO) for
           Mars Flyby ...................................................... 42
Figure 20. Cumulative CZT pulse height spectrum: Carnotite ................. 44
Figure 21. Cumulative CZT pulse height spectrum: ICO and MGA ............... 45
Figure 22. View through sensor assembly .................................... 45
Figure 23. Component CZT spectra ........................................... 46
Figure 24. gamma ray categories recorded in the event buffer ............... 47
Figure 25. Pair spectrometry ............................................... 48
Figure 26. MCA diagram ..................................................... 50
Figure 27. Counting rates near closest approach ............................ 51
Figure 28. Comparison of GRaND to Odyssey .................................. 52
--------------------------------------------------------------------------------
Abbreviations
--------------------------------------------------------------------------------
BGO      Bismuth germinate (scintillator)
BLP      Boron-loaded plastic (scintillator)
CZT      Cadmium Zinc Telluride (compound semiconductor, Cd1-xZnxTe, x ≅ 0.1)
FC       Framing Camera
GRaND    Gamma Ray and Neutron Detector
HAMO     High Altitude Mapping Orbit
JPL      Jet Propulsion Laboratory
LAMO     Low Altitude Mapping Orbit
LiG      Lithiated glass (scintillator)
MGA      Mars Gravity Assist (also referred to as "Mars Flyby"
MCA      Mars Closest Approach
PDS      Planetary Data System
PSI      Planetary Science Institute
SAMO     Survey Altitude Mapping Orbit
SCET     Spacecraft event time
SCLK     Spacecraft clock
S/C      Spacecraft
TBD      To Be Determined
UCLA     University of California, Los Angeles
UTC      Coordinated universal time
VIR      Visual and Infrared Mapping Spectrometer
--------------------------------------------------------------------------------
The Dawn Mission's Gamma Ray and Neutron Detector (GRaND) is a nuclear spectrometer that will collect data needed to map the elemental composition of the surfaces of 4-Vesta and 1-Ceres(Prettyman, et al., 2003). GRaND measures the spectrum of planetary gamma rays and neutrons, which originate from cosmic ray interactions and radioactive decay within the surface, while the spacecraft (S/C) is in orbit around each body. The instrument, which is mounted on the +Z deck of the spacecraft, consists of 21 sensors designed to separately measure radiation originating from the surface of each asteroid and background sources, including the space energetic particle environment and cosmic ray interactions with the spacecraft. The nuclear spectroscopy data provided by GRaND will be analyzed to determine the abundance of major, rock forming elements, such as O, Mg, Si, Al, Ca, Ti, and Fe; incompatible elements, including K and Th, detected by gamma ray emissions from the decay of long-lived radioisotopes;and H, C, N, and Cl, which are constituents of ices and products of aqueous alteration of silicate minerals.
This document describes the data processing steps used to transform raw telemetry data (Level 0) acquired by GRaND into Level1 data, which is archived by the Planetary Data System (PDS). The Level1 data consist of two types. The Level1a Experimental Data Records (EDR) are the lowest level of data archived by the PDS and contain instrument housekeeping and science data needed to create higher order data products. The Level1a data are determined from the raw data using reversible processes. The Level1b Reduced Data Records (RDR) contain data that have been irreversibly transformed to produce calibrated time series data,including pulse height spectra and counting rates that can be used to map elemental abundances at Vesta and Ceres. The GRaND RDR time series data include ancillary ephemeris and pointing data needed for mapping.
A complete description of the GRaND and the performance of the instrument during cruise and Mars Flyby is provided in the instrument paper (Prettyman et al., 2011). An overview of the instrument science objectives, design, and operations is given here.
The general scientific objectives of the GRaND investigation are:
Nuclear spectroscopy is used to determine the elemental composition of planetary surfaces and atmospheres[e.g. see Prettyman et al. (2007) for general review of gamma ray and neutron measurement principles]. Radiation, including gamma rays and neutrons, is produced steadily by cosmic ray bombardment of the surfaces and atmospheres of planetary bodies and by the decay of radionuclides in the regolith. The leakage flux of gamma rays and neutrons contains information about the abundance of major elements, selected trace elements, and ice constituents (e.g., H, C, and N) as well as elements associated with aqueous alteration products such as Cl. Gamma rays and neutrons can be measured at altitudes less than a planetary radius, enabling global mapping of elemental composition by an orbiting spacecraft. Radiation that escapes into space originates from shallow depths (< 1 m within the solid surface). Consequently, nuclear spectroscopy is complementary to other surface mapping techniques, such as reflectance spectroscopy, which is used to determine the mineralogy of planetary surfaces. The main benefit of gamma ray and neutron spectroscopy is the ability to reliably identify elements important to planetary geochemistry and to accurately determine their abundance. This information can be combined with other remote sensing data, including surface thermal inertia and mineralogy, to investigate many aspects of planetary science.
Nuclear reactions and radioactive decay result in the emission of gamma rays with discrete energies, which provide a fingerprint that can uniquely identify specific elements in the surface. Depending on the composition of the surface, the abundance of major rock-forming elements such as O, Mg, Al, Si, Cl, Ca, Ti, Fe, as well as Cl, a tracer of aqueous alteration, H, and elements with radioisotopes (40K, U series, Th series) can be determined from measurements of the gamma ray spectrum when they are present in detectable quantities. High energy neutrons produced by cosmic ray interactions loose energy in successive collisions with nuclei in the regolith, and are ultimately absorbed or escape into space. Their sensitivity to elemental composition depends on three main types of reactions that are important in three broad energy ranges measured by GRaND: inelastic scattering (important for fast neutrons greater than about 0.7 MeV); elastic scattering (epithermal neutrons between 0.1 eV to 0.7 MeV);and absorption (thermal neutrons less than 0.1 MeV). Fast neutrons are sensitive to the average atomic mass of the regolith when H is present in small quantities (H weight fractions less than a few hundred ppm). Epithermal neutrons are very sensitive to the abundance of H and are relatively insensitive to variations in the abundance of major elements. Thermal neutrons are sensitive to strong absorbers such as Fe, Ti, N, Cl, Gd, and Sm.
Close proximity to the planetary body is needed to measure neutrons and gamma rays because their production rate is relatively low in comparison, for example, to reflected sunlight. In addition, sensors used for gamma ray and neutron spectroscopy are generally insensitive to incident direction. Consequently,spatial resolution depends on orbital altitude, and higher resolution can be achieved by moving closer to the planet. Regional scale measurements are generally made using nuclear spectroscopy, in contrast to the meter to kilometer scale generally achieved by reflectance- and thermal emission-spectroscopy.
RADIATION SENSORS
GRaND uses scintillator- and semiconductor-based radiation sensors to detect neutrons and gamma rays as well as energetic particles from the space environment. A scintillator is a transparent material that converts the kinetic energy of charged particles (such as electrons produced by gamma ray interactions or alpha particles and recoil protons produced by neutron reactions) into flashes of light detectable by a photomultiplier tube or photodiode. Semiconductors can be used to detect gamma rays. Swift electrons produced by Compton and photoelectric interactions ionize the semi conductor, producing electron-hole pairs. The electrons and holes drift under the influence of an applied electric field to electrical contacts. As they drift, the electrons and holes induce charge on the contacts, which can be measured by a charge-sensitive preamplifier. The amplitude of the charge pulse is proportional to the energy deposited by the gamma ray, which enables semiconductors to be used for spectroscopy.
The sensors and shielding/structural materials of GRaND were arranged to distinguish gamma rays and neutrons originating from the target body from those from background sources, including neutrons and gamma rays produced by cosmic rays in the bulk spacecraft, and energetic particle interactions with the instrument. The sensors on GRaND were designed to operate between -20° C and 30° C and do not require active cooling.
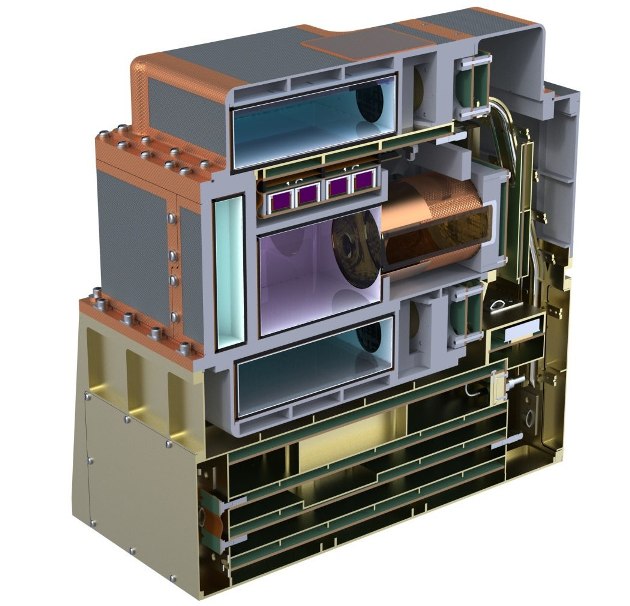
GRaND uses four types of radiation sensors, which are shown in the cutaway diagram of the instrument in Figure 1. The approximate energy range and pulse height resolution for the sensors is given in Fig. 5. A brief description of each sensor follows:
1. Bismuth germinate (BGO) scintillator: A 7.6 (X)cm x 7.6(Y)cm x 5.08 (Z) cm BGO crystal (approximately 300 cm3 volume) is located in the center of the scintillator subassembly. The scintillator is coupled to a 5.08 cm diameter photomultiplier tube. BGO has high density and high atomic number and is sensitive to gamma rays over a wide energy range(up to 10 MeV). The pulse height resolution at room temperature is approximately 10% full-width-at-half- maximum (FWHM) at 662 keV.
2. Cadmium Zinc Telluride (CZT) semiconductor: A planar array of 4 x 4 CZT crystals is positioned on the +Z side of the BGO crystal (Figure 1), which faces towards the asteroid during science mapping. Each crystal is 10 mm x 10 mm x 7 mm. Consequently, the array has a sensitive volume of 11.2 cm3. Coplanar grids are used to mitigate the effects of hole trapping, resulting in excellent peak shape and pulse height resolution over a wide range of energies. The pulse height resolution was better than 3% FWHM at 662 keV during laboratory testing. The array was designed to measure gamma rays with energies up to3 MeV. The relatively high energy resolution of the CZT array enables accurate measurement of gamma rays in the densely-populated, low energy region of the spectrum, which contains gamma rays from radioactive decay and cosmic-ray induced reactions within the surface of the asteroid
3. B-loaded plastic scintillator: Two L-shaped boron-loaded plastic (BLP) scintillators (each 193 cm 3) are located on the -Y and +Y sides, surrounding the sides of the BGO crystal and CZT array. The scintillators act as an anticoincidence shield to reject cosmic ray interactions. In addition, the scintillators are sensitive to neutrons. Fast neutrons (with energies greater than 700 keV) can undergo elastic scattering with H within the plastic to produce knock-on protons, which ionize the scintillator, resulting in the production of detectable light. In addition, thermal and epithermal neutrons can be captured via the 10B(n,α)7Li* reaction to produce 93 keVeelight output. Note that the subscript "ee" indicates an electron-equivalent energy, corresponding to the energy a swift electron would need in order to produce the same light output as the reaction products. The reaction product,7Li*, produces a 478 keV prompt gamma ray. Fast neutrons with energies greater than 700 keV produce a characteristic double pulse signature, corresponding to light output from fast-neutron proton recoils followed later by neutron capture with 10B after the neutron has thermalized. The amplitude of the first pulse is related to the energy of the incident neutron. Thermal and epithermal neutrons also produce a unique coincidence signature, corresponding to 93 keVee of light produced in the plastic in coincidence with 478 keV deposited in the BGO crystal.
4. Li-glass, B-loaded-plastic phosphor sandwich (phoswich): Two BLP scintillators are located on the nadir (+Z) and spacecraft (-Z)sides of the instrument, centered on the CZT array and BGO crystal. Each BLP scintillator is approximately 10.16 cm x 10.16 cm x 2.54 cm (264 cm 3) and is read out by a 2.54 cm diameter phototube. With the exception of the outward- facing side, each scintillator is covered with a sheet of Gd foil, which absorbs thermal neutrons. The outward facing side is covered by a plate of lithiated glass, 0.2 cm thick. The lithiated glass is optically-coupled to the BLP such that the phototube measures light produced in both the glass and the plastic. 6 Li is a strong thermal neutron absorber. Consequently, the BLP is shielded from thermal neutrons. Epithermal neutrons that undergo capture via the 10B(n,α) reaction in the BLP produce 93 keVee. Thermal and epithermal neutrons can undergo neutron capture via the 6Li(n,t) reaction, which produces approximately 340 keVee, and is seen as a separate peak in the pulse height spectrum. Consequently, the thermal neutron signature can be determined by the weighted difference between the counting rates observed for the two reactions. Fast neutrons are measured using the double pulse signature in the BLP. In addition, the (n,γ) BLP- BGO coincidence signature provides a low-background measurement of epithermal neutrons.
TABLE 1 Approximate energy range and pulse height resolution of GRaND sensors at nominal high voltage settings.
-------------------------------------------------------------------------------
|           | ADC   | Energy     | keV per | Energy      |                    |
|Sensor     |bits[1]| range(MeV) | channel | resolution  | Threshold          |
|-----------------------------------------------------------------------------|
|+/-Z phos. |  8    | 0 to 2.55  |   10    |20%[2]/40%[3]| 20 keV[4]/50 keV[5]|
|+/-Y BLP   |  8    | 0 to 2.55  |   10    |   40%[3]    | 20 keV[4]/50 keV[5]|
|BGO        | 10    | 0 to 10    |   10    |   10.5%[6]  | 300 keV            |
|CZT        | 11    | 0 to 4     |    2    |    3%[6]    | 300 keV            |
-------------------------------------------------------------------------------
[1] 12-bit ADCs are used for all sensors. The maximum number of
high-order bits used is given.
[2] Percentage full width at half maximum (FWHM) of the 340
keVee 6Li(n,t)4He reaction peak.
[3] Percentage FWHM of the 93 keVee
10B(n,α)7Li reaction peak.
[4] Prompt threshold;
[5] delayed threshold (second interaction fast neutrons).
[6] Percentage FWHM at 662 keV (gamma rays from a 137Cs source). Note
that the pulse height resolution of the CZT sensors has gradually degraded
in flight from the quoted value due to radiation damage.
ELECTRONICS
An electronics block diagram of GRaND is shown in Figure 2. GRaND derives power from the S/C 28Vdc power bus. The instrument low voltage power supply provides +/-5V to all the digital and analog circuits and +12V to all high voltage power sources, which supply 0to +1500V to the photomultiplier tubes and - 1500V/+70V to the CZT sensors. The instrument transmits and receives data through an RS-422 interface. The instrument is controlled by a UTMC micro- controller, which manages instrument subsystems, processes commands, monitors state of health (SOH), and processes the science data. Each of the radiation sensors is readout by analog front-end electronics, which provides shaped pulses, which are digitized by analog-to-digital-converters (ADC) to determine pulse amplitude, and timing signals for analysis of coincident events. Signals from the FEE are processed by an Actel field-programmable-gate-array (FPGA). The FPGA categorizes signals from the sensors, identifying patterns that correspond to important events (for example, the fast neutron double-pulse signature). SOH data are recorded in the engineering telemetry, including high voltage values and temperatures. Commandable parameters include instrument high voltage settings, parameters used to classify coincidence events, and measurement intervals.
OPERATIONAL MODES
GRaND has three operational modes:1) STANDBY; 2)NORMAL; and ANNEAL. The instrument starts in STANDBY mode. In STANDBY mode, the low voltage is on and all radiation sensors are off (all commands are accepted except high voltage enable commands). Only SOH data are generated in stand by mode. Data from the temperature sensors are recorded in STANDBY if the +/-5V low voltage supply is activated. From STANDBY, the instrument can be commanded to NORMAL mode. In NORMAL mode, the instrument can be configured for science data acquisition, including enabling and setting the high voltage level for each sensor. In NORMAL mode, both SOH and science data are included in the telemetry. From STANDBY, the instrument can also be commanded to ANNEAL mode, which is designed to anneal radiation damage accrued by the CZT crystals (Prettyman, et al., 2003). Only SOH data are generated in ANNEAL mode.
EVENT CATEGORIES
Each science record sent by GRaND contains counting data acquired during a collection interval, which is set by the commandable parameter TELREADOUT. The collection intervals are successive, forming a time series that can be analyzed to map elemental abundances. The records are time-tagged with the spacecraft clock (SCLK) value, which can be merged with NAIF/SPICE ephemeris data for mapping. Each science record includes scaler data, event data, and histograms. The pattern of pulses recorded by the sensors for each radiation interaction is processed by the FPGA, which categorizes the events. The events are scaled and binned into histograms. In addition, a subset of neutron and gamma ray events are recorded in a fixed length buffer. At the end of each collection interval, the data are compressed, packetized, and transmitted. The event categories recorded by GRaND are as follows (Note that event categories 3, 5, 6, and 8 were deleted during instrument development):
Category 1 (CAT1): A single pulse from the -Z or +Z phoswich. CAT1 data are binned into a histogram (256 channels) which can be analyzed to determine the areas of peaks corresponding to the 93keVee10B(n,α) and the 340 keVee6Li(n,t) reactions.
Category 2 (CAT2): A prompt coincidence between the BGO and any one of the four BLP scintillators. The objective is to record thermal and epithermal neutron interactions by detecting the prompt coincidence between the deposition of 93 keVee by the 10B(n,α)7Li* reaction products in the BLP and full energy deposition of the associated gamma ray from7Li* → 7Li+γ, where 7Li*denotes the first excited level of7Li in the BLP scintillator. If a coincidence is detected, the FPGA checks to see if the pulse height recorded by the BGO is within a commandable coincidence window, set to bracket the 478 keV full energy peak. If so, then the pulse recorded by the BLP is binned in a 64- channel histogram that contains the 93 keVee reaction peak. Redundantly, the FPGA also checks to see if the pulse height recorded by the BLP is within a commandable coincidence window set to bracket the 93 keVee peak. If so, then the pulse recorded by the BGO is binned in a 64-channel histogram that contains the 478 keV full energy peak. Consequently, two 64-channel spectra are recorded for each BLP. Since the +/-Z BLP scintillators are shielded by Gd and Li-glass, the areas of the 93 keVee and 478keV peaks in the 64-channel histograms recorded by the CAT2 process for these two scintillators are sensitive to epithermal neutrons. The CAT2 signature for the side scintillators, which are unshielded, is sensitive to both thermal and epithermal neutrons.
Category 4 (CAT4): A double-pulse occurring in any one of the phoswich or BLP scintillators. To reduce after-pulsing, events for which the second events occur within 400 ns are rejected. The maximum time to the second pulse (TTSP) recorded by GRaND is 25.6 microseconds. The amplitudes of the first and second pulse and the TTSP are recorded as list mode data in a fixed length buffer. The total number of CAT4 events processed by the FPGA during the collection interval is recorded in the scaler data. The CAT4 data can be analyzed to determine the flux and energy distribution of fast neutrons.
Category 7 (Cat7): A coincidence between a single CZT sensor and the BGO scintillator. The CZT pulse height (digitized by a 12-bit ADC) and CZT- sensor-ID are recorded as event data in the gamma event buffer. The BGO pulse height is recorded as a 9 bit unsigned integer. The portion of the gamma event buffer reserved for CAT7 events is commandable. The CAT7 data can be used to discriminate gamma rays originating from the target body and the spacecraft. For example, gamma rays originating from the target body (from nadir) can under go low angle Compton scattering in a CZT sensor prior to entering the BGO crystal, where they may deposit the rest of their energy. The energy of the gamma ray can be determined by summing the pulse heights measured by the CZT and BGO sensors. Gamma rays originating from the spacecraft are shielded from the CZT array by the BGO crystal. In addition, those originating from the spacecraft that interact with a CZT sensor must scatter through a large angle, depositing a relatively large amount of energy in the CZT sensor before reaching the BGO crystal. Consequently, summing the energy deposited in the CZT and BGO sensors for events in which the energy deposited in the BGO sensor is greater than the energy deposited in the CZT sensor tends to reject gamma rays originating from the spacecraft.
Category 9 (CAT9): A single pulse from the BGO scintillator. The CAT9 events are recorded as a 1024 channel pulse height spectrum.
Category 10 (CAT10): A single interaction with a CZT sensor. The pulse height (digitized by a 12 bit ADC) and CZT-sensor-ID are recorded as event data in a fixed length buffer. The total number of CAT10 events processed by the FPGA during the collection interval is recorded in the scaler data. The CAT9 list mode data can be processed, given the known energy calibration for each of the sensors, to form a composite pulse height spectrum. During mapping, the CAT9 histogram and CAT10 composite spectrum contain full energy peaks corresponding to radioactive decay and nuclear reactions occurring within the planetary surface, which can be analyzed to determine elemental abundances.
SCALERS
In addition to pulse height spectra and event data, GRaND has 19 scalers that count the number of events recorded by the FPGA for selected interaction types. The scalers are defined in Table 2. The scaler data provide additional information needed to analyze the histograms and event data, including the dead time. A scaler for events occurring in coincidence with three or more sensors (BGO and multiple BLP/phoswich) can be used as a galactic cosmic ray monitor.
TABLE 2 Description of scalers
--------------------------------------------------------------------------------
Index    Name             Description
--------------------------------------------------------------------------------
 0       D0             Dead time counts
 1       OBGO           BGO overload events
 2       OCZT           CZT overload events
 3       O+Z            +Z phoswich overload events
 4       O-Y            -Y BLP overload events
 5       O+Y            +Y BLP overload events
 6       O-Z            -Z phoswich overload events
 7       C+Z            +Z phoswich CAT4 events
 8       C-Y            -Y BLP CAT4 events
 9       C+Y            +Y BLP CAT4 events
10       C-Z            -Z phoswich CAT4 events
11       CESI           Early second interaction events
12       CMC            Multiple-crystal CZT events
13       C10            Valid CZT events (CAT10)
14       C7             Coincidence BGO and CZT events (CAT7)
15       CMS            Coincidence of three or more sensor elements
16       T              Total events processed by GRaND
17       N10            Number of single CZT events (CAT10) in the
                        gamma ray event buffer
18       N7             Number of BGO-CZT coincidence events (CAT7) in
                        the gamma ray event buffer
19       NNE            Number of events (CAT4) in the neutron event
                        buffer
20       MG             Total number of events allowed in the gamma
                        ray event buffer
21       M10            Number of single CZT events (CAT10) allowed
                        in the gamma ray event buffer
22       MNE            Number of events allowed in the neutron event
                        buffer
--------------------------------------------------------------------------------
Note that indices 0 through 19 are for 16-bit counters, which are reset at the end of every science accumulation interval specified by TELREADOUT. If the state-of-health accumulation interval is adjusted to subsample the science accumulation interval (for example, TELREADOUT = n * TELSOH, where n is a whole number), then the scalers will monotonically increase during each acquisition interval, unless overflow occurs. A rollover counter is not provided; however, for situations in which the counting rate is high or the accumulation intervals are large, the number of rollovers for individual scalers can be determined from the SOH scaler data if TELSOH is selected to subsample the science accumulation interval so that the roll-over events can be directly observed. In situations where the counting rate is changing, abrupt changes in the science scaler values can also indicate that rollover has occurred. Rollover is treated in production of the Level1b RDR data.
Indices 20 through 21 are maximum values for the number of events that can be recorded in the event buffers. The number of gamma ray and neutron events is commandable and can be adjusted subject to constraints imposed by the overall spacecraft telemetry allocation. The total number of gamma ray and neutron events must be less than or equal to 6676.
TELEMETRY, DATA VOLUME, AND TIME
The telemetry for GRaND consists of science and state-of-health data that are accumulated over commandable time intervals. Each science data record includes scalers, histograms, and event data accumulated over an interval specified by the commandable parameter TELREADOUT (s). The state of health data include average temperatures, voltages, and instrument state data acquired during time intervals specified by the commandable parameter TELSOH (s). Both intervals are adjustable, depending on the measurement conditions and objectives for each mission phase. During mapping, TELREADOUT will be set to sub-sample spatial pixels defined on the surface of Vesta or Ceres. During cruise, TELREADOUT was generally set to large values (e.g., 210s) to minimize data volume. TELSOH is generally set to subsample the science accumulation interval, providing information needed to determine whether and how many times the science scalers have rolled over and information needed to precisely determine the start time of the science acquisition interval.
The SOH and science data are stored in separate virtual recorders, VR3 and VR5, respectively. Prior to Mars Gravity Assist (MGA), the SOH data stored in VR3 were decimated. Consequently, the playback data from VR3 contain every third SOH packet. Real time data obtained while the spacecraft was in communication with a ground station are not decimated. Most of the data acquired during Initial Check Out (ICO) were in real time; however, only limited real time data are available afterwards. Prior to MGA, the decimation was removed and the playback data from VR3 contains a complete set of SOH data.
The telemetry rate for GRaND is determined by the selection of TELSOH and TELREADOUT. The SOH data are transmitted every TELSOH seconds in a single packet, 250 bytes in length. The science data are transmitted every TELREADOUT seconds in 23 packets containing a total of 22574 bytes, including packet headers and science data(see Table 3) Thus, the total telemetry rate is given by 8*(250/TELSOH+22574/TELREADOUT) bits per second, assuming no decimation of the SOH packets. For example, a typical telemetry rate for cruise (TELSOH=35 and TELREADOUT=210)was 917 bits per second. For Mars Closest Approach (TELSOH=35 and TELREADOUT=35), the telemetry rate was 5217 bits per second. These values for TELREADOUT and TELSOH will likely be used during LAMO at Vesta and Ceres. For quiet Sun conditions, the selection of TELREADOUT=35s does not result in rollover of the dead time scaler. Consequently, sub-sampling of the science accumulation interval won't be required in LAMO.
Each science data packet is tagged with a SCLK value, which is derived from a time stamp command, which is sent by the S/C every 60s. The SCLK value stored in each science packet has a resolution of 1s and is updated at the time of transmission by the number of pulses from the S/C 1pps signal since the last time stamp. The 1pps signal has a dedicated line on the RS 422 interface and is monitored by the FPGA. GRaND's 1pps counter is reset only by the receipt of a time stamp command. So, the transmitted SCLK value is accurate to within 1s.
If the cadence of the science and SOH data is such that an SOH packet is sent during the transmission of science data, then the register in which the time stored is overwritten by the SCLK value from the last time stamp command. This results in "SCLK regression," for which science packets arranged by order of receipt by the ground station (or by packet sequence counter) are not ordered in time. SCLK regression results in the undesirable fragmentation of files in the Ground Data System.
The amount of time needed to transmit the science data at the end of each accumulation interval is 12s. So, to avoid SCLK regression, the SOH data need to be written at least 12s after the end of each science accumulation interval. This is accomplished by making TELREADOUT a multiple of TELSOH and starting the first SOH interval no more than TELSOH-12s before the start of the first science interval. Application of this procedure during flight was effective in eliminating instances of SCLK regression (for example, see Tables 2-4 for instances of SCLK regression).
GRaND uses two memory locations to store science data such that data for the next accumulation interval can be acquired while data from the previous interval are being transmitted. Thus, TELREADOUT is an accurate measure of the accumulation time. The dead time is recorded in the scaler data and is used to determine live time as discussed in the section on Level1b processing.
TABLE 3
List of data contained in each science record. Note that while 24 scalars are listed, one of these is not used. Bits unaccounted for in this table include the packet headers for each of the 23 packets (14 bytes each) in the record and an additional 128 bytes that are not used. Note that all of the histograms were accumulated using 16-bit registers and were compressed to 8 bits/channel using the algorithm described by Feldman et al. (2004).
--------------------------------------------------------------------------
|Data type                       |  Number  |          |  Bits/  | Total |
|(event category)                | of items | Channels | channel | bytes |
|------------------------------------------------------------------------|
|Scalars                         |     24   |      1   |    16   |    48 |
|--------------------------------|----------|----------|---------|-------|
|Gamma ray and neutron event     |          |          |         |       |
|buffers (CAT4, 7, 10)           |   6676   |      3   |     8   | 20028 |
|--------------------------------|----------|----------|---------|-------|
|BGO histogram (CAT9)            |      1   |   1024   |     8   |  1024 |
|--------------------------------|----------|----------|---------|-------|
|+/-Z phoswich histograms (CAT1) |      2   |    256   |     8   |   512 |
|------------------------------------------------------------------------|
|                        BGO-BLP coincidence (CAT2)                      |
|------------------------------------------------------------------------|
|BGO histograms                  |      4   |     64   |     8   |   256 |
|--------------------------------|----------|----------|---------|-------|
|+/-Z phoswich histogram         |      2   |     64   |     8   |   128 |
|--------------------------------|----------|----------|---------|-------|
|+/-Y BLP histogram              |      2   |     64   |     8   |   128 |
|------------------------------------------------------------------------|
|                                                  Total bytes   | 22124 |
--------------------------------------------------------------------------
OPERATIONAL CONSIDERATIONS
Science data will be acquired by GRaND during cruise, Mars Flyby, and mapping of Vesta and Ceres. In order to acquire science data, GRaND must be in NORMAL mode with high voltages turned on and adjusted to nominal settings. Large gaps in the data are expected during cruise, when the instrument is off. For science mapping in low altitude mapping orbit, data are primarily acquired while the instrument bore-sight is pointed to within 5° of body center; however, data acquired while the instrument is not pointed at body center can also be analyzed and will be included in the time series counting data delivered to PDS. Solar energetic particle events will be flagged or removed from the Level1b datasets. Contamination from other instruments and spacecraft subsystems appears to be negligible, but will be evaluated throughout the mission. For example, operation of the ion propulsion system appears to have a slight affect on the counting rates measured by GRaND (see the DC034 Activity Report included in this archive).
GRaND has a watchdog process that monitors the receipt of time stamp commands from the spacecraft. If three time stamps are dropped in a row, then GRaND will gracefully ramp down the high voltages on the sensors and transition to STANDBY mode. Due to the selection of the microcontroller, which uses a single character universal asynchronous receiver/transmitter (UART), and the design of the flight software, receipt of a command while the microcontroller is busy preparing data for transmission can result in the loss of the command accompanied by communications errors. For example, if TELREADOUT is selected to be 60s, then it is possible that three dropped time stamps can occur in a row, resulting in an unplanned transition to STANDBY and the loss of subsequent science data or the interruption of commanding to configure the instrument for science data acquisition. The latter is avoided by setting TELREADOUT to 2000s (along time) during commanding to configure GRaND parameters and high voltages.
Since it is not possible to know the relative timing of the time stamp commands from the spacecraft and the accumulation intervals, the following strategy is taken to command GRaND to avoid unexpected transitions to STANDBY and to eliminate instances of SCLK regression:
A parametric study was carried out successfully during Mars Gravity Assist, in which the following combinations were tested:
    TELSOH   WAIT   TELREADOUT
      32     20     64
      32     1      64
      35     20     70
      70     57     70
      35     20     35
      35     23     35
      70     57     210
      32     17     192
Other operational considerations beyond the selection of accumulation intervals described in this document include:
    1. Annealing of the CZT array prior to Vesta encounter to remove radiation
       damage accrued during flight;
    2. Optimization of the CAT2 coincidence windows to be carried out during
       Mars-Vesta cruise.
    3. Optimization of sensor high voltages (particularly CAT1) to maximize
       signal to background.
DATA OVERVIEW AND SCOPE
Calibration data for GRaND were acquired during assembly, test, and launch operations (ATLO), before and after delivery of the instrument for integration with the spacecraft. Prior to delivery, the instrument was characterized at a calibration facility at Los Alamos National Laboratory and on the bench using neutron and gamma ray sources. The main goals of the calibration exercise were to verify the functionality of each of the sensors; determine the energy calibration for each sensor and event category; determine the absolute calibration (relationship between flux and counting rate) for each sensor and event category as a function of incident energy and direction.
Data acquired during comprehensive performance tests (CPTs) following integration of GRaND with the spacecraft provide supplemental information needed to confirm the energy calibration.
Following launch, GRaND was operated during Earth-Mars and Mars-Vesta cruise to measure the response to galactic cosmic rays and energetic particles in the space environment. The data are needed in order to characterize background sources (for example, neutron production by cosmic ray interactions with the bulk spacecraft) as a function of heliocentric distance.
In addition, GRaND acquired data during Mars Closest Approach (MCA), which was compared directly to data acquired by 2001 Mars Odyssey, enabling cross calibration of GRaND during flight.
Selected calibration files will be archived along with the results of modeling. Analysis of calibration data is ongoing and will be subject to change as models of the instrument response are developed and improved. The energy calibration is dependent on high voltage settings and temperature,which are subject to change. During flight, common gamma ray and neutron spectral features are used to determine calibration parameters used in Level1b processing.
The scope of this document is limited to Level1 processing of data acquired during the flight phases of the mission through Mars Gravity Assist. A summary of the raw data acquired is provided in LEVEL1A Processing.
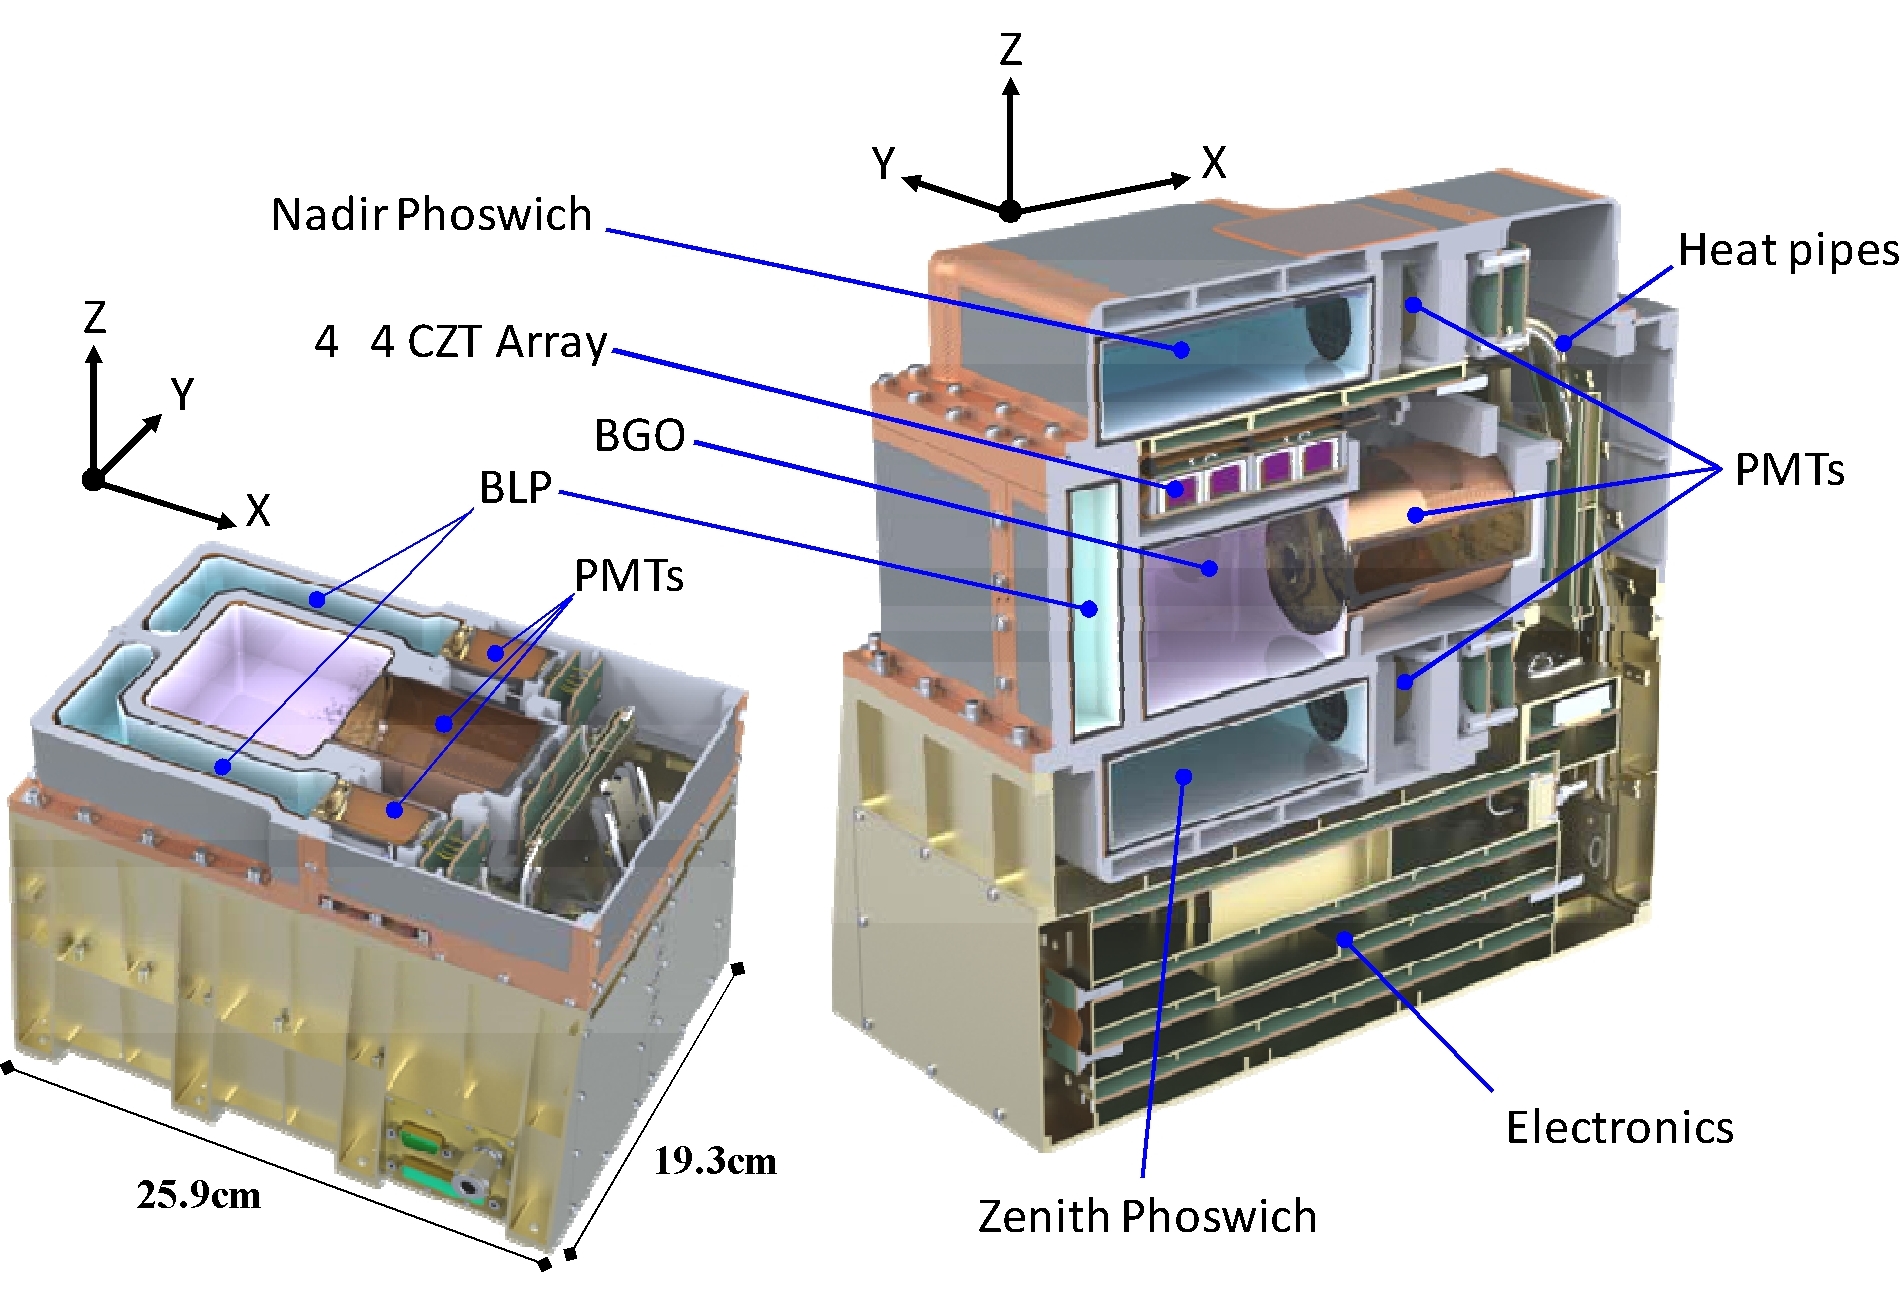
FIGURE 1. CUTAWAY VIEWS OF GRAND
Cutaway views of GRaND show the placement of subsystems and components (an XY
cut is shown left and a XZ cut is shown right). The coordinate system for GRaND
is the same as that of the spacecraft. GRaND is mounted on the (+X,+Y) corner of
the +Z deck of the spacecraft. During mapping at Vesta and Ceres, the body
center is in the +Z direction. The instrument coordinate system determines the
naming convention of the sensors and orientation of the instrument relative to
the spacecraft. The use of MZ indicates a sensor on the -Z (spacecraft-facing
during mapping) side of GRaND; PZ indicates the sensor is on the +Z (asteroid)
side; MY indicates the sensor is on the -Y side (inboard) side of the
instrument; and PY indicates the sensor is on the +Y side (outboard, towards the
+Y solar panel) side of the instrument. The phototube assembly, labeled 'PMTs'
in the figure, points along the +X axis (towards the high gain antenna). Artwork
courtesey S. Storms of Los Alamos National Laboratory.

FIGURE 2. INSTRUMENT ELECTRONICS BLOCK DIAGRAM
LEVEL1A PROCESSING
The GRaND EDR are a time-ordered collection of gamma ray and neutron counting data and histograms acquired by GRaND during different phases of the Dawn Mission, including assembly-test-and-launch-operations (ATLO), cruise, Mars Gravity Assist (MGA), and science mapping at 4-Vesta and 1-Ceres. The dataset also includes state-of-health data (instrument settings, temperature and voltage readings)needed for scientific analysis of the neutron and gamma ray data. The EDR is an intermediate data product (Level 1a) that is derived from Raw Data Records (Level 0) using reversible operations. The Level 1a data are the lowest level of GRaND data archived in the PDS, from which all higher order data sets are derived. To support timely delivery of higher order products, the Level1a data are processed using an automated pipleline, which operates on Level 0 data when it is queried by the DSC.
The data set consists primarily of ASCII tables, divided into three functional categories: auxilliary information (AUX); gamma ray spectra and event data (GAMMA); and neutron spectra and event data (NEUTRON). Gamma ray and neutron event data are recorded in binary files. Some of the data in the ASCII files, which are human-readable, are repeated in the binary files to aid in the verification of user-written routines.
The data are downloaded regularly from the spacecraft by the Ground Data System. The UCLA Dawn Science Center (DSC) captures all of the payload instrument telemetry frames as binary files after the data have been cleaned up in post- pass processing to produce reconstructed Level-0 data. The files are inventoried within the Dawn Science Database (DSDb) and are retrieved by the GRaND team, which unscrambles, decompresses, decodes, and formats the raw telemetry data into scientifically useful data files. The decompressed and decoded data, along with their required PDS documentation, form the Level 1a EDR datasets. The Level 1a EDR data are determined by performing reversible operations on the Level 1a data set, to produce counting data and spectral products useful for mapping.
PROCESSING
The Level 1A data are automatically processed by a pipeline, which operates on files queried by the DSC over selected time intervals. Each DSC query separates the GRaND data into files containing state-of-health and science data records in the order in which they were received on the ground and with corrupted packets removed. The state-of-health data are further divided into real time telemetry data and playback data. The science data are stored in a single raw data file.
The pipeline merges the state-of-health data from the playback and realtime files to produce a time ordered-list of records. Selected data are extracted to produce the Level 1A AUX files. Internal temperature readings are converted from data numbers (DN) to engineering units using a linear function determined during ground calibration: T (degrees C) = 0.4354 DN -32.267. The high voltage readings for the high voltage power supplies are reported in engineering units using the conversion V (Volts) =1500 DN/255. The CZT differential bias voltage is converted using V (Volts) = 0.405 DN.
The science data are decompressed, decoded, separated by functionality and written as time-ordered ASCII tables and binary time series. The raw histograms (CAT1, CAT2, and CAT9) are represented as compressed, 8 bit numbers in the telemetry and are decompressed and reported as 16 bit, unsigned integers.
The gamma ray event buffer can store up to 3876 events for each science accumulation interval. Each event is packed into 3 bytes, which contain the ID of the CZT sensor, the CZT pulse amplitude, and the BGO pulse amplitude. The vales for each event are extracted and stored as a binary time series. When the gamma ray event buffer is not full, null events are reported as zeros, such that each row of the Level 1A time series contains 3876 events.
The neutron event buffer can record up to 2800 events for each science data accumulation interval. Each event is packed into 3 bytes, which contain the BLP sensor ID and pulse amplitude for the first interaction, the BLP sensor ID and pulse amplitude for the second interaction, and the time between pulses. The time between pulses has units of 100 nanoseconds/DN. The vales for each event are extracted and stored as a binary time series. The pulse amplitudes are uncalibrated for Level 1A. When the gamma ray event buffer is not full, null events are reported as zeros, such that each row of the Level 1a time series contains 2800 events.
ANCILLIARY DATA
The Level 1A data include ancilliary data in the form of SCET UTC strings reported in each row of the Level 1A data tables and time series. The UTC strings are determined from the spacecraft clock ticks recorded in each state- of-health packet and for the first packet in each science data record using NAIF SPICE (leap seconds kernel). This information is used in Level 1b processing to accurately determine the mid-point of each science accumulation interval, which is needed for mapping.
SUMMARY OF PROCESSED DATA
Data acquired during flight that were processed to Level1a are summarized in Tables 4-7. The Level 0 data are identified by the name of the directory created by the DSC query. Each Level 0 directory is associated with Level1a data files as described in the data set catalog. The UTC start and end times are given in the tables along with the number of science data records included in the raw data file. Instances of SCLK regression, which are of interest to the ground data system, are also identified. Note SCLK regression is absent from all but the first MCA file (Table 4) due to the implementation of rules on the timing of the SOH and science accumulation intervals.
The instrument state, which is also summarized in the tables, provides a record of key instrument settings. Details on instrument settings can be found in the Level1a state (-STA) files (see the data set catalog and format files). GRaND is powered on and configured using command sequences that are uploaded and executed on the spacecraft. In addition, command sequences were used to systematically adjust TELREADOUT and TELSOH for the SCLK regression test during MGA.
Following configuration, adjustment of parameters can be carried out using a non-interactive payload command (NIPC) procedure. The NIPC process enables the GRaND team to request timely adjustments in the instrument parameters, such as coincidence windows and high voltages, which do not consume spacecraft resources (e.g. power consumption, data storage, and telemetry). Because TELREADOUT and TELSOH influence the data rate, adjustments were excluded from the NIPC process. The NIPC process was tested during EMC (Table 3). In addition, NIPC was used to increase the high voltage of the -Z phoswich during MGA (Table4).
Throughout flight, GRaND's performance was steady (e.g., for sensor high voltages, gains, instrument internal and interface temperatures). Unanticipated events included the safing of the spacecraft following MCA and GRaND's transition to STANDBY during MGA following the NIPC to adjust high voltage. GRaND data stored in the instrument's virtual recorders during MCA were downloaded during safe mode recovery, providing useful scientific data for instrument calibration and mission planning. The transition to STANDBY, which marks the end of MGA for GRaND, was found to be caused by three successive dropped time stamp commands resulting from the timing of the NIPC relative to the time stamps. Modifications to the NIPC procedure to reduce the possibility of unexpected transitions to STANDBY are being evaluated and will be implemented prior to Vesta operations.
TABLE 4
Summary of Level 0 data and instrument operations during Initial Checkout
(ICO). The number of science records (NSR) processed and the number of
instances of SCLK regression (SCR) of science data packets is provided.
--------------------------------------------------------------------------------
Level 0          Science UTC
PB directory     Begin/End             NSR/SCR     Instrument state
--------------------------------------------------------------------------------
07289_grdfunc\   2007-10-16T17:36:42   303/228     Power on and high voltage
                 2007-10-17T00:41:54               ramp-up (real-time
                                                   commanding); configure for
                                                   cruise data acquisition.

07290_grd\       2007-10-17T02:30:24   1196/949    TELREADOUT=70s
                 2007-10-18T01:46:54               TELSOH=10s

07291_grd\       2007-10-18T01:48:04   1199/950    TELREADOUT=70s
                 2007-10-19T01:06:54               TELSOH=10s

07292_grd\       2007-10-19T01:08:04   1109/880    TELREADOUT=70s
                 2007-10-19T22:43:04               TELSOH=10s

07293_grd\       2007-10-19T22:45:24   1321/1048   TELREADOUT=70s TELSOH=10s
                 2007-10-21T00:27:44

07294_grd\       2007-10-21T00:28:54   1222/969    TELREADOUT=70s
                 2007-10-22T00:15:44               TELSOH=10s

07295_grd\       2007-10-22T00:16:54   814/645     Instrument high voltage
                 2007-10-22T16:06:34               ramp-down and power off.
--------------------------------------------------------------------------------
TABLE 5
Summary of Level 0 data and instrument operations during Earth-Mars Cruise
(EMC). The number of science records (NSR) processed and the number of
instances of SCLK regression (SCR) of science data packets is provided.
--------------------------------------------------------------------------------
Level 0          Science UTC
PB directory     Begin/End             NSR/SCR     Instrument state
--------------------------------------------------------------------------------
emc_08092\       2008-04-01T02:41:09   46/39       Power on and high voltage
                 2008-04-01T04:55:04               ramp-up (sequenced);
                                                   configure for cruise data
                                                   acquisition.

emc_08093\       2008-04-01T04:58:24   361/301     TELREADOUT=200s
                 2008-04-02T00:58:24               TELSOH=10s

emc_08094\       2008-04-02T08:01:44   499/416     TELREADOUT=200s
                 2008-04-03T11:45:04               TELSOH=10s

emc_08096\       2008-04-03T11:48:24   1081/901    CAT2 coincidence window
                 2008-04-05T23:58:05               adjustment (NIPC).
                                                   TELREADOUT=200s
                                                   TELSOH=10s

emc_08098\       2008-04-06T00:01:25   801/536     TELREADOUT=200s
                 2008-04-07T20:34:45               TELSOH=10s

08102_grd\       2008-04-08T02:18:05   248/165     Instrument high voltage
                 2008-04-08T16:01:25               ramp-down and power off.
--------------------------------------------------------------------------------
TABLE 6
Sumary of Level 0 data and instrument operations during Mars Gravity Assist
(MGA). The number of science records (NSR) processed and the number of
instances of SCLK regression (SCR) of science data packets is provided.
--------------------------------------------------------------------------------
Level 0          Science UTC
PB directory     Begin/End             NSR/SCR     Instrument state
--------------------------------------------------------------------------------
09020_dawn\      2009-01-20T22:09:53   49/21       Power on and high voltage
                 2009-01-21T00:27:08               ramp-up (sequenced);
                                                   configure for data
                                                   acquisition during
                                                   Mars approach.

09022_dawn\      2009-01-21T00:30:38    540/0      TELREADOUT=210s
                 2009-01-22T07:57:08               TELSOH=35s

09026_dawn\      2009-01-22T08:00:38    1725/0     Includes a parametric study
                 2009-01-25T06:52:43               of TELREADOUT/TELSOH
                                                   (SCLK regression).

09029_dawn\      2009-01-25T06:59:43    1658/0     TELREADOUT=210s
                 2009-01-29T07:46:14               TELSOH=35s

09036_dawn\      2009-01-29T07:49:44    2873/0     TELREADOUT=210s
                 2009-02-05T07:35:44               TELSOH=35s

09043_dawn\      2009-02-05T07:39:14    2996/0     TELREADOUT=210s
                 2009-02-12T14:35:44               TELSOH=35s

09047_dawn\      2009-02-12T14:39:14    1651/0     TELREADOUT=210s
                 2009-02-16T15:12:38               TELSOH=35s
                                                   (Reduced the maximum number
                                                   of CAT10 events to 3376 to
                                                   allow up to 500 CAT7 events)

09048_dawn\      2009-02-16T15:16:08    819/0      Mars approach:
                 2009-02-17T21:22:40               TELREADOUT=70s
                                                   TELSOH=35s

09051_dawn\      2009-02-17T21:23:50    296/0      Mars closest approach (MCA):
                 2009-02-18T00:49:17               TELREADOUT=70s
                                                   TELSOH=35s
                                                   Instrument powered off prior
                                                   to S/C safe mode.

09065_dawn\      2009-03-02T15:43:55    1055/0     Power on and high voltage
                 2009-03-05T06:52:30               ramp-up (sequenced);
                                                   configure for cruise
                                                   data acquisition.

09071_dawn\      2009-03-05T06:56:00    2872/0     TELREADOUT=210s
                 2009-03-12T06:38:30               TELSOH=35s

09078_dawn\      2009-03-12T06:42:00    2881/0     TELREADOUT=210s
                 2009-03-19T06:56:00               TELSOH=35s

09085_dawn\      2009-03-19T07:03:00    3078/0     TELREADOUT=210s
                 2009-03-26T18:46:30               TELSOH=35s

09092_090_
dawn_merged\     2009-03-26T18:50:00    335/236    TELREADOUT=210s
                 2009-03-27T14:23:52               TELSOH=35s
                                                   Increased -Z phoswich HV by
                                                   5 DN (30V) via NIPC.
                                                   Instrument transitioned to
                                                   STANDBY in response to three
                                                   dropped time-stamps
--------------------------------------------------------------------------------
TABLE 7
Sumary of Level 0 data and instrument operations during Mars-Vesta
Cruise (MVC). The number of science records (NSR) processed and the
number of instances of SCLK regression (SCR) of science data packets
is provided.
--------------------------------------------------------------------------------
Level 0          Science UTC
PB directory     Begin/End              NSR/SCR    Instrument state
--------------------------------------------------------------------------------
09334\           2009-11-30T12:11:55    46/0       Power on and high
                 2009-11-30T14:28:50               voltage ramp-up;
                                                   configure for data
                                                   acquisition.

09337\           2009-11-30T14:32:20    1203/0     TELREADOUT=210s TELSOH=35s
                 2009-12-03T12:58:55               Parameter variations
                                                   (DC034 Activity Report,
                                                   in this archive)

09341\           2009-12-03T13:05:45    1557/0     TELREADOUT=210s TELSOH=35s
                 2009-12-07T07:58:45               Parameter variations
                                                   (DC034 Activity Report,
                                                   in this archive), HV
                                                   ramp-down and power off.

10235\           2010-07-19T18:41:55    2194/0     See the DC041 Activity
                 2010-07-25T21:06:51               report in this archive
                                                   - Power on and high
                                                     voltage ramp-up;
                                                     configure for data
                                                     acquisition.
                                                   - Acquire science data
                                                     for 22.5h (STATE=105)
                                                   - High voltage ramp down
                                                     and STANDBY mode for 1h
                                                   - Apply anneal heater
                                                     power for 1.5h
                                                   - Cool down for 17.5h in
                                                     STANDBY mode
                                                   - Ramp up high voltages and
                                                     configure for science
                                                     data acquisition
                                                   - Acquire science data for
                                                     101h (STATE=216)
                                                   - High voltage ramp-down
                                                     and power off
--------------------------------------------------------------------------------
The GRaND Reduced Data Records (RDR) are a time-ordered collection of corrected gamma ray and neutron counting data and calibrated pulse height spectra acquired by GRaND during Mars Gravity Assist (MGA) (Prettyman, 2010). Similar products will be developed for science mapping at 4-Vesta and 1-Ceres and for data acquired during cruise. The RDR is a calibrated data product (Level 1B) that is derived from Experimental Data Records (EDR, Level 1A). The objective of the RDR is to provide counting rates and ancillary pointing and ephemeris data needed for mapping. The ancillary data includes the sub-satellite point, the distance and direction to body center, and the spacecraft velocity vector at Mars, which is needed to account for the motion of low energy (thermal and epithermal) neutrons relative to the spacecraft. In the current version of the data set, counting rates and fluxes corrected for altitude and spacecraft motion, which require knowledge of the instrument response, are not provided; however, future versions of the RDR, especially for Vesta and Ceres mapping will include counting rates corrected for solid angle and pointing as well as incident gamma ray and neutron fluxes.
Processing steps for the RDR dataset include:
The data set consists of ASCII tables, divided by functionality into four categories: ephemeris and pointing data EPX (where X denotes the target:X='X' for cruise,X='M' for Mars, X='V' for Vesta, and X='C' for Ceres); neutron counting rates (NCR); gamma ray counting rates (GCR), and the BGO pulse height spectrum (BGO). The fast neutron flux spectrum(with units of neutrons/cm2/s/MeV), which can be unfolded from the fast neutron pulse height spectrum given the response function, and CZT composite spectrum will be included in future releases.
TIME BINNING
The Level1b data are represented as a time series in which counting rates and spectra are averaged over a time-window, consisting of an odd number of science accumulation intervals (TELREADOUT) selected by the evaluator. Note that ephemeris and pointing data are not averaged. Rather, their instantaneous values at the mid-point of each time window is reported. Two types of time series are possible: a central moving average(CMA), in which the averaging window is centered on each point in the original time series, and a result is reported for each science accumulation interval ( Figure 3); and a decimated time series (DTS), in which the averaging window is shifted forward in time by its width, resulting a data set that has fewer points than the original time series (Figure 4).
The CMA is intended for mapping, for example, in cases where full sampling of rapidly changing counting rates and solid angles is needed. The DTS is useful for averaging over long periods of time, for example, during cruise, when counting rates are not changing rapidly. By averaging over long time intervals, the DTS can be used to produce high precision gamma ray spectra needed for accurate peak identification, analysis, and calibration.
FIGURE 3. CMA TIME STRUCTURE.
    The CMA method provides a result for each science data record by averaging
    over records on either side of the current point as illustrated here:

         Science records       XXXXXXXXXXXXXXXXXXXXXXXXXXXXXXXXXXX

                                  | 1 |

                                   | 2 |

                                    | 3 |

                                     | 4 |

                                      | 5 |

                                            ....

    where each of the time-ordered science records is indicated by an X
    and the window boundaries are indicated by the vertical bars. The
    middle of each time series is labeled with an index (1, 2, ...).
FIGURE 4. DTS TIME STRUCTURE.
    The DTS method marches the window through the science data records,
    resulting in a decimated time series as follows:

     Science records          XXXXXXXXXXXXXXXXXXXXXXXXXXXXXXXXXXX

                              ...| 1 || 2 || 3 || 4 || 5 |...

    The number of science data records averaged for each point in the time
    series is given by WINDOW_WIDTH, which is an odd integer.
ANCILLIARY DATA
The Level 1B data include ancillary data in the form of SCET UTC strings reported in each row of the time series tables. The UTC strings are determined from the spacecraft clock ticks recorded in each state-of-health packet and for the first packet in each science data record using NAIF SPICE (leap seconds kernel). This information is used in Level 1B processing to accurately determine the midpoint of each science accumulation interval, which is used for mapping. In addition, pointing and ephemeris data are provided in the Level 1b file at the center of each time interval (Figure 5):
For MGA, the target was 'IAU_MARS'.
To first order, the flux of neutrons and gamma rays originating from Mars scales with the fractional solid angle. The fractional solid angle was determined from the spacecraft altitude assuming Mars was spherical in shape with a mean radius (R) of 3378 km. The fractional solid angle is given by:
![]()
The subsatellite longitude, latitude, and altitude were determined using the SPICE SUBPNT and RECPGR procedures. East longitude convention was used, with the prime meridian at 0°.
Of particular interest is the motion of GRaND relative to low energy, gravitationally-bound neutrons when the spacecraft is in close proximity to Mars. In order to determine the velocity and direction of a neutron incident on the instrument, the velocity of the spacecraft relative to Mars must be known in the instrument coordinate system. The direction to Mars center and motion of the spacecraft in the instrument coordinate system are determined by the following procedure:
    o   Get the state of the spacecraft given the ephemeris time (ET):

           cspice_spkezr, 'DAWN', et, 'MARSIAU', 'NONE', 'MARS', state, ltime

    o   Compute the rotation matrix from Mars to  the SC coordinate system

           cspice_pxform, 'MARSIAU', 'DAWN_SPACECRAFT', et, mat

    o   Determine the position of the center of Mars in the SC coordinate system:

           cspice_mxv, mat, state[0:2], mars center

    o   Rotate the SC velocity vector into the SC coordinate system:

           cspice_mxv, mat, state[3:5],vel_SC
For example, if the neutron velocity was known in the reference frame of Mars (e.g., vn-Mars as illustrated in Figure 5), then the following procedure could be used to determine the velocity of the neutron relative to the spacecraft:
    Rotate the neutron vector (vel_n_Mars) into the SC coordinate system:

        cspice_mxv, mat, vel_n_Mars, vel_n_SC

    Compute the relative velocity:

         vel_n_rel = vel_n_SC - vel_SC
The procedure for determining spacecraft velocity was tested using 2001 Mars Odyssey data, for which the spacecraft ID was 'M01' and the instrument was 'M01_GRS_NS'. The following results were obtained when the spacecraft was in a circular polar mapping orbit:
                                  marscenter                           vel_SC
        ET (s)         Px (km)      Py (km)    Pz (km)    Vx (km/s)   Vy (km/s)   Vz (km/s)
    284818666.184      3811.39       16.17      3.72       -0.04       3.35       -0.03
    284819666.184      3782.38      -10.77      3.84       -0.02       3.37       -0.04
    284820666.184      3764.26       -1.91      3.51       -0.00       3.38       -0.04
    284821666.184      3774.33       19.85      3.32        0.01       3.38       -0.04
    284822666.184      3802.95        0.60      3.86        0.03       3.36       -0.03
    284823666.184      3826.13      -14.78      4.30        0.03       3.33       -0.03
    284824666.184      3830.33       10.96      4.34       -0.02       3.32       -0.03
    284825666.184      3814.19       17.35      4.43       -0.04       3.34       -0.04
    284826666.184      3784.87       -9.15      4.59       -0.02       3.37       -0.04
    284827666.184      3763.87       -3.38      4.35       -0.01       3.38       -0.04
    284828666.184      3771.30       22.75      3.42        0.00       3.38       -0.04
    284829666.184      3800.23        8.10      3.49        0.02       3.36       -0.03
The resulting velocity vector is pointed along the instrument +Y axis, as expected.
Note: Algorithms to determine the velocity of a neutron at orbital altitude and the location of the surface emission site use rotation matrices determined from the ephemeris time. Future releases of the L1B data set could include the matrices in addition to the information already provided.
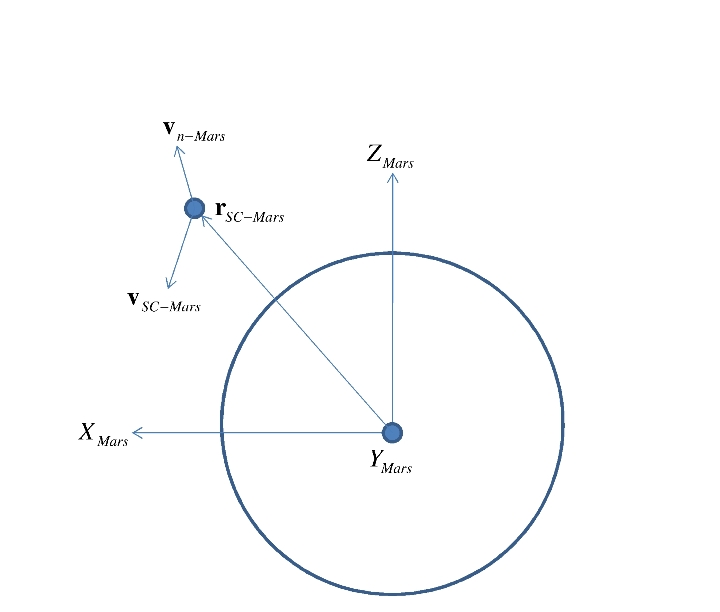
FIGURE 5. EPHEMERIS AND POINTING DIAGRAM FOR MARS GRAVITY ASSIST
SPECTRUM ANALYSIS
A variety of techniques are used to extract areas (counting rates) for spectral features, neutron-induced reaction peaks and gamma ray full energy peaks that appear in pulse height spectra measured by GRaND (the one-escape and two-escape peaks are not included in this version of the Level 1b data). The method of analysis is strongly dependent on the shape of the background continuum, the peak to continuum ratio, and whether the peak of interest is fully resolved. Methods used for GRaND spectrum analysis are summarized in Table 5. Peak areas recorded in the Level1b are always accompanied by propagated uncertainties (1- σ), which are dependent on the method used to determine peak area.
In many cases, the shape of the background continuum is assumed to be constant or to vary slowly with time. In such cases, the continuum shape is determined by fitting one of the background models listed in Table 8 to a central moving average (CMA) of pulse height spectra that includes a much larger number of points than the window used to produce the Level1b CMA or DTS data (Figure 6). In order to determine peak area, the background function determined by the broad CMA is adjusted in amplitude to match the counts in one or more regions-of- interest (ROIs) in the vicinity of the peak in the spectra that comprise the Level1b time series.
TABLE 8. SUMMARY OF METHODS TO DETERMINE PEAK AREA
--------------------------------------------------------------------------------
Method         Description
--------------------------------------------------------------------------------
GROSS               Sum of counts in a region of interest.

NET                 The net peak area is determined by subtracting the
                    background continuum from a region of interest (ROI)
                    containing the peak. The background within the peak ROI is
                    estimated from the counts in one or more nearby background
                    ROIs. The following methods use different approximations for
                    the shape of the continuum in the vicinity of the peak.

    LINEAR          This is the standard two ROI background subtraction routine
                    commonly used for gamma ray spectroscopy. The background
                    continuum is assumed to vary linearly with pulse height. The
                    net area is determined using two ROIs on either side of the
                    peak.

    EXPONENTIAL     The background function is assumed to be exponential with
                    pulse height and the coefficients are determined from one or
                    more adjacent ROIs.

    POWER-LAW       The functional form of the background continuum is a power
                    law and the coefficients are determined from one or more
                    adjacent ROIs. A log-log quadratic is also used
                    occasionally.

    EXPERIMENTAL    The shape of the background continuum is measured far from
                    the target body and is assumed to be constant with time. The
                    amplitude of the background function is adjusted to fit one
                    or more background continuum regions when the spacecraft is
                    near the target body.

GPA                 A detailed model of the full energy peak shape and
                    background are fitted to the data. The parameters for the
                    peak and background peak shape can be determined in the fit.
                    The method is particularly useful for determining peak areas
                    when two or more overlapping peaks are present. The method
                    is also used to accurately determine peak centroids for
                    energy calibration.
--------------------------------------------------------------------------------
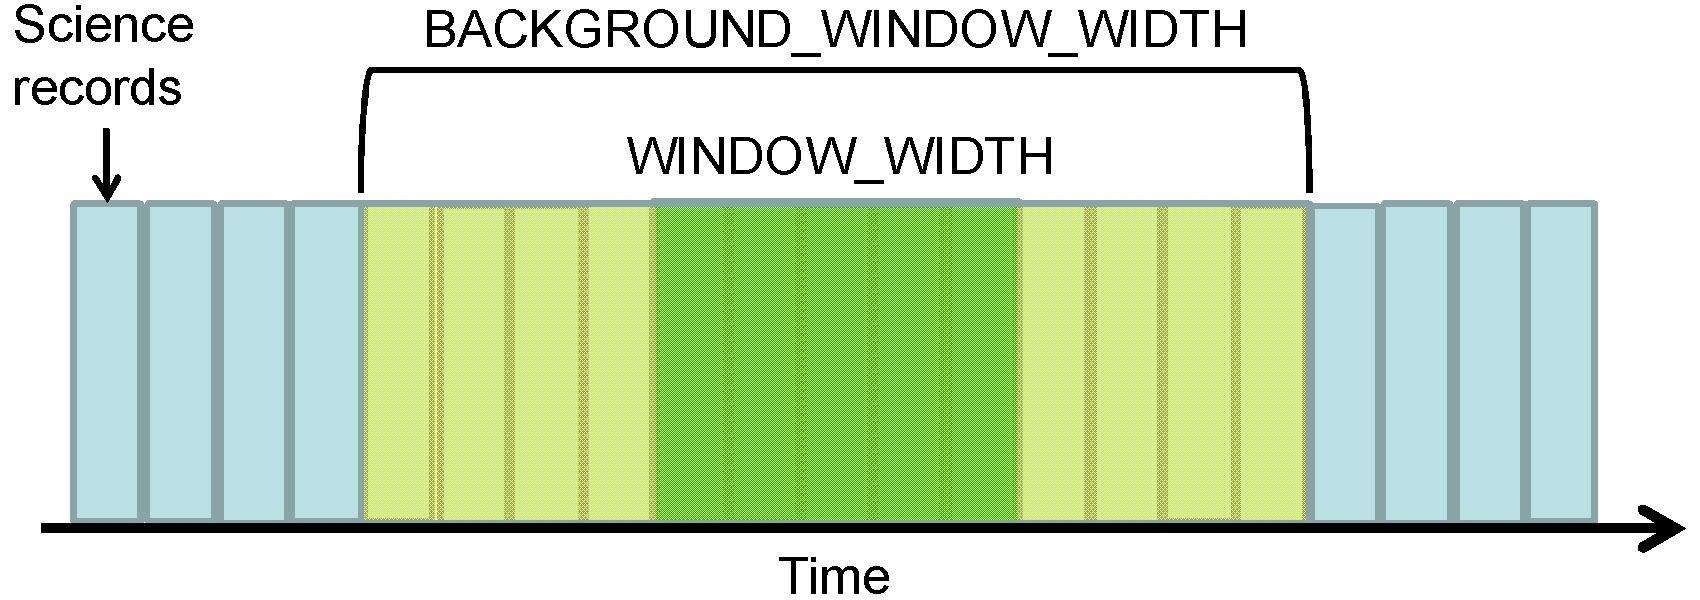
The parameters for the continuum background model are determined from a central moving average of spectra over a broad time window (BACKGROUND_WINDOW_WIDTH). The continuum is determined for spectra averaged over a narrow time window(WINDOW_WIDTH) by adjusting the amplitude of the continuum background model to match the counts in selected ROIs. This approach is effective in cases where the background continuum is known to vary slowly with time and when the peak-to-continuum ratio is low.
ADC DIFFERENTIAL NONLINEARITY CORRECTIONS
GRaND uses 12 bit flash analog-to-digital-converters (ADC) to construct pulse height distributions for each event category from analog, shaped pulses received from the front end electronics. The number of bits used to represent a pulse height spectrum depends on the sensor type and event category: the CAT2 and CAT4 pulse height spectra consist of 64 channels (6 bits); the CAT1 (single interaction spectrum with the +/-Z phoswiches) pulse height spectra consist of 256 channels (8 bits). The CAT9, single BGO interaction, pulse height spectrum consists of 1024 channels (10 bits), and the CAT10, single CZT interactions are recorded as 2048 channels (11 bits). Because variations in channel (or "code") width are relatively large for lower channels, the most significant bits from the ADC are used to represent the pulse height spectrum.
Differential nonlinearity can be measured by summing a pulse height spectrum over long periods of time (e.g. during cruise) such that random counting variations (Poisson) are small. Under these circumstances, variations in the spectrum on a scale less than the pulse height resolution are due to nonuniform ADC code widths. The variations can be observed by smoothing the raw pulse height spectrum with a box-car filter and dividing the raw spectrum by the smoothed spectrum. As long as the spectrum is slowly varying on the scale of the filter-width, then the resulting ratio will provide an accurate measurement of code width.
The process is illustrated in Figure 7 for the phoswich ADC using the sum of the +Z and -Z phoswiches accumulated over a long time period during cruise. The code width (as measured by the ratio of the raw to smoothed spectrum) varies by no more than 2% in regions where the spectrum is varying smoothly. The pattern of widths appears to repeat every 64 channels, indicating that the lower 4 bits are the source of most of the variation. The fitted ratio shown in Figure 7b is the best fit to the middle two 64-channel regions and repeats every 64-channels.
Measured spectra can be corrected for differential nonlinearity by dividing the counts in each channel by the code width (given by the fitted ratio). A similar approach was taken to correct neutron spectra acquired by 2001 Mars Odyssey (Prettyman, Delapp, Feldman, & Maurice, 2004).
For the 10 bit BGO and 11 bit CZT spectra, the error due to differential linearity was relatively high (as much as 15% for CZT) and a well-defined pattern of code- widths was not evident(for example,see Figure 8). Consequently, the full ratio spectrum, except for the lower 64 bins of the spectrum, was used to correct for differential nonlinearity. In addition, the CZT spectra were re-sampled to 10-bits to minimize code-width variations.
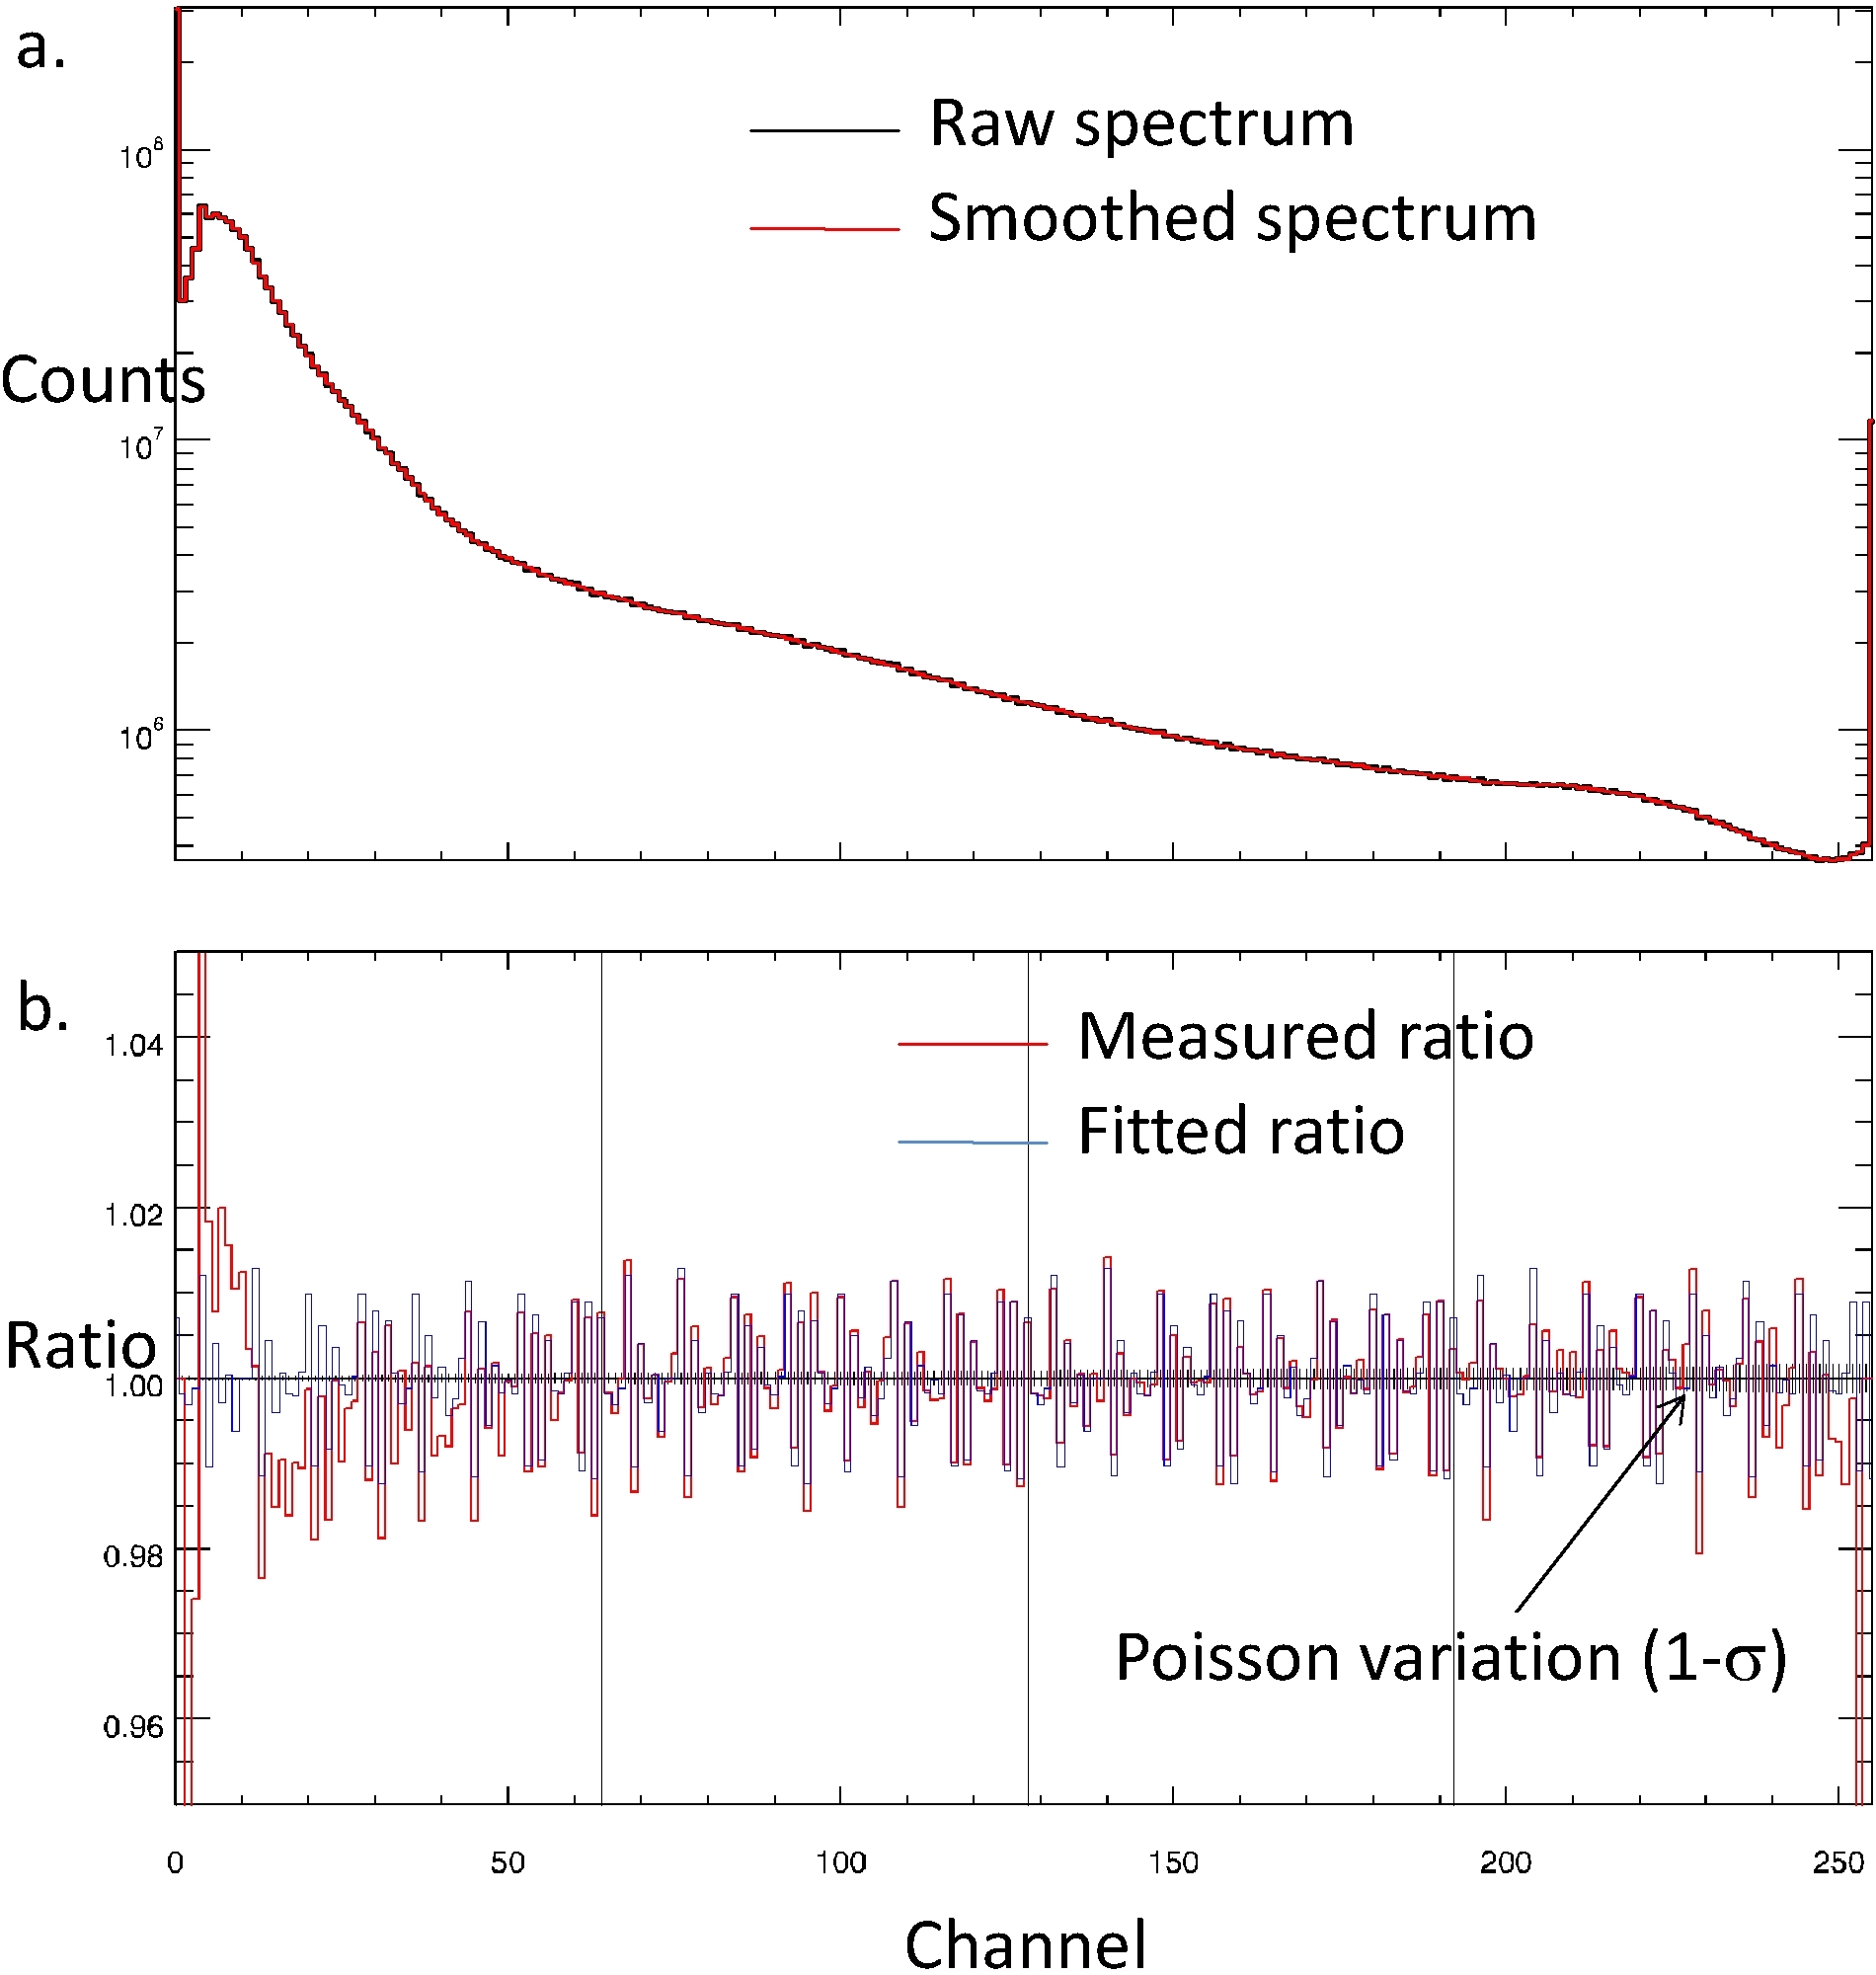
FIGURE 7. DIFFERENTIAL NONLINEARITY CORRECTION (256-CHANNEL SPECTRUM)
a. Summed CAT1 (256 channel) spectra (raw and smoothed). The box-car filter was 5 channels in width; b. Ratio of the raw spectrum to the smoothed spectrum. The fitted ratio repeats every 64 channels.
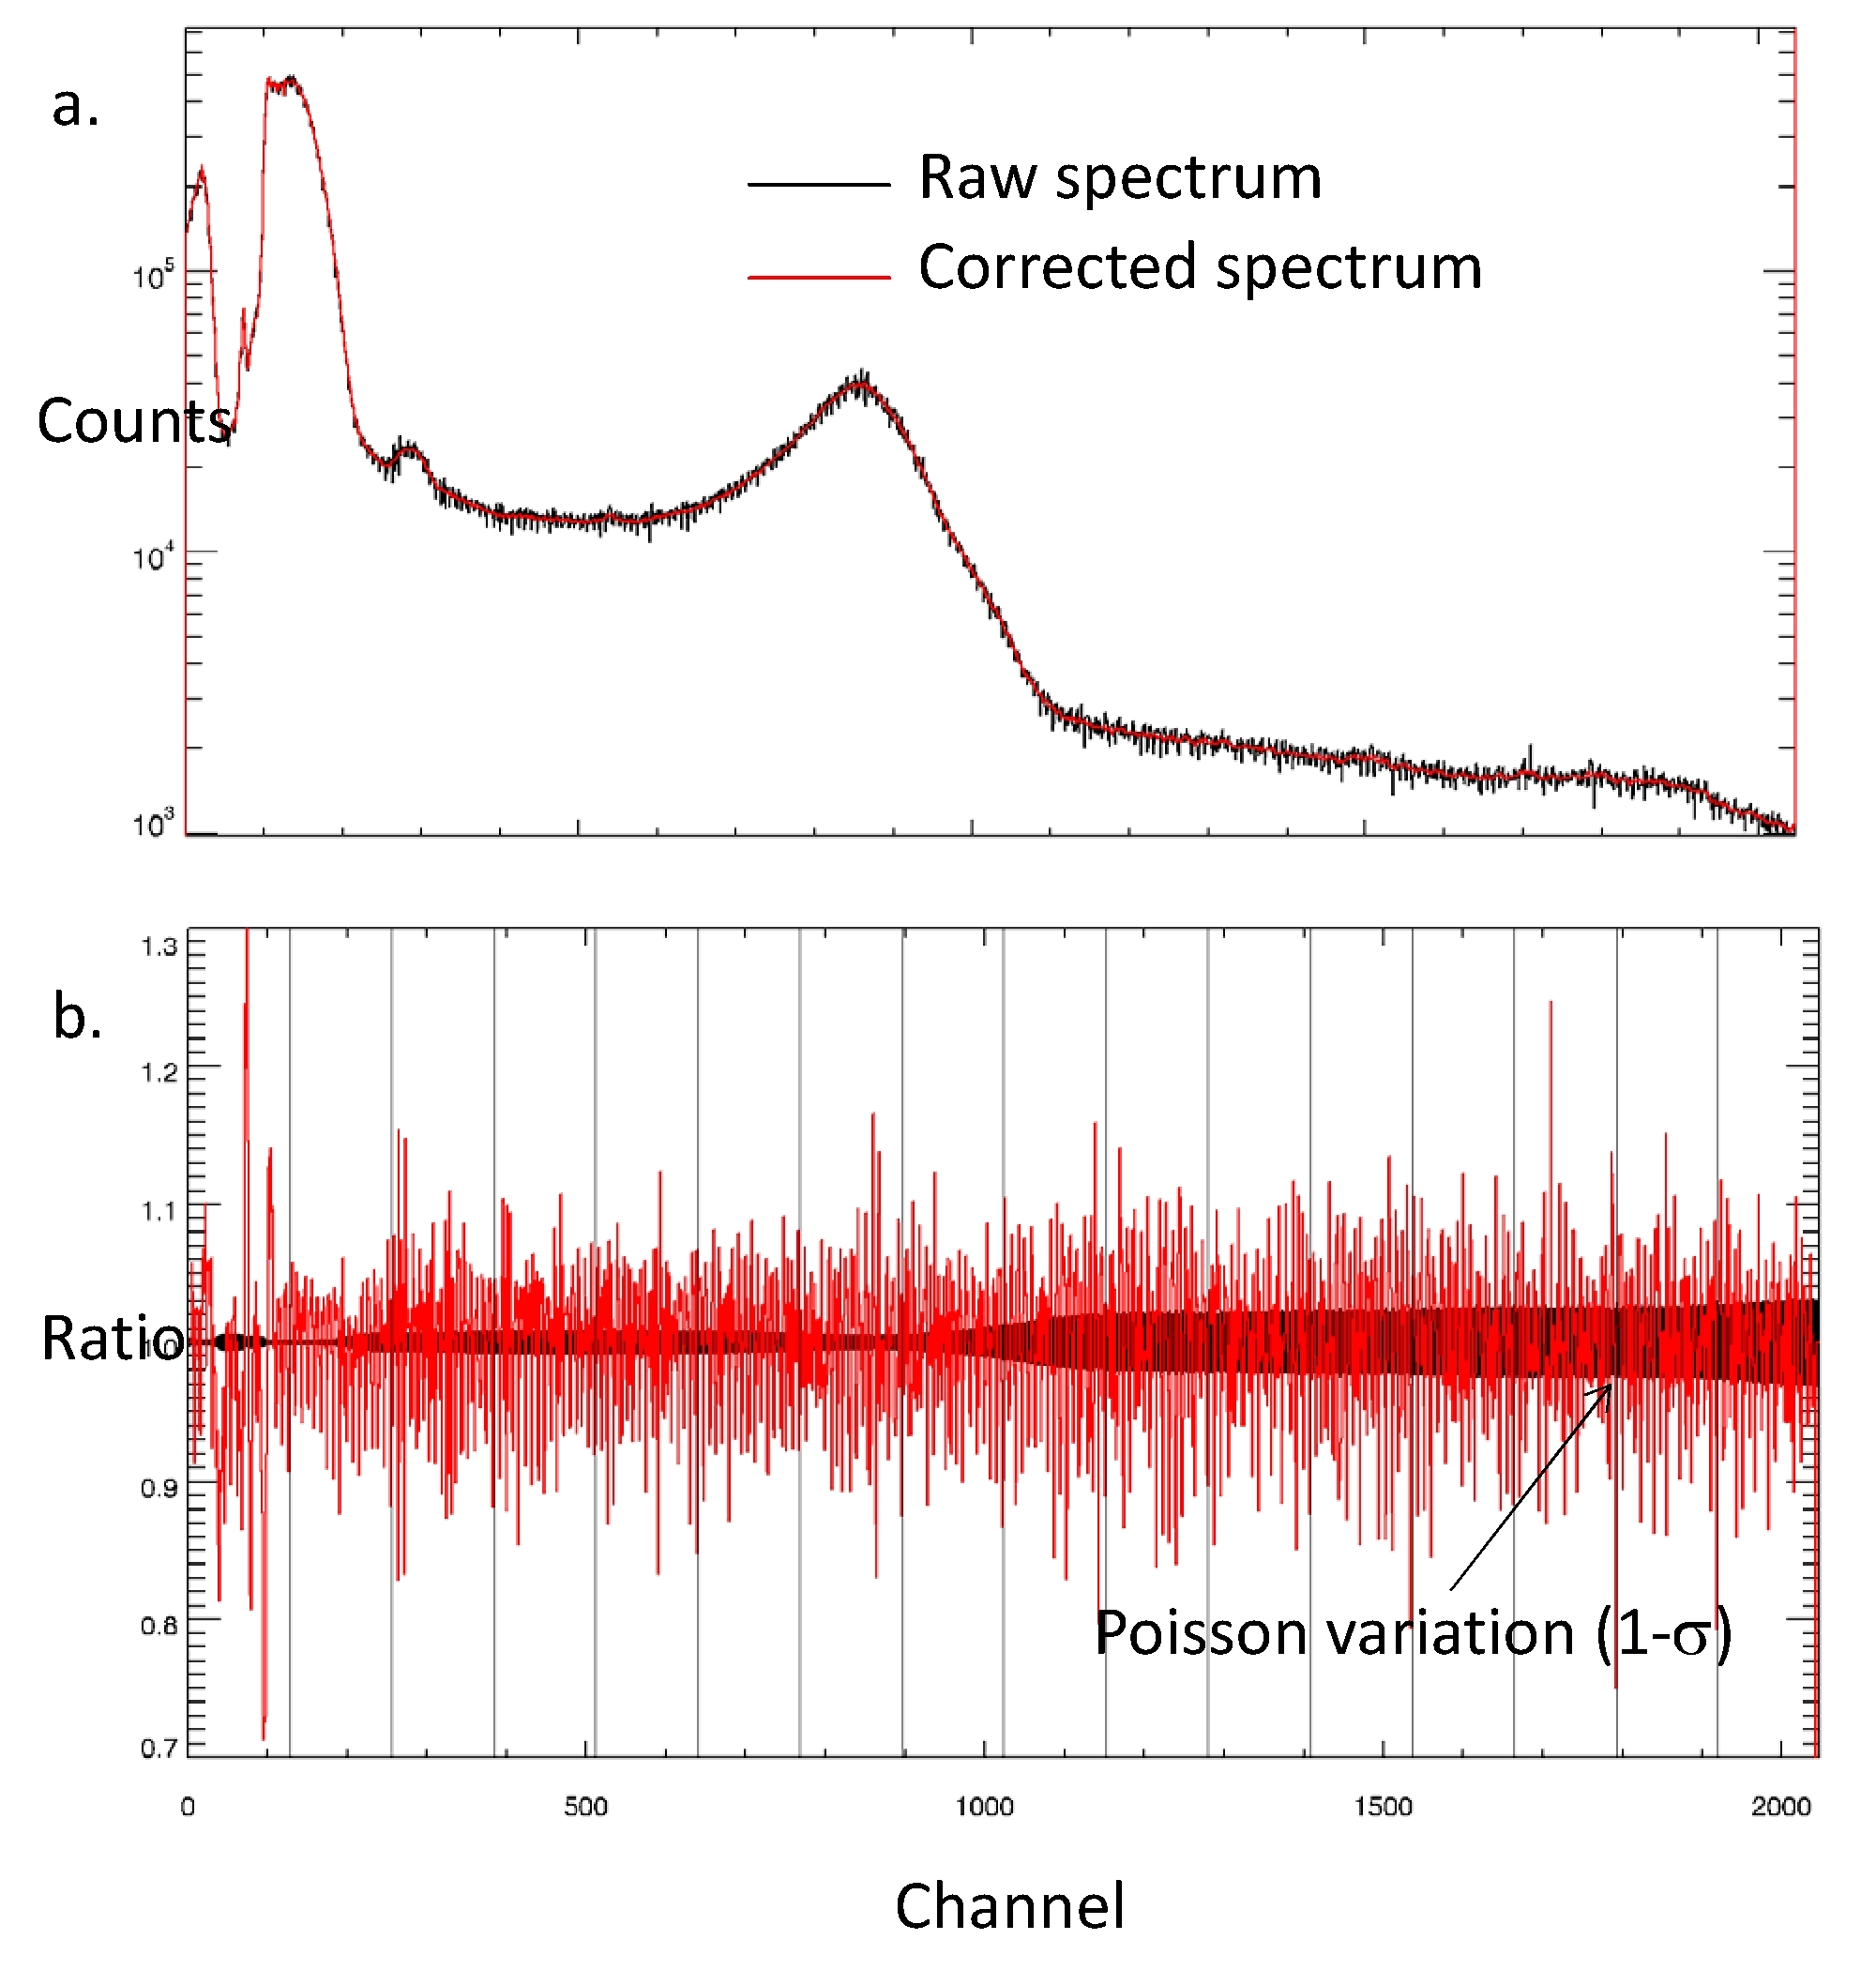
FIGURE 8. DIFFERENTIAL NONLINEARITY CORRECTION (2048-CHANNEL SPECTRUM)
DEAD TIME AND ROLL OVER CORRECTIONS
The counting rate for a scaler or a spectrum channel is given by the counts divided by the measurement time adjusted for counting losses. These losses occur because GRaND takes a variable amount of time to process each event, during which time one or more particles may interact with the scintillators. GRaND monitors the dead time, which is the amount of time GRaND is busy processing an event, which can be subtracted from TELREADOUT in order to get an accurate estimate of the live time. The live time is the amount of time GRaND was available to process events. The corrected counting rate is given by the measured counts divided by the live time. Dead time in seconds is determined by multiplying SCALER[0] by 204.8µs/DN. The dead time DN is determined by counting cycles of a 5MHz clock with 26 bit counter using the highest 16 bits, which gives 204.8 µs per count.
The scalers are 16-bit counters. For long measurement times the counters can achieve their maximum value (65535)at which point they "roll over," and the count restarts at 0. For long accumulation intervals or high counting rates, the dead time counter can rollover multiple times.The correct value of the dead time counter (if the counter had unlimited bits) is given by SCALER[0]*=SCALER[0]+NR x 216, where NR is the number of roll over events in an accumulation interval.
Roll over can be observed directly by monitoring the value of SCALER[0] recorded in the SOH data in cases where TELSOH was selected to subsample TELREADOUT. For example, there were long periods of time during Mars approach in which TELREADOUT was 210s and TELSOH was 35s (6 SOH samples per accumulation interval), the dead time counter was observed to roll over twice. The data were acquired during quiet Sun conditions for which the response of GRaND was dominated by galactic cosmic ray interactions with the spacecraft. These conditions were pervasive throughout the first phase of the mission, including MGA. Consequently, during Mars Closest Approach (MCA), for which TELREADOUT was 35s, no roll over events were expected when GRaND was far from Mars (>2000 km).
When TELSOH is set to subsample TELREADOUT, the Level1b software uses an algorithm to detect and correct the dead time counter for rollover. In cases where TELSOH=TELREADOUT and the counting rate is changing (e.g. during MCA or during a solar energetic particle event), roll over can be detected by comparing the dead time counter to other scalers with low counting rates (e.g. the overload scalers or the CZT single interaction scaler), which are not expected to roll over. Abrupt changes in the ratio of the dead time counter to the comparison scaler indicate that roll over has occurred. During MCA, no roll-over events were detected.
CAT1 PROCESSING: THERMAL AND EPITHERMAL NEUTRONS
The 256-channel CAT1 spectra (single interactions with either the +Z or -Z phoswich) include contributions from epithermal neutrons undergoing the 10B(n,α) reaction in the BLP scintillator, which produces a peak at 93keVee, thermal and epithermal neurons that undergo the 6Li(n,t) reaction which produces a peak at higher energy (about 300 keVee light output from the phoswich), and a background continuum from gamma rays (Figure 9). The strong separation of the neutron reaction peaks enables the use of energy-domain- filtering to separately measure neutron interactions in the boron-loaded-plastic (BLP) and lithiated glass (LIG) scintillators. During flight, the gamma ray background was elevated, resulting in low signal-to-noise for both peaks in comparison to calibration measurements.
Techniques similar to those used for Mars Odyssey neutron data processing were applied to determine the counting rate for reaction peaks (Prettyman, Delapp, Feldman, & Maurice, 2004). Several methods were evaluated, including simultaneously determining the background in both peak regions of interest by fitting a log-log quadratic function to three background regions of interest (Figure 10). This technique was found to be effective for spectra averaged over long periods of time, but was unreliable for short time intervals needed for mapping. Two methods were compared for determining the 93 keVee peak area using two background regions of interest: power law and log-log quadratic (Figure 11).
The power law method, which uses fewer parameters than the quadratic method and gives similar results for counting rate, was selected for production. The width of the averaging window for the Level1b time series for MGA was selected to be WINDOW_WIDTH=5. For each point in the time series, the background shape was determined by fitting a power law to a spectrum averaged over a coarse time window (BACKGROUND_WINDOW_WIDTH=11, see Figure 6). The amplitude of the background was adjusted to match the counts in the background regions for each point in the time series. The reaction peak in the lithiated glass was determined using the EXPERIMENTAL method as illustrated in Figure12. The resulting time series for the boron-loaded-plastic and lithiated glass are shown in Figure 13. Both the CMA and DTS methods for representing the time series are shown.
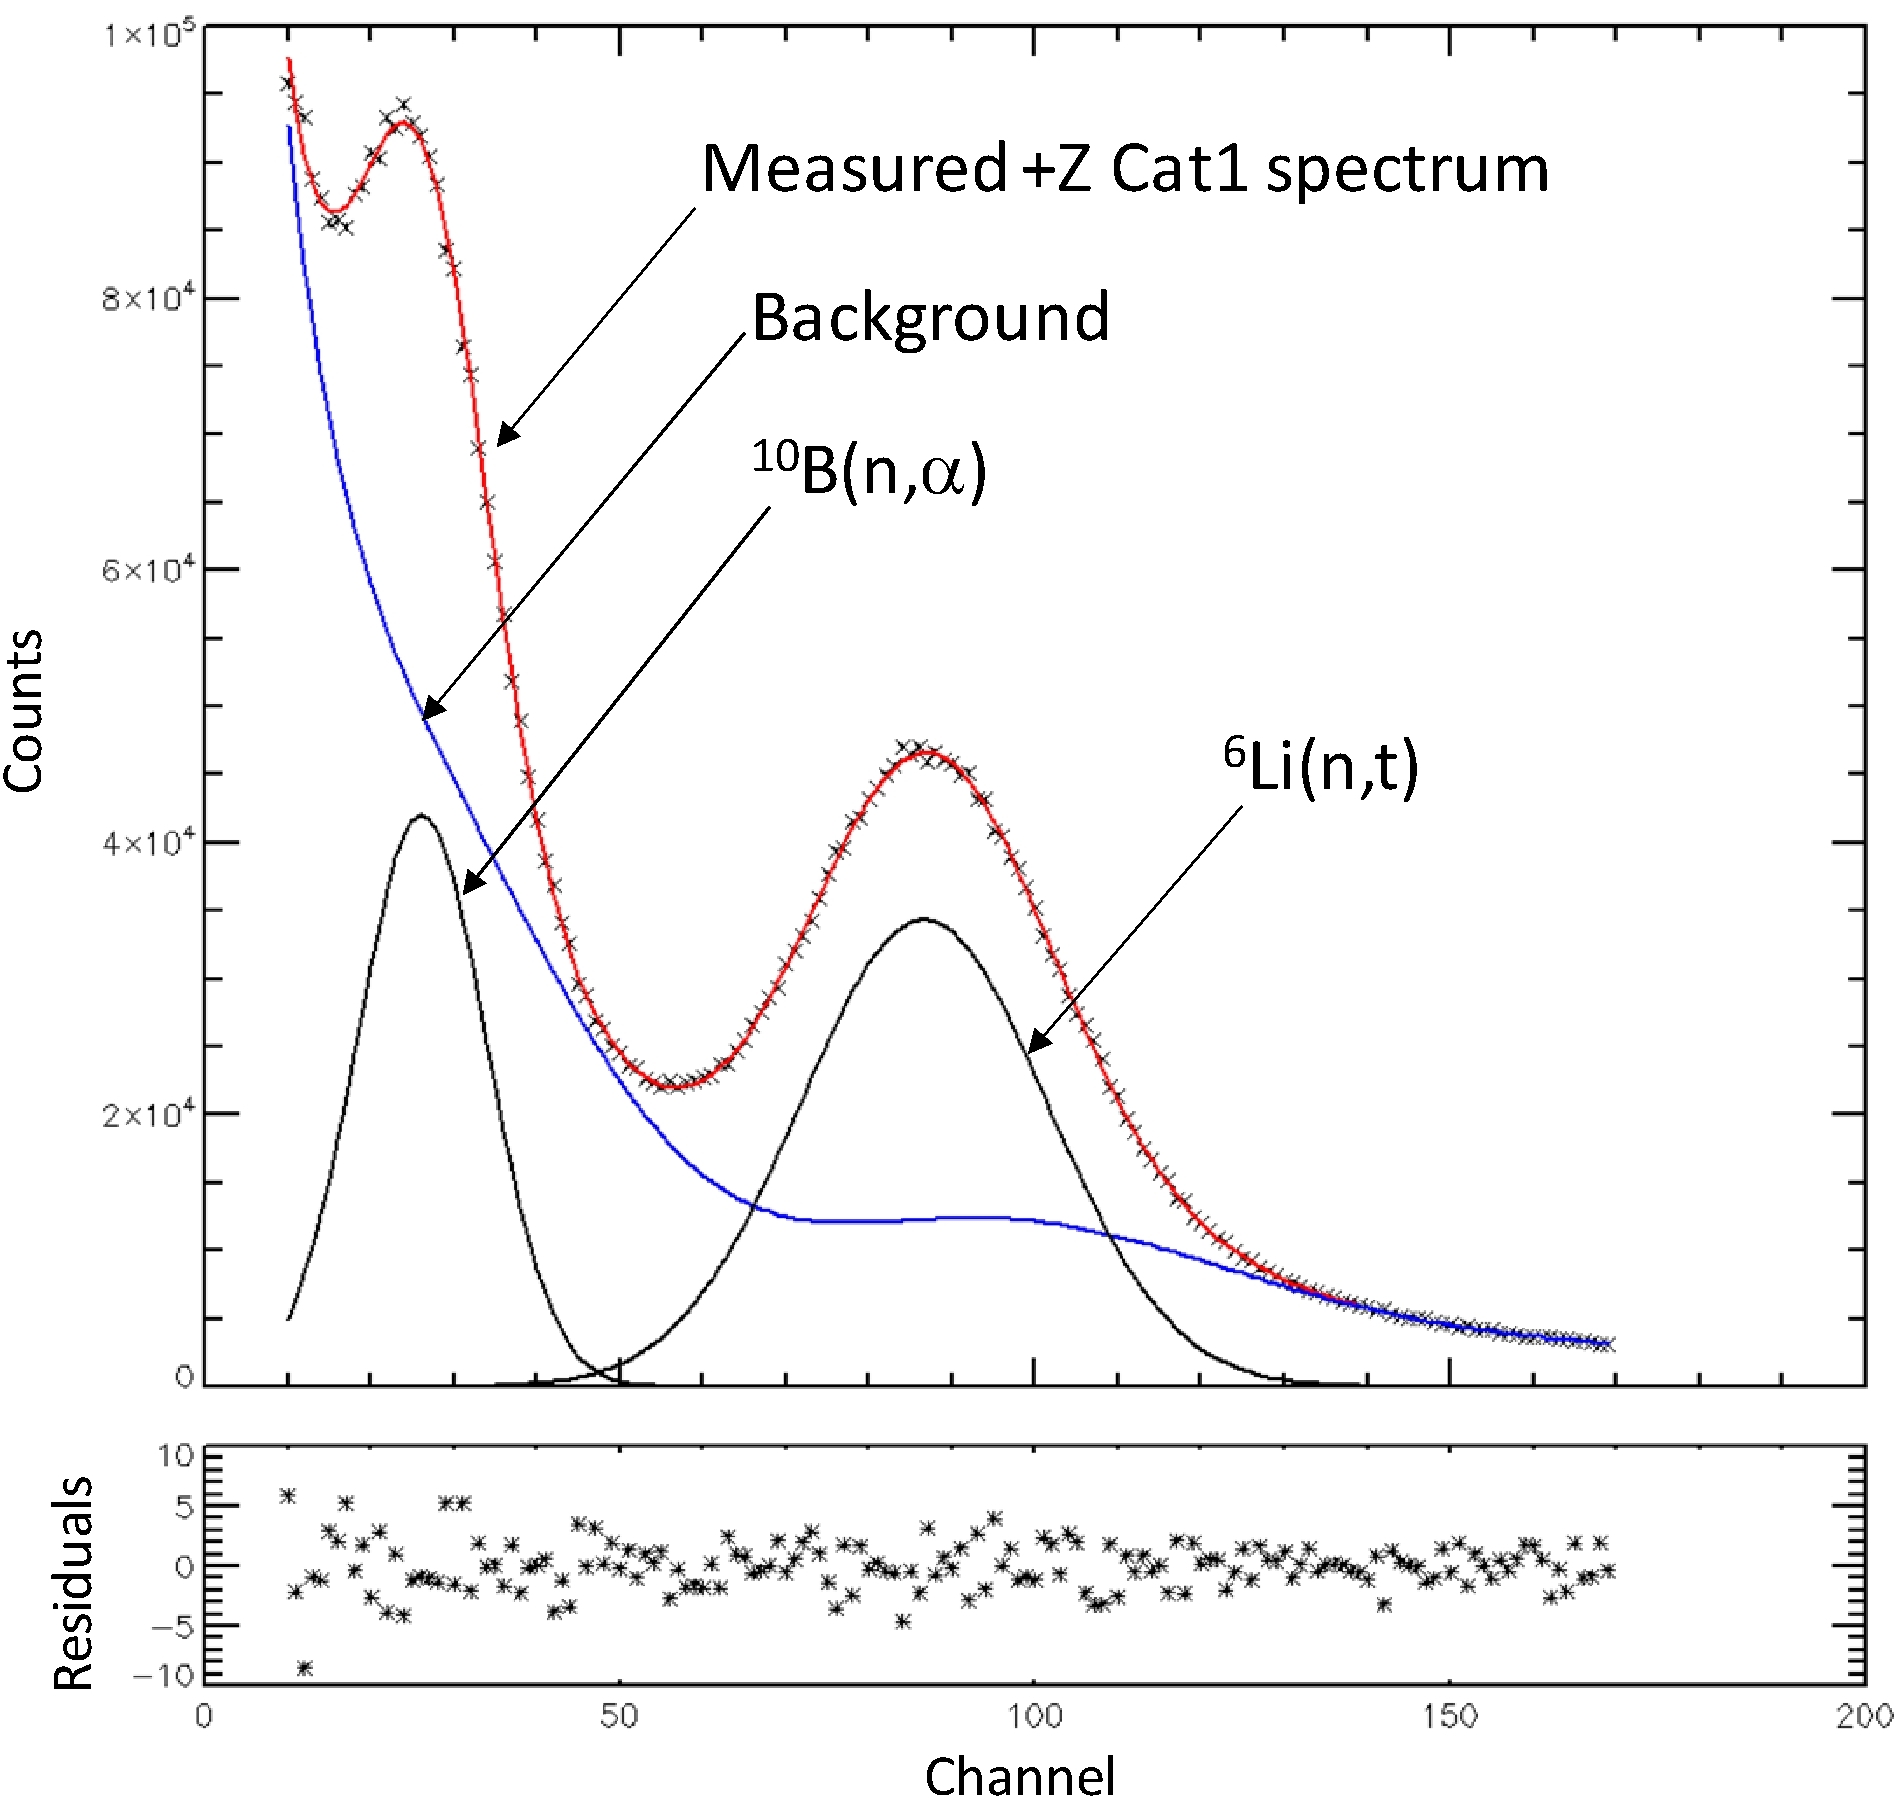
FIGURE 9. CAT1 PULSE HEIGHT SPECTRUM MEASURED IN THE LABORATORY
CAT1 pulse height spectrum for the +Z phoswich measured in the laboratory during
ground calibration. The source was 241AmB (α,n), which emits
neutrons with an average energy of 2.8 MeV. The source was placed in a graphite
moderator assembly for which the output energy distribution (mixture of thermal,
epithermal, and fast neutrons) is similar to a planetary leakage spectrum. The
peak for the 10B(n,α) reaction in the BLP scintillator at 93
keVee and the higher energy peak from 6Li(n,t) reaction in
the LiG scintillator were fitted using GPA.
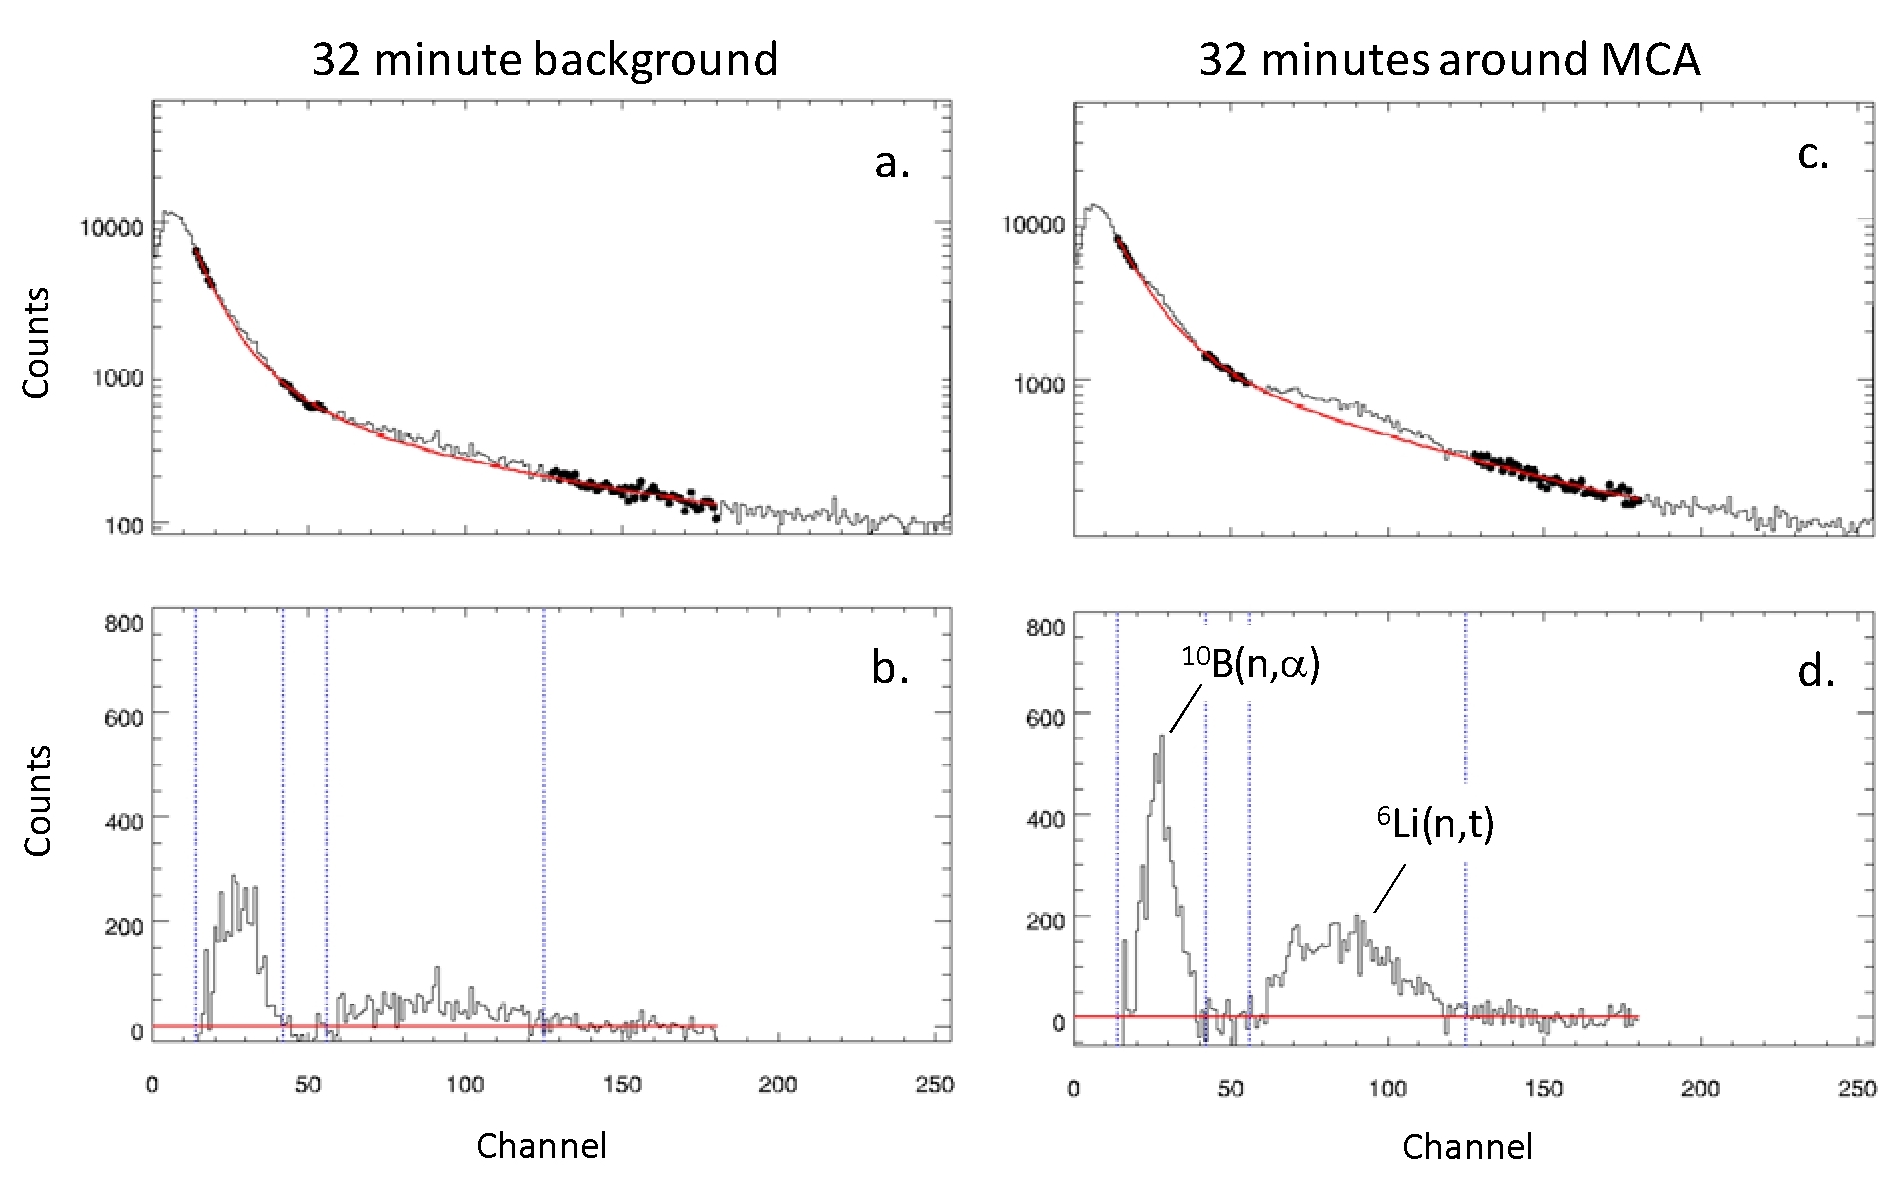
FIGURE 10. CAT1 SPECTRUM ANALYSIS: LOG-LOG QUADRATIC BACKGROUND
A log-log quadratic was fitted to the background in three regions of interest
for spectra accumulated during MGA far from Mars (a and b) and in close
proximity to Mars (c and d). The fitted background is shown in red in a and c.
Subtracting fitted background from the measured spectrum reveals the reaction
peaks. The counting rates are given by the sum of the net counts in the peak
regions of interest (indicated by blue dashed vertical lines).
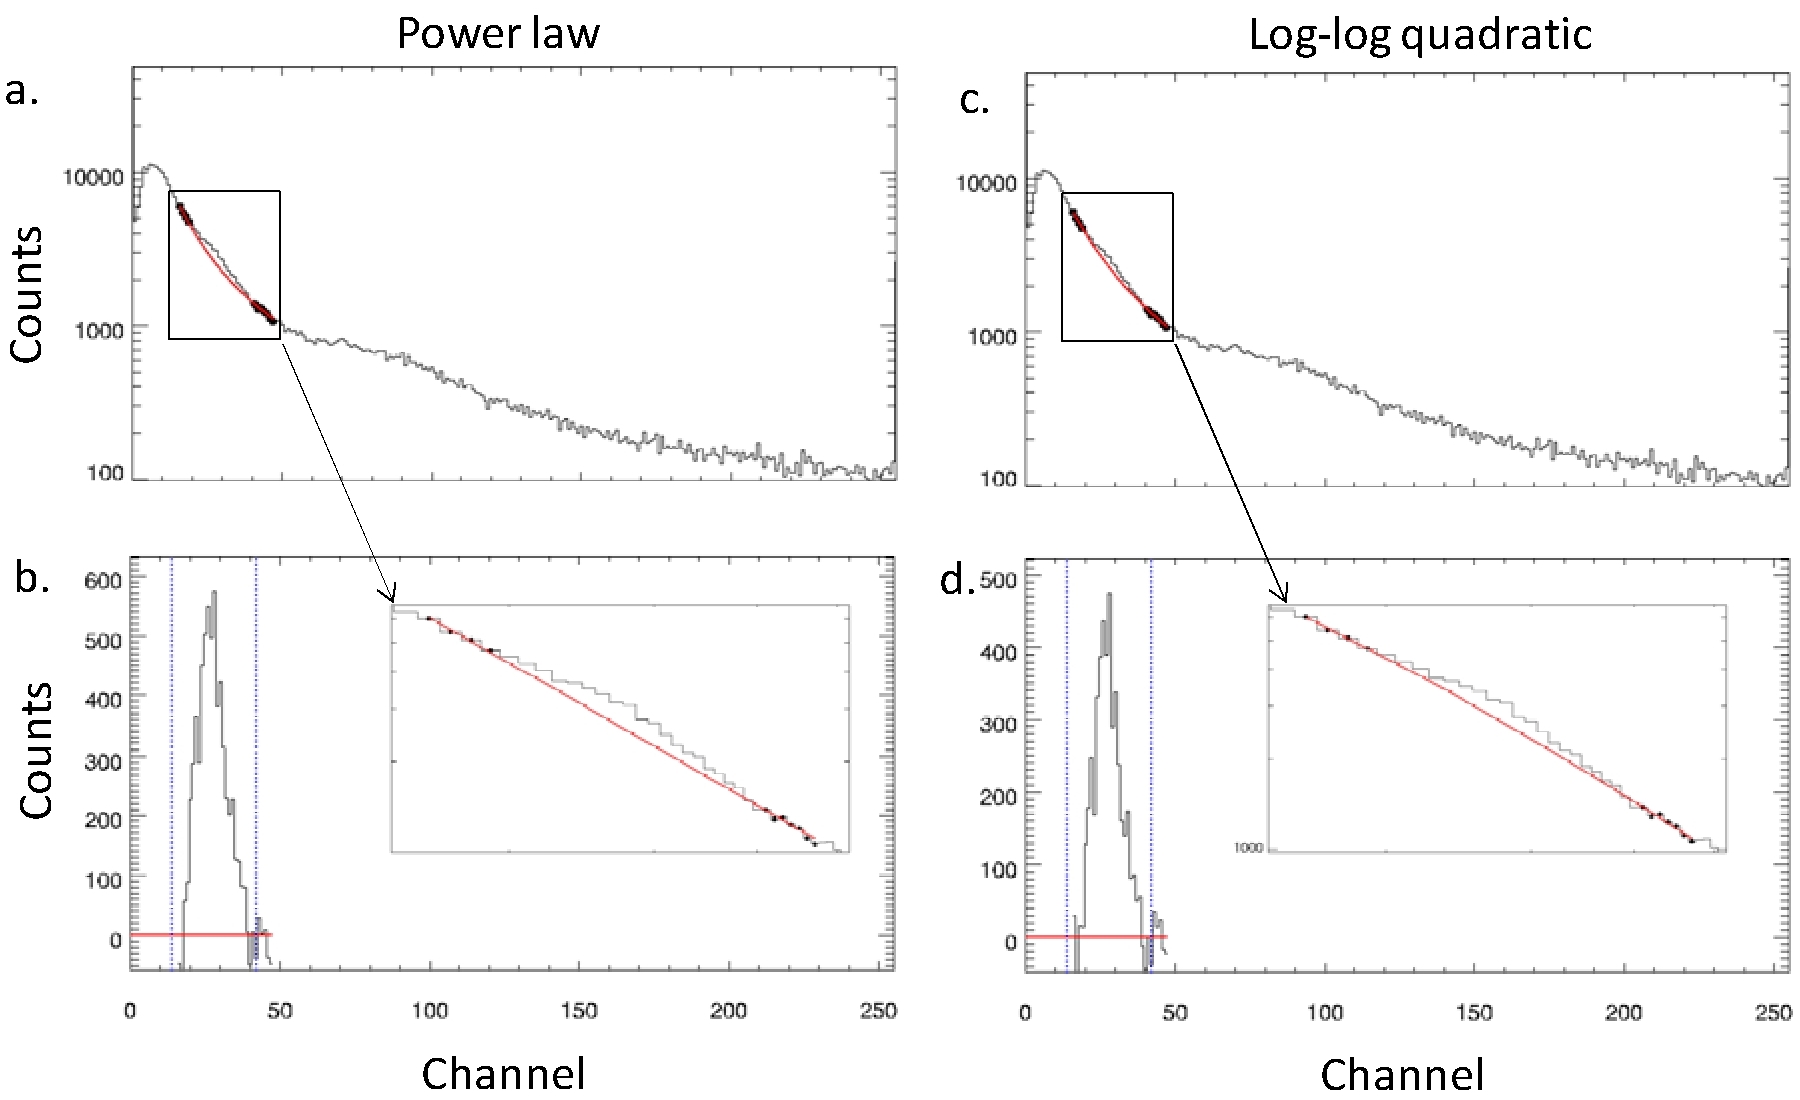
FIGURE 11. CAT1 SPECTRUM ANALYSIS: 93 KEVEE PEAK
Two methods to determine the area of the 93 keVee peak from a Cat1
spectrum accumulated during MGA (32 minutes around MCA): the background was
determined by fitting a power law to regions of interest surrounding the peak (a
and b); and the background was determined by fitting a log-log quadratic to the
same regions. The net counts are shown in b and d.
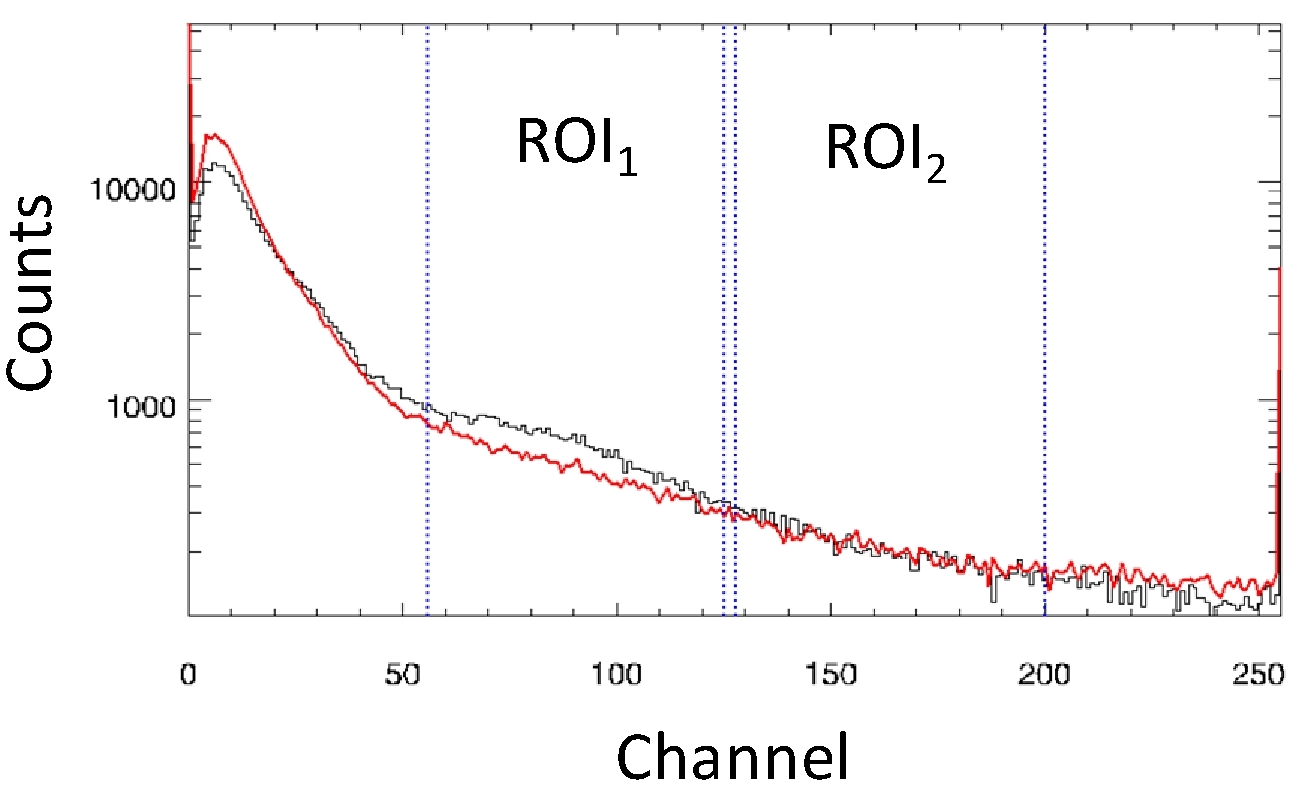
FIGURE 12. CAT1 SPECTRUM ANALYSIS: LI-GLASS REACTION PEAK
A CAT1 spectrum measured far from Mars was used to represent the background
shape (shown in red). The background is adjusted in amplitude to match the
counts measured in ROI2. The net area is determined by subtracting
the measured counts from the adjusted background in the peak region of interest
(ROI1).
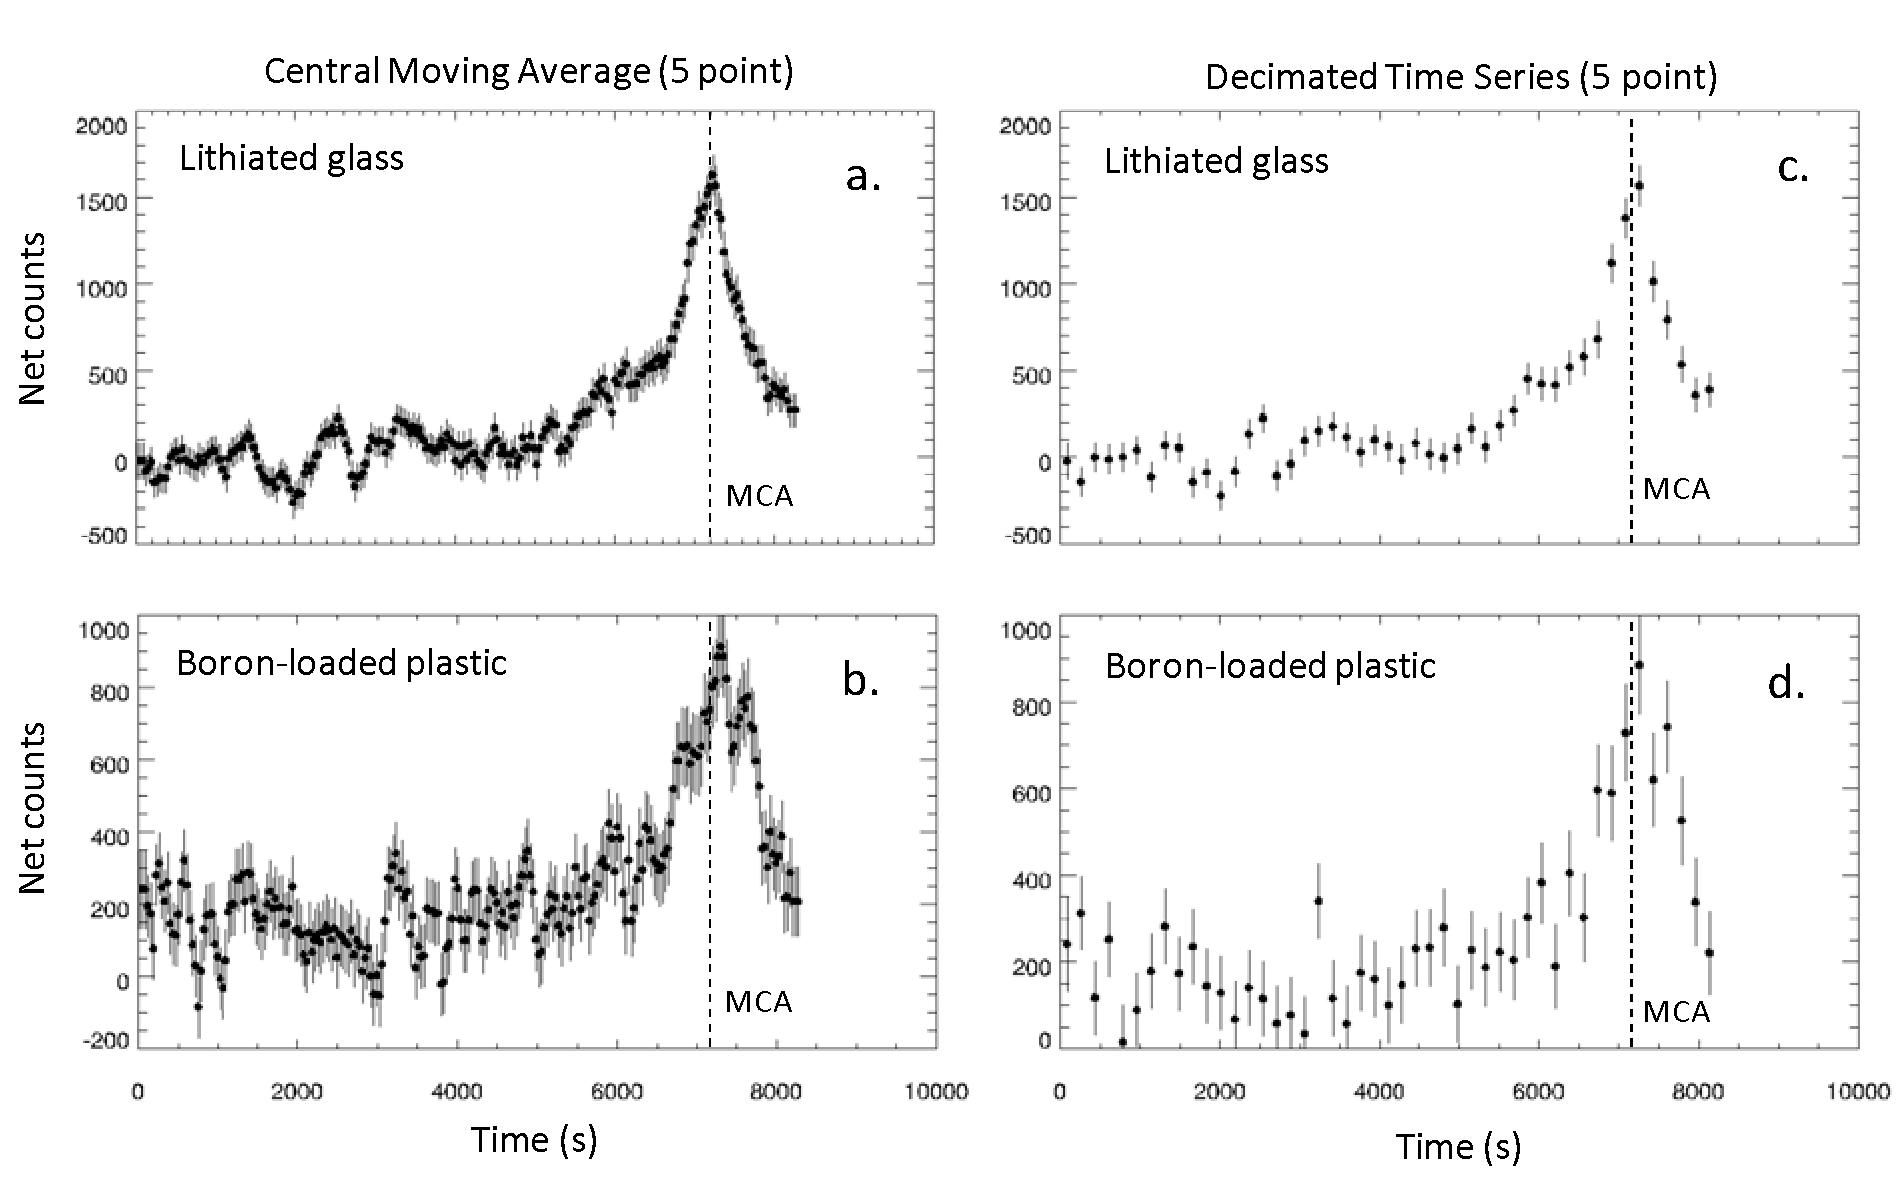
FIGURE 13. TIME SERIES CAT1 COUNTING RATES FOR MARS FLYBY
The CAT1 counting rates determined from data acquired during Mars flyby for the
lithiated glass (a and c) and boron loaded plastic (b and d) are shown for the
two methods used to represent the Level1b time series (WINDOW_WIDTH=5). Note
that the width of the background time window used to determine the shape of the
background function was BACKGROUND_WINDOW_WIDTH=11. The ephemeris time
(ordinate) was arbitrarily referenced to the midpoint of the first interval.
A peak in the counting rates is observed when GRaND is within about 2000 km from
Mars (between 6000s and 8000s. Mars Closest Approach (MCA) is indicated by the
dashed lines.
CAT2 PROCESSING: THERMAL AND EPITHERMAL NEUTRONS
CAT2 coincidence spectra were processed for all four combinations of BLP-BGO coincidences. Following review of the flight and calibration data,it was discovered that the coincidence windows and regions of interest for the BGO pulse height spectrum were referenced to a 512-channel spectrum; whereas, the BGO spectrum is reported as at 1024 channel spectrum. This resulted in the coincidence window being set well above the 478 keV region throughout flight. In addition, the region of interest for the background was shifted so that the 478 keV peak was at the lower boundary of the window (Figure 14). The coincidence window settings for the BLP scintillators are believed to be correct based on a comparison of peaks in the +/-Z CAT1 and CAT2 BLP pulse height spectra. Consequently, the 478 keV peak gives an accurate measurement of the CAT2 counting rate. The peak area was determined by the LINEAR method in which an upper ROI was used to estimate the background underneath the 478 keV peak. The CAT2 time series (DTS) is shown in Figure 15. The error in the selection of the coincidence window for the BGO will be corrected during Mars-Vesta cruise operations, in which the coincidence windows will be optimized.
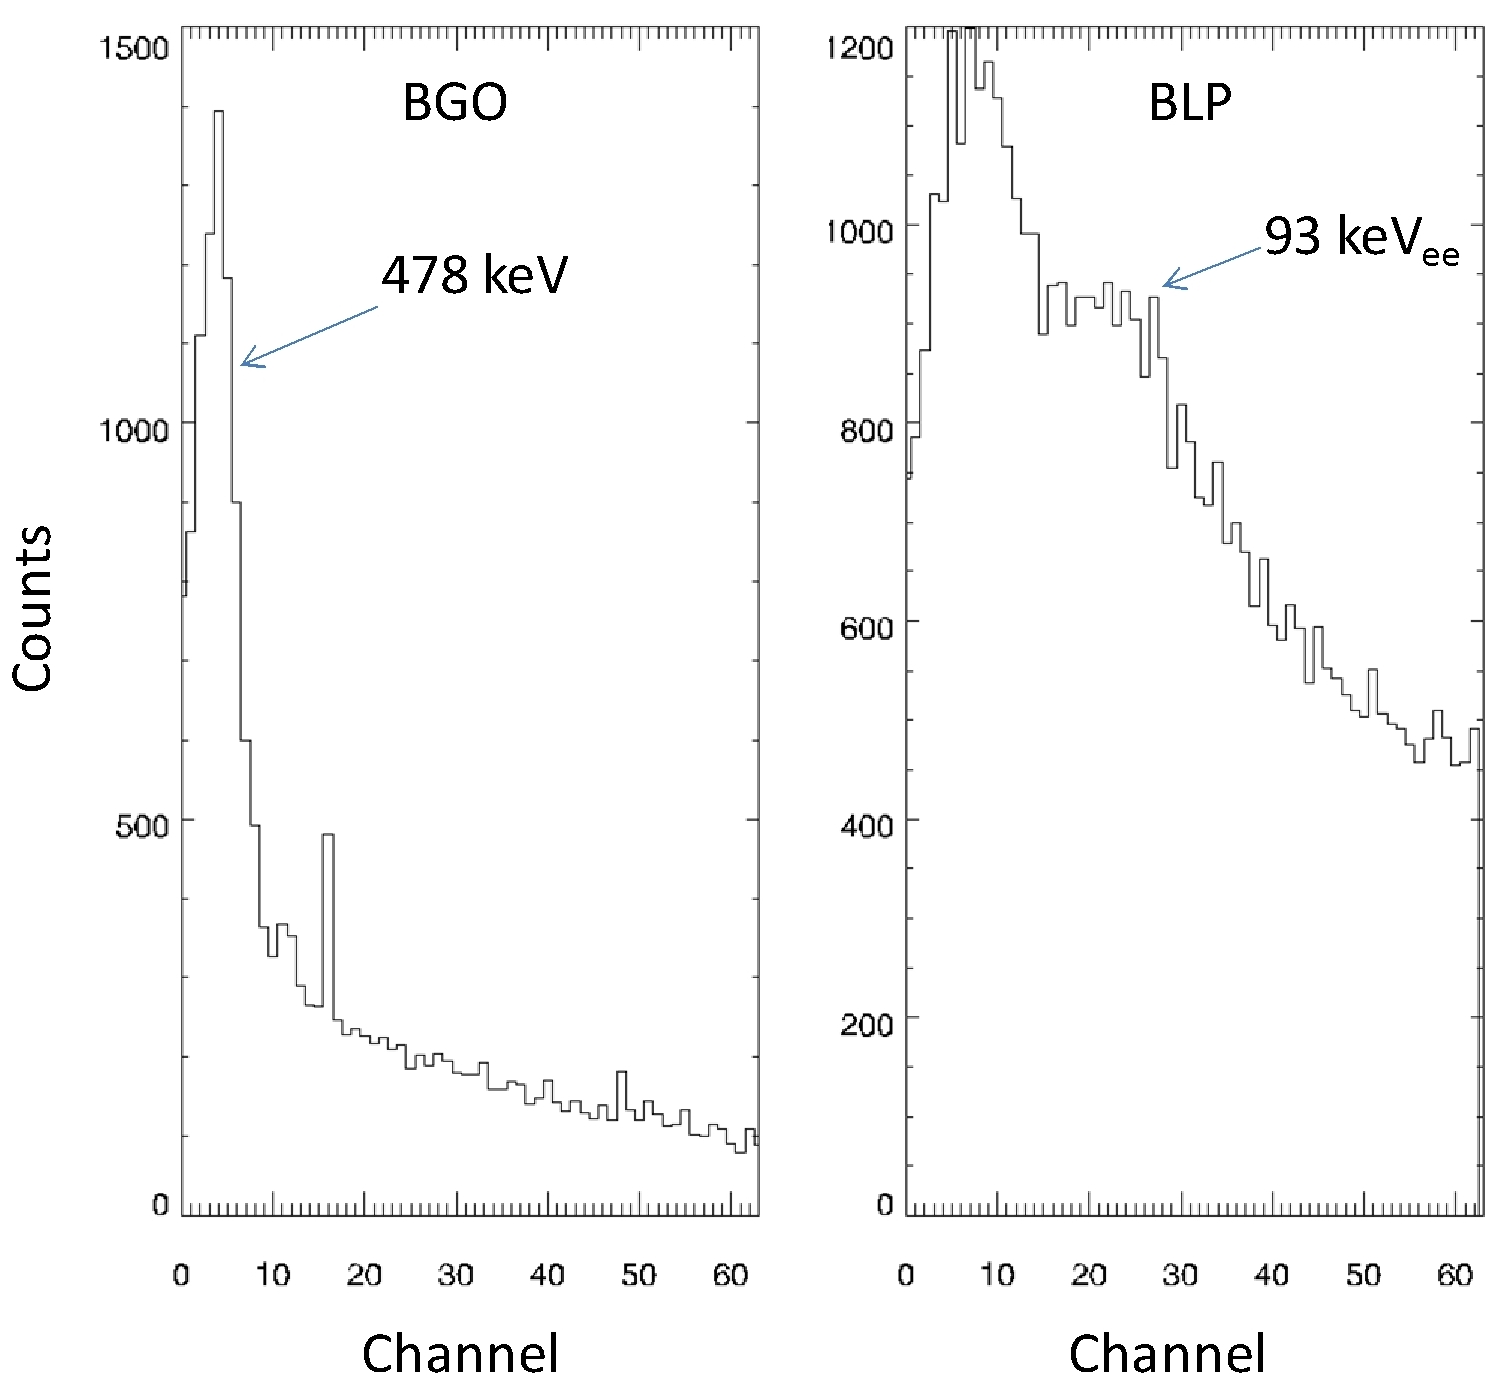
FIGURE 14. CAT2 SPECTRA FOR THE -Y BLP SCINTILLATOR
The CAT2 64-channel pulse height spectra recorded for the -Y scintillator during
MGA.
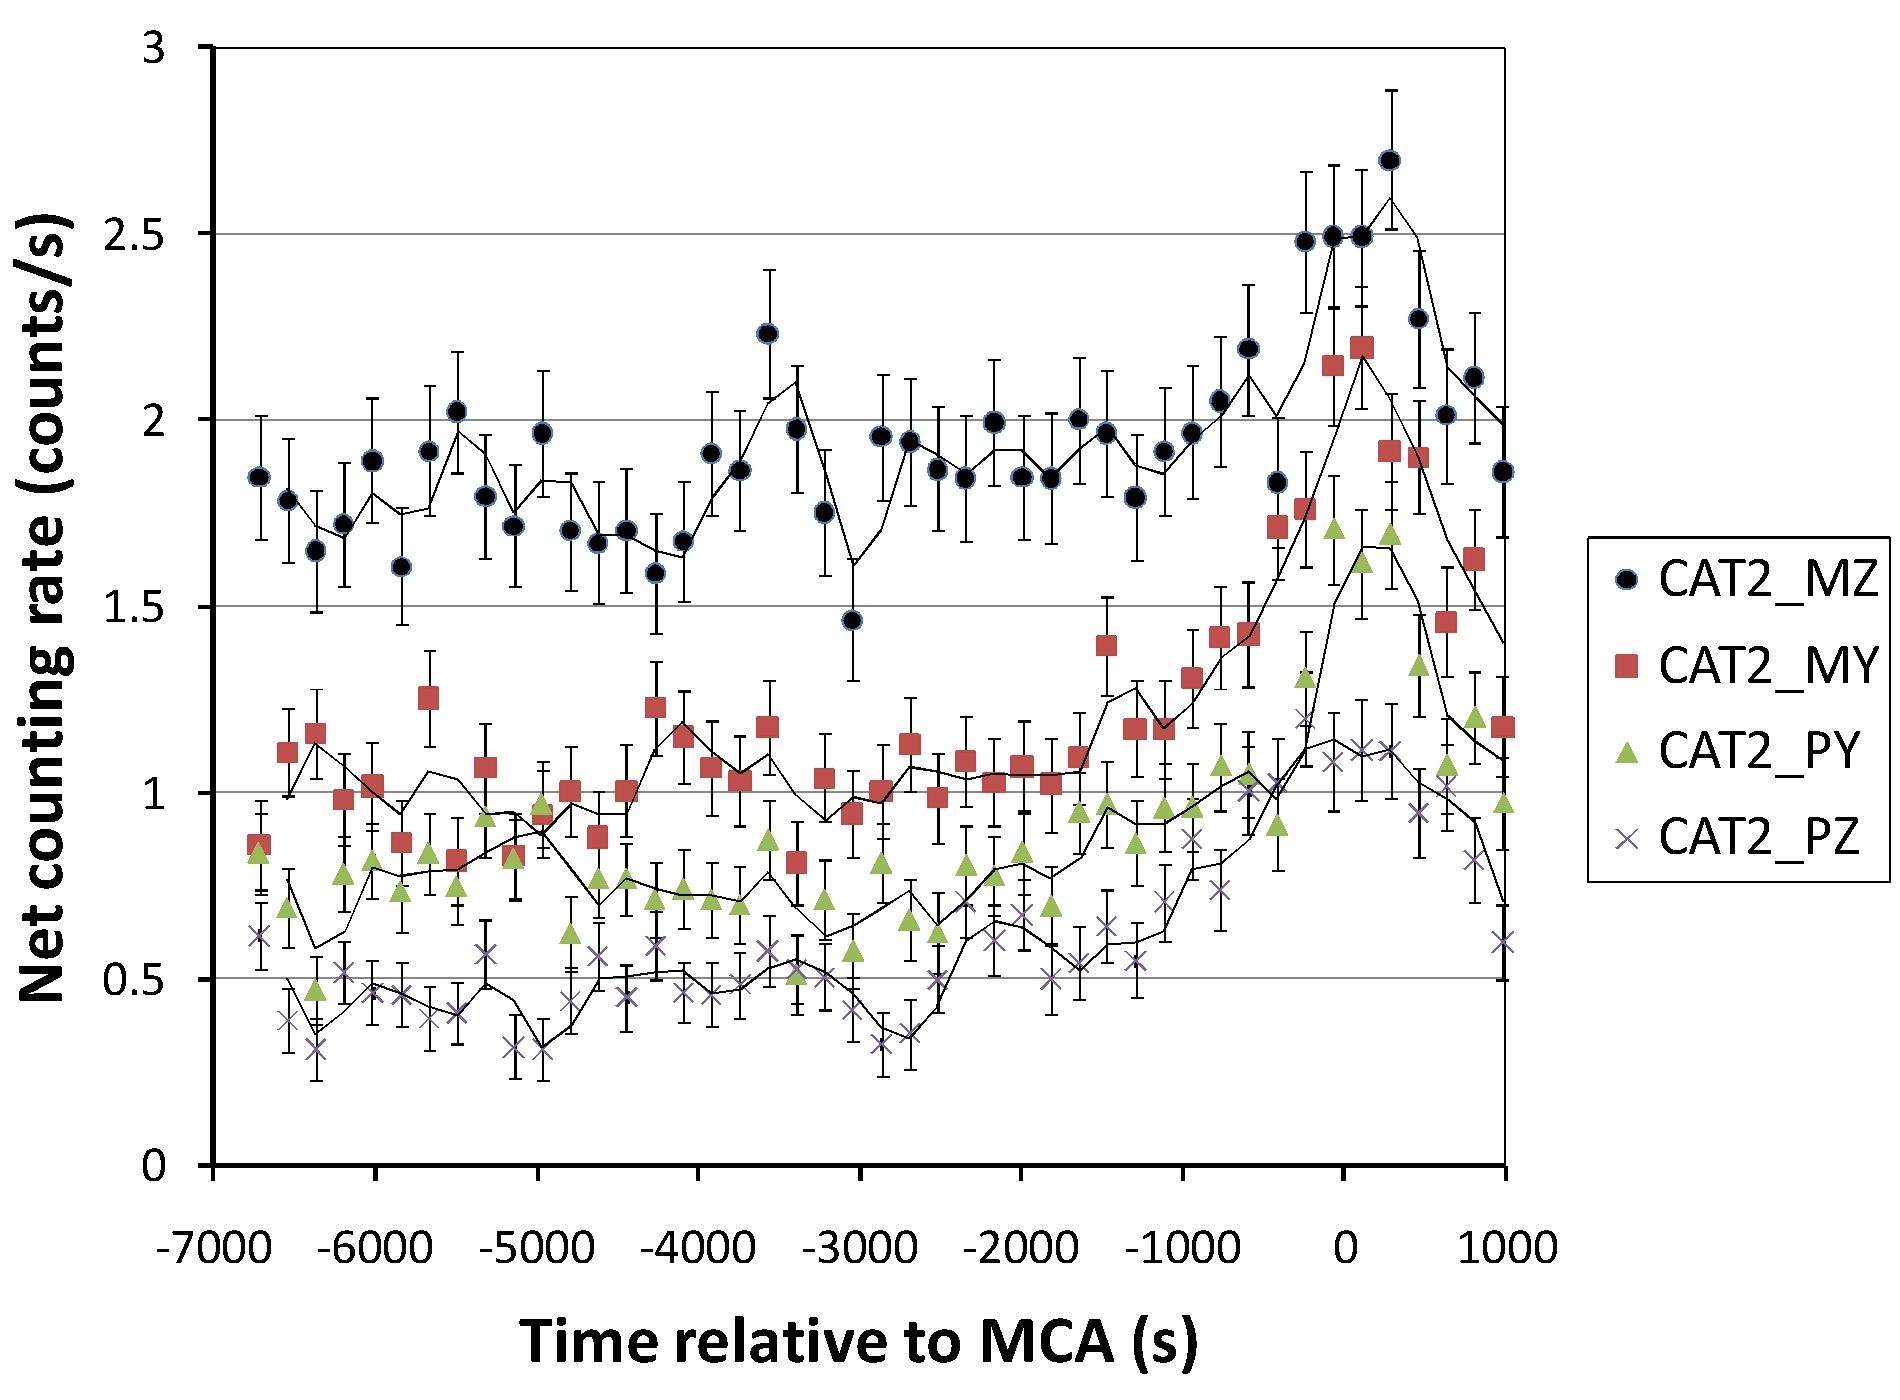
FIGURE 15. TIME SERIES CAT2 COUNTING RATES FOR MARS FLYBY
The CAT2 counting rates are shown for the four different BGO-BLP coincidence
combinations.
CAT4 PROCESSING: FAST NEUTRONS
The CAT4 event data are processed to produce the pulse height spectrum of proton recoils from fast neutron interactions with hydrogen in each of the four BLP scintillators. The CAT4 event data records double-pulse events caused by fast neutron interactions with the four BLP sensors. Each event consists of an amplitude for the first interaction, which for fast neutron interactions corresponds to the light flash produced by proton recoils by the fast neutron, an amplitude for the second interaction, which corresponds to the neutron undergoing 10B(n,alpha) once it has reached low energies, following many successive collisions within the scintillator, and the time between the two interactions, referred to as the 'time-to-second-pulse' (TTSP).
The amplitude of the first pulse is related to the energy deposited by the fast neutron by proton recoils in the scintillator. Consequently, the fast neutron counting rate is determined from the pulse height spectrum of the first pulse. Note that double interactions can occur 'accidentally,' for example due to two uncorrelated particle interactions. In addition, after-pulsing of the phototube for high amplitude event scan also be mistaken for fast neutrons.
The accidental contribution is determined by subtracting the first pulse spectrum for a late time window from that measured during an early time window, with a width determined by the die-away time for neutrons in the BLP scintillators (Figure 16). The early time window used here was from 0.4 to 5.4 microseconds. The late time window was 20 to 25 microseconds. Note that second pulses occurring prior to 0.4 microseconds are likely due to after-pulsing and are excluded from the event buffer by the FPGA.
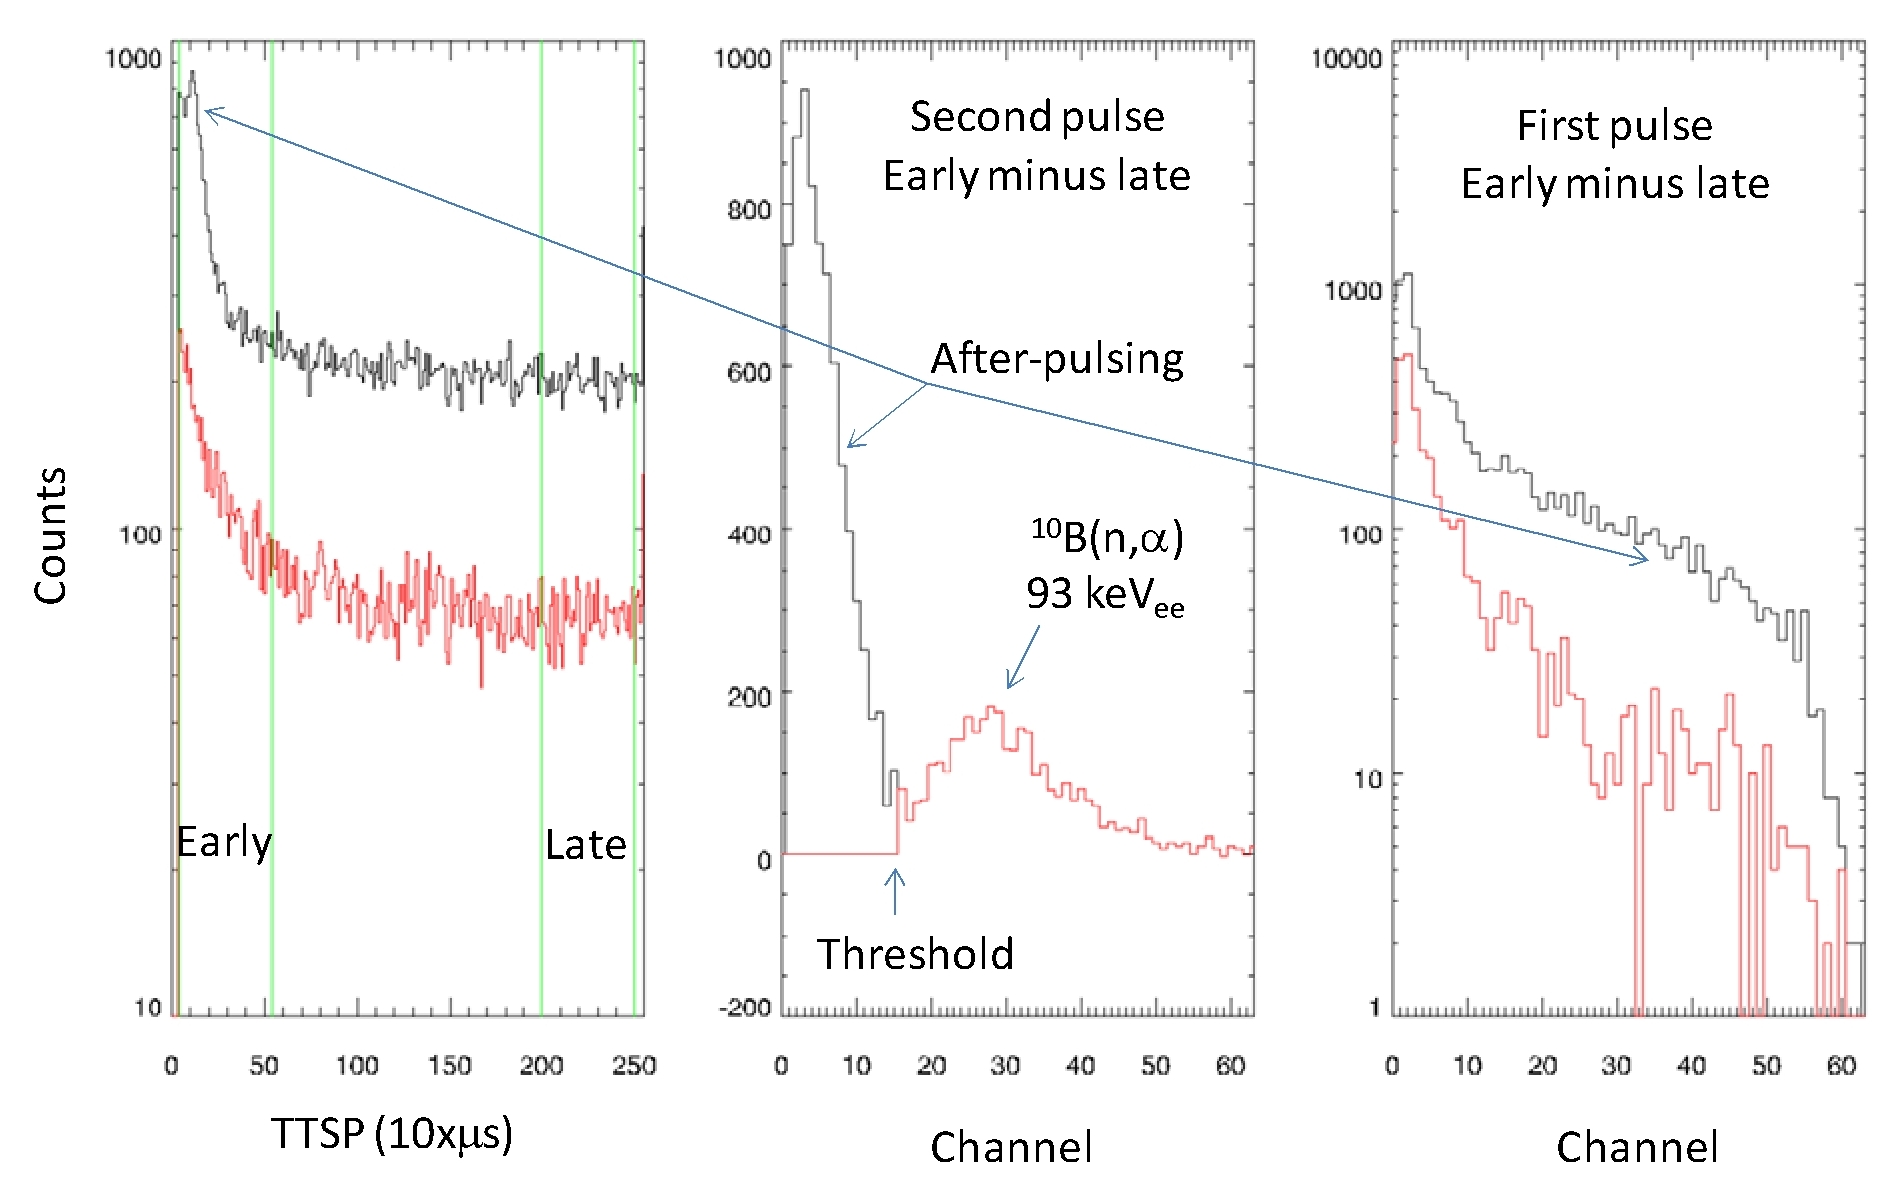
FIGURE 16. FAST NEUTRON (CAT4) PROCESSING
(left to right) The time to second pulse spectra, the second pulse spectrum, and
first pulse spectrum are shown for the -Y BLP scintillator for events
accumulated during Mars flyby. Early and late time windows used to remove
accidental coincidences are shown (green vertical lines in the time to second
pulse (TTSP) spectrum). The black spectra include all of the events recorded for
the -YBLP. The red spectra are corrected for after-pulsing by setting a
threshold below the 98 keVee peak in the second pulse spectrum. A
comparison between the first pulse spectra shows that the correction removes
high energy events, which is consistent with the mechanism for after pulsing in
which a high energy interaction ionizes trace gasses in the scintillator
resulting in a second, low-amplitude pulse.
After-pulsing produces low amplitude second pulses, which are easily distinguished from pulses produced by neutrons undergoing the 10B(n,α) reaction. After-pulsing events can be eliminated by ignoring events for which the amplitude of the second pulse is less than a threshold determined from the second pulse spectrum. The thresholds used here were channels 13, 15,15, 14 for the +Z, Y, +Y, and -Z BLP sensors, respectively.
Note that only events for which the first and second interaction have non-zero pulse amplitudes are included in the histograms. In order to determine counting rates, the fast neutron histograms are multiplied by a factor, given by the ratio of the scaler counting rate for CAT4 interactions divided by the number of events recorded for the selected prism. The fast counting rate for each prism is obtained by summing the histogram from channels 2 to 40 (the first two channels are excluded along with channels 41-63). The fast neutron time series (DTS) counting data for all four BLP scintillators is shown in obtained by summing the histogram from channels 2 to 40 (the first two channels are excluded along with channels 41-63). The fast neutron time series (DTS) counting data for all four BLP scintillators is shown in Figure 17.
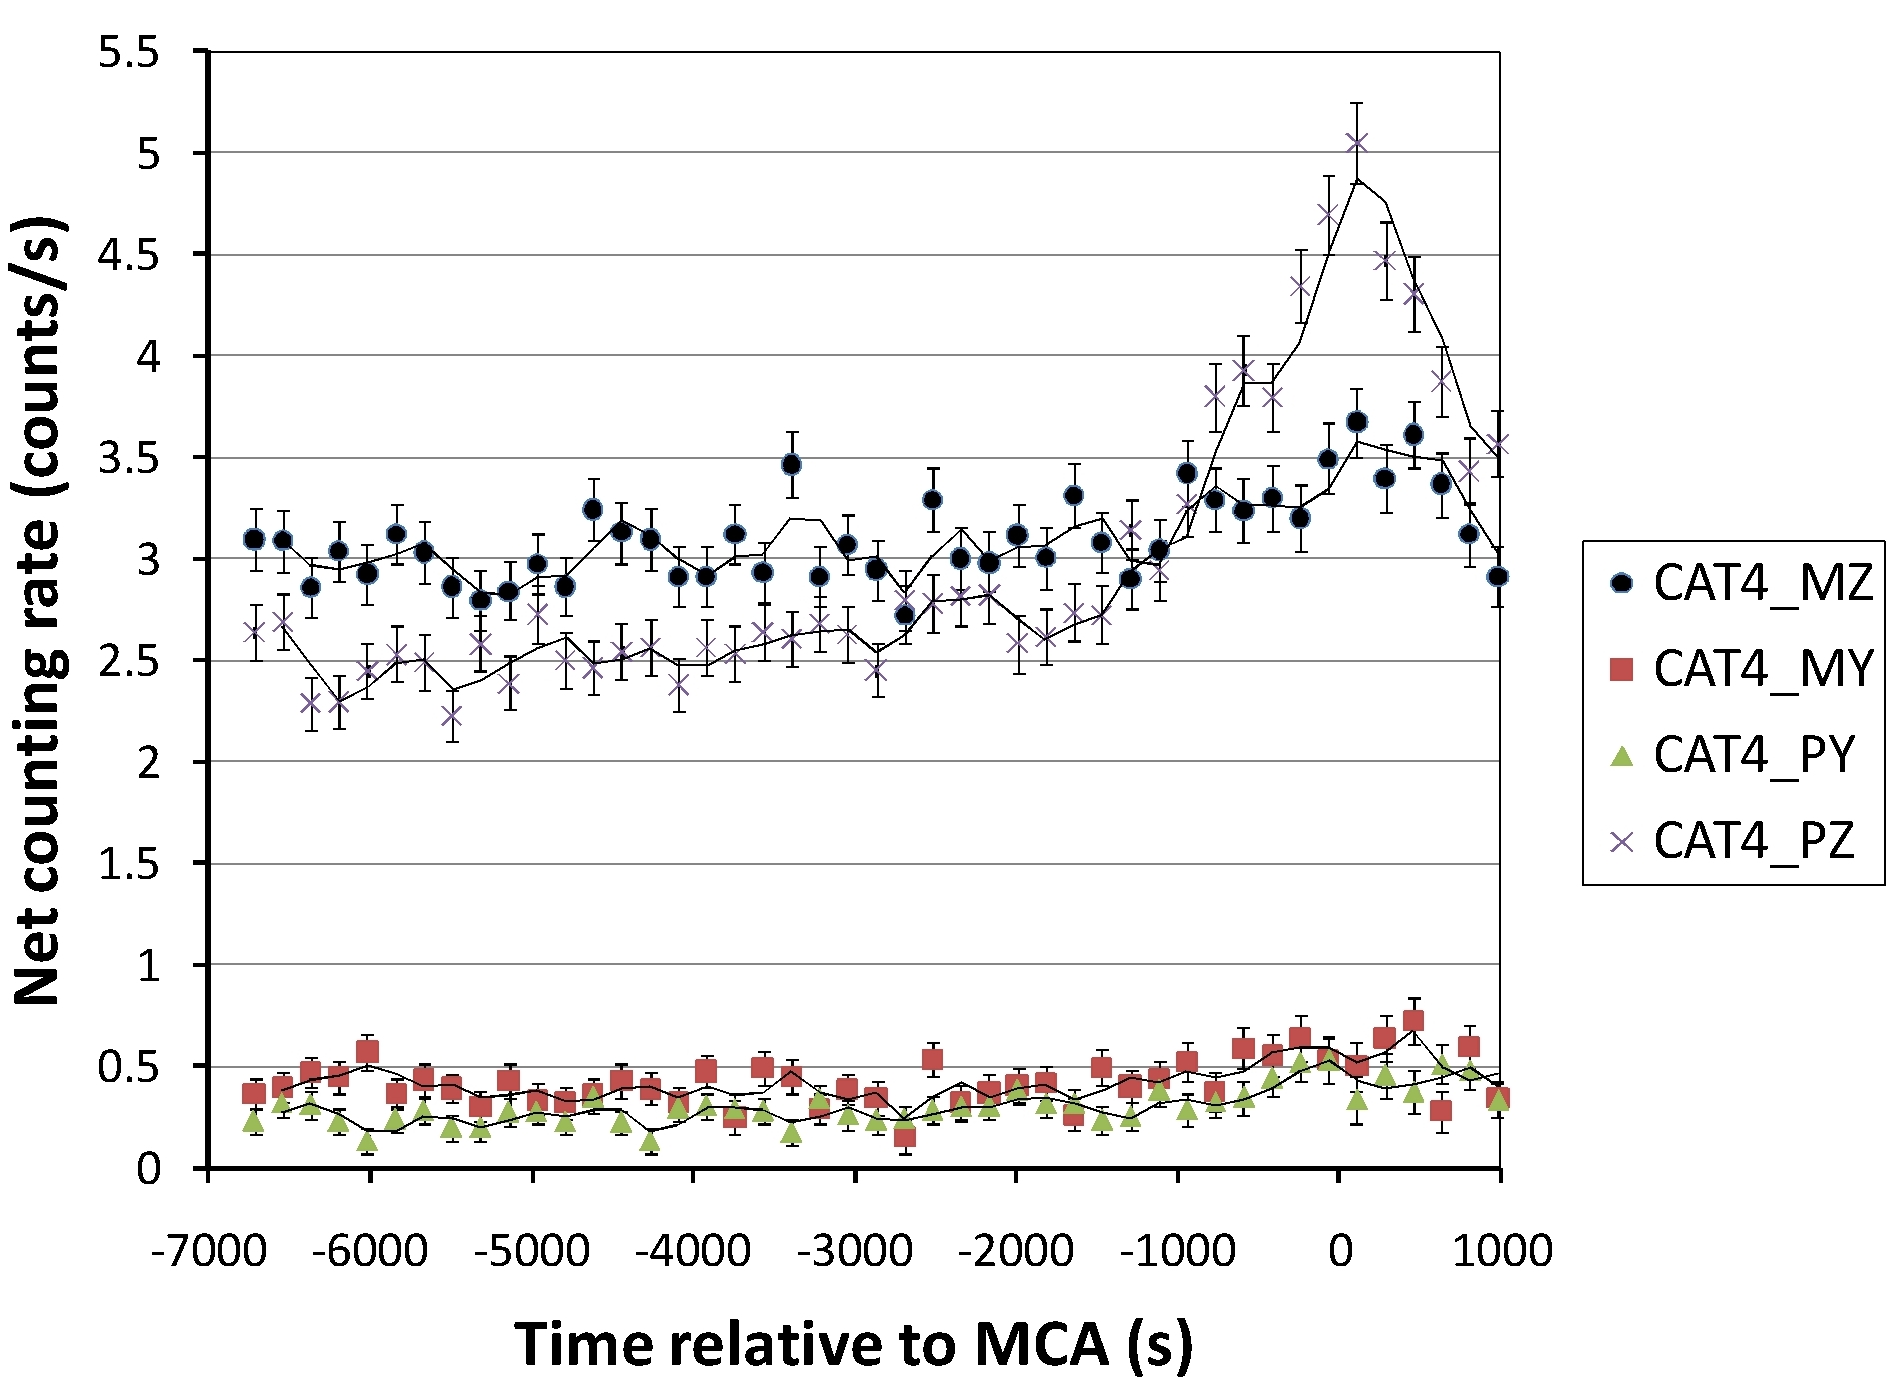
Figure 17. Time series CAT4 (fast neutron) counting rates for Mars flyby
CAT9 PROCESSING: BGO PULSE HEIGHT SPECTRUM
The CAT9 1024 channel histograms for single interactions with the BGO scintillator were processed to Level1b, energy-calibrated pulse height spectra using the following steps:
    1. Correction for differential nonlinearity;

    2. Identification of peaks using spectra averaged over long time periods
       (Figure 18);

    3. Linear energy calibration;

    4. Gain and offset correction to place the BGO pulse height spectrum on a
       common energy scale (offset of 0 keV and gain of 8.9 keV/channel);

    5. Extraction of net counting rates for selected peaks using the LINEAR
       two-background region method.
The gain and offset correction was based on an algorithm developed for Mars Odyssey (Prettyman, Delapp, Feldman, & Maurice, 2004). A time series of pulse height spectra and selected net counting rates are included in the Level1b data. The time series (DTS)for the net peak area (counting rate) for the 511 keV gamma ray is shown in Figure 19.
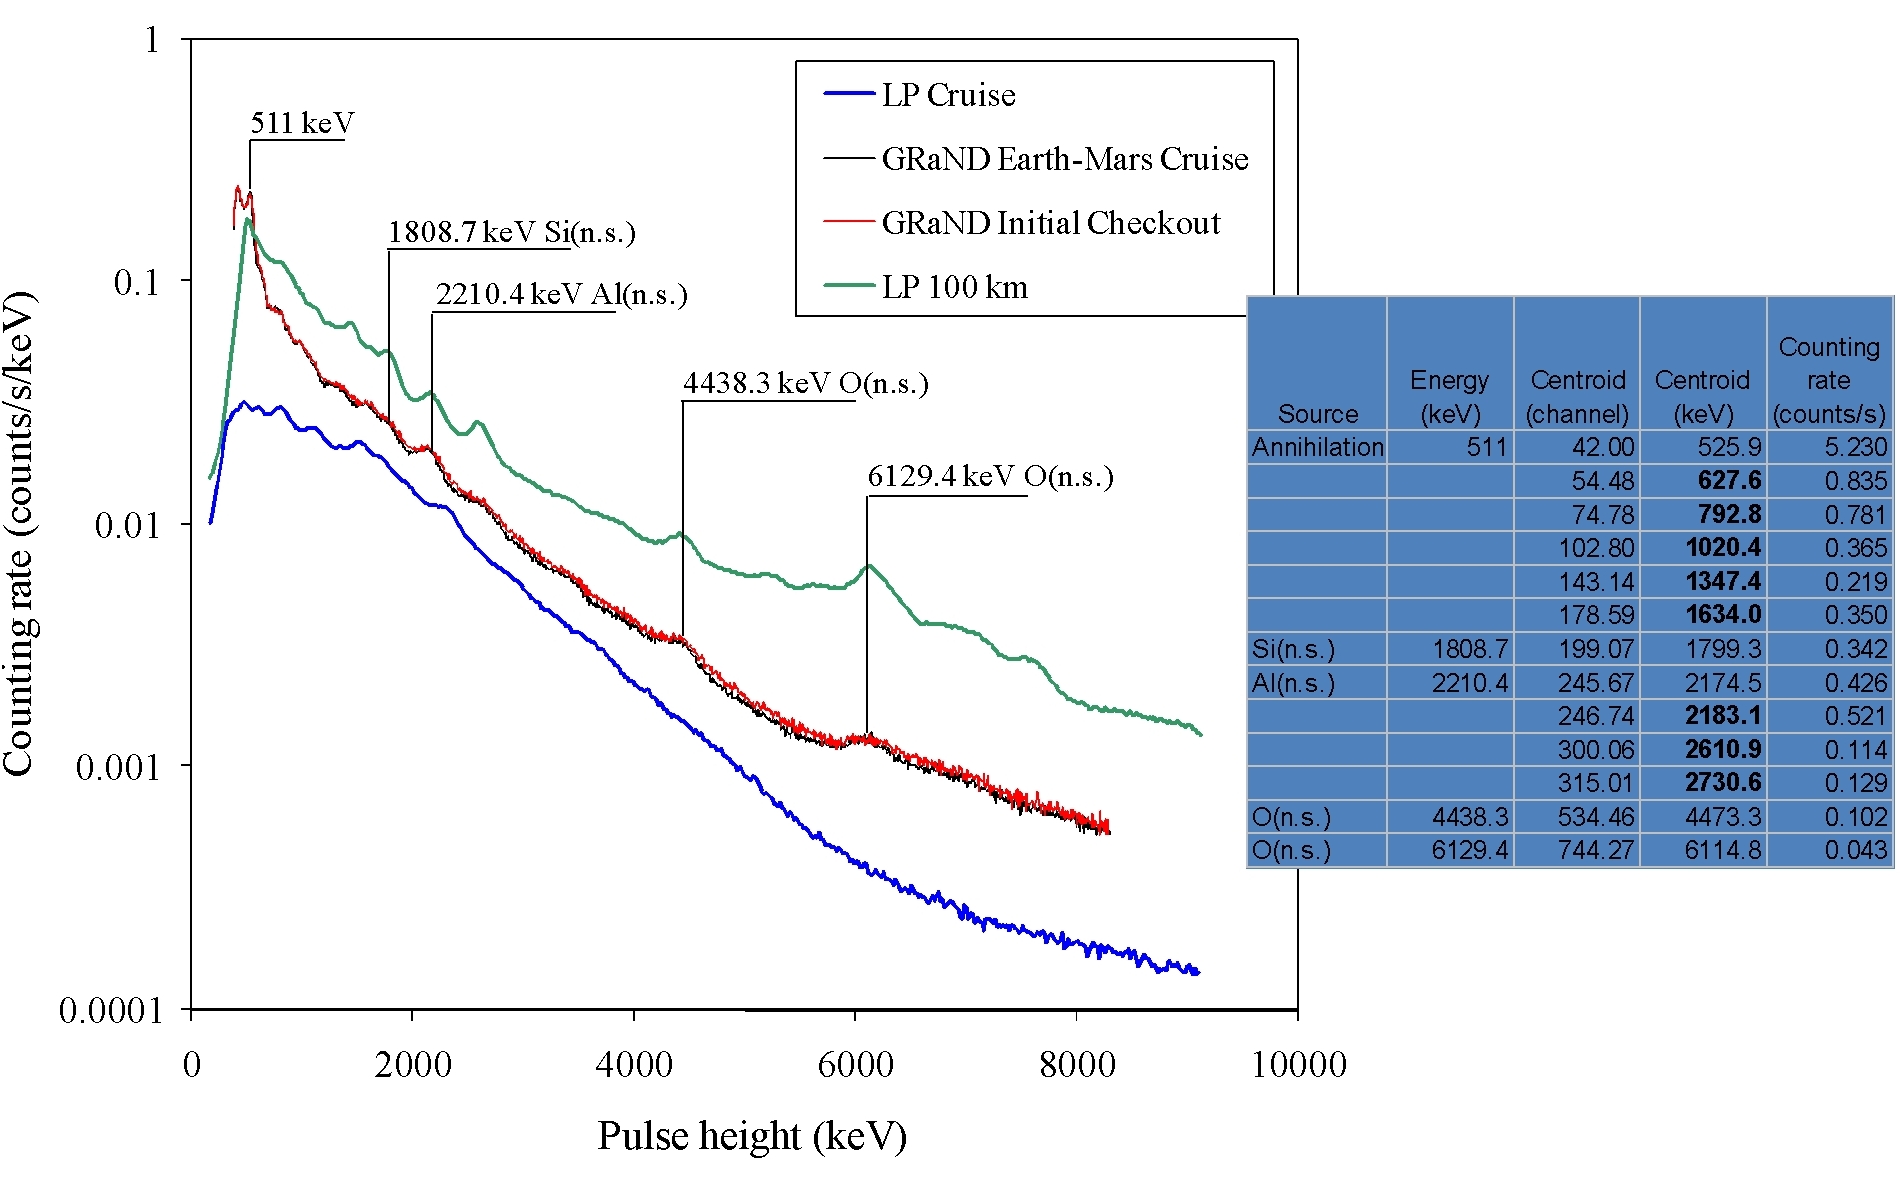
FIGURE 18. BGO ENERGY CALIBRATION.
Pulse height spectra measured by GRaND's BGO scintillator during Earth-Mars
cruise are compared to LP gamma ray spectra (BGO) acquired during cruise and
science data acquisition at 100 km. Note the increased counting rates for the
deck-mounted GRaND in comparison to the boom-mounted Lunar Prospector gamma ray
spectrometer. Peaks in the pulse height spectra measured by GRaND that were
detected and analyzed using GPA are listed in the accompanying table.
Identified peaks are labeled.
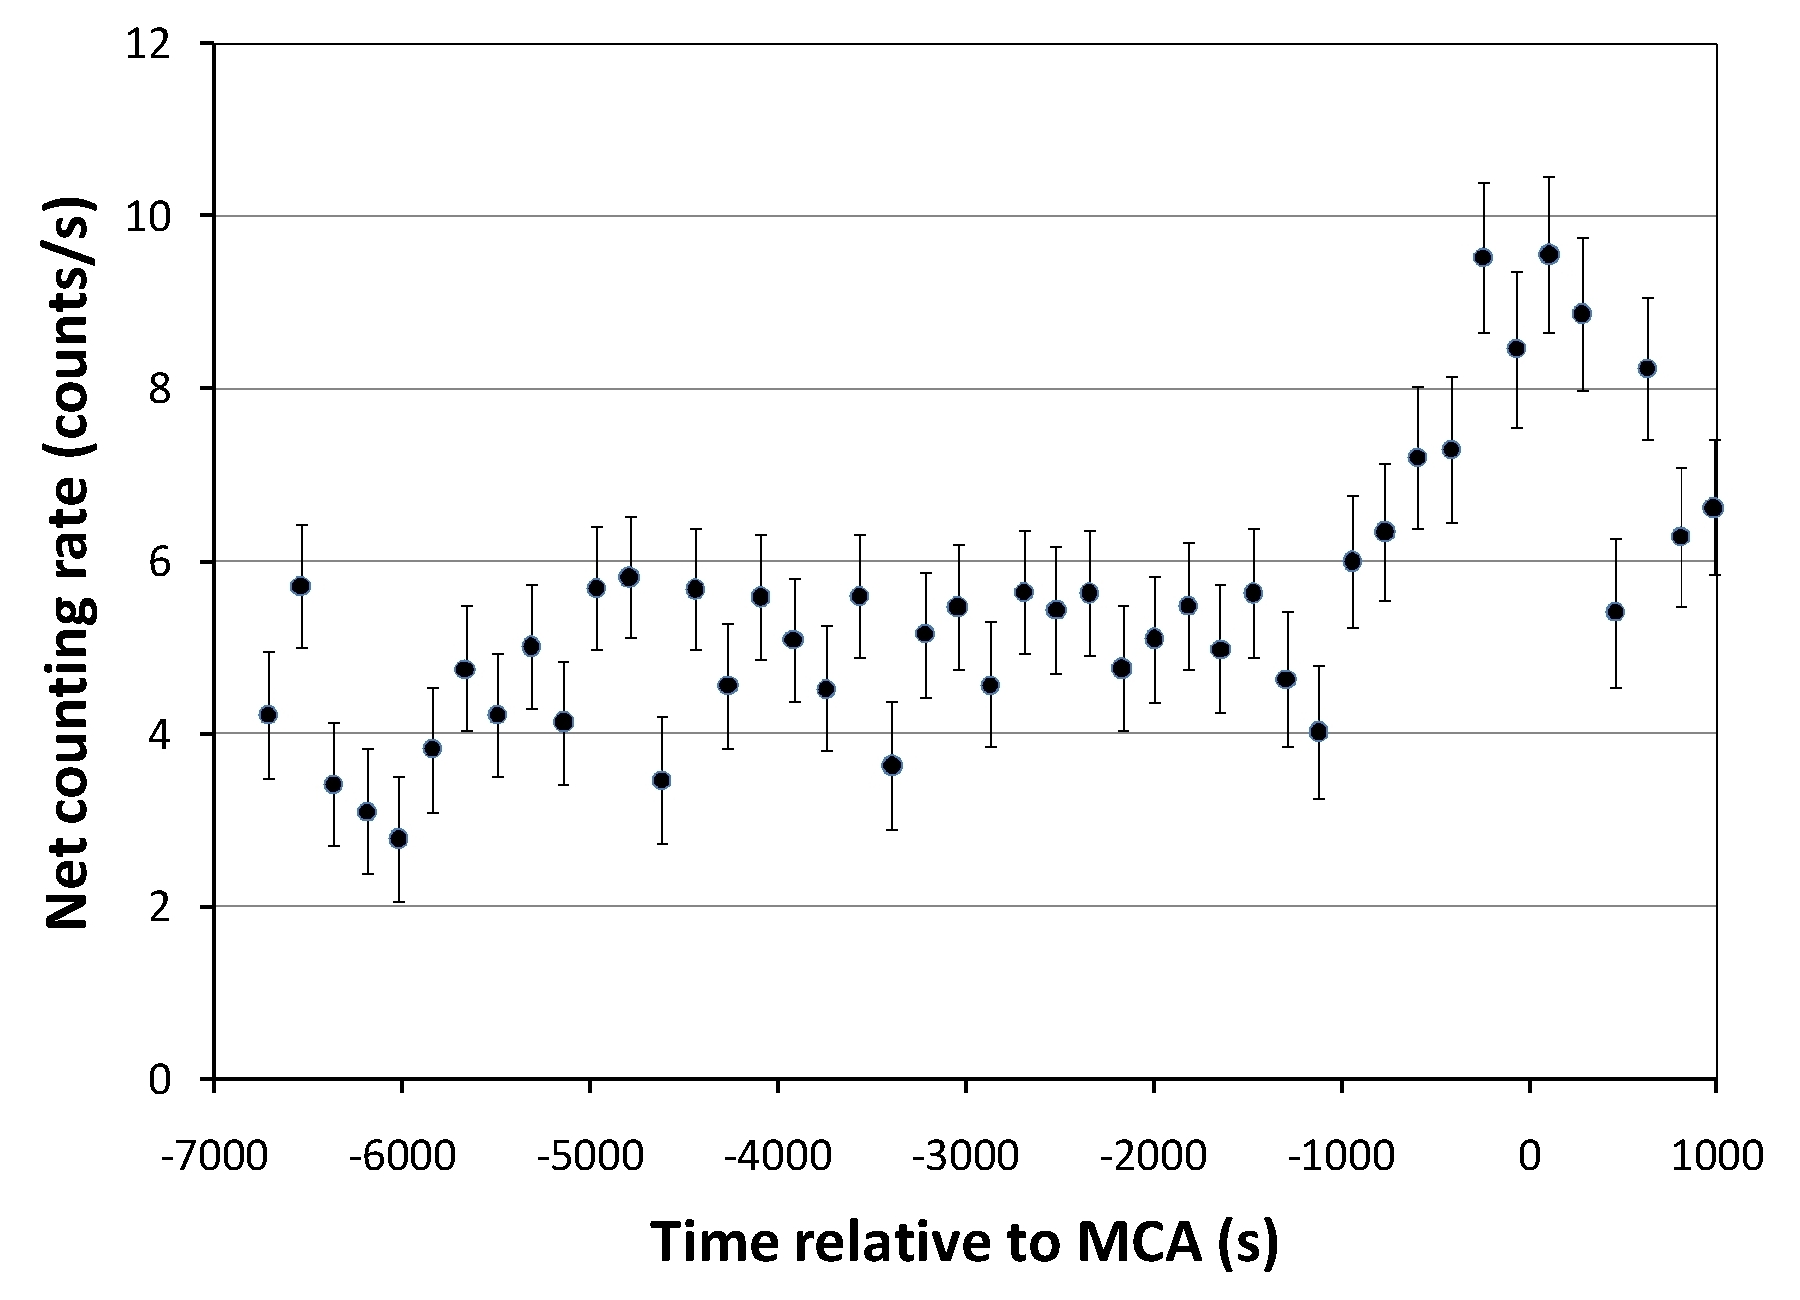
FIGURE 19. TIME SERIES COUNTING RATES FOR THE 511 KEV GAMMA RAY (BGO) FOR MARS FLYBY
CAT7 AND CAT10 EVENT PROCESSING
The CZT counting data are contained in the gamma ray event buffer. The instrument was configured to record up to 3876 (MG, see Table 2) gamma ray events per science interval. Each event gives the integer ID (0-15) of the CZT sensor that recorded the event, the amplitude of the CZT pulse (0 - 2048) and the amplitude of the pulse recorded by the BGO if any( 0 - 512). Cases in which the BGO pulse amplitude is non-zero are categorized as CAT7 (coincidence between a single CZT sensor and the BGO scintillator). Cases in which the BGO pulse amplitude is 0 when the CZT amplitude is non-zero are categorized as CAT10 (interaction with a single CZT sensor). The portion of the event buffer reserved for CAT10 events is commandable, given by M10(Table 2). The balance (M7 = MG - M10) is reserved for CAT7 events. GRaND was initially configured to acquire up to 3375 CAT10 events and 1 CAT7 event. On approach to Mars (2009-02- 12), the CAT10 buffer allocation was reduced to 3376 events in order to allow up to 501 CAT7 events to be recorded (see Table 6).
The processing steps for determining cumulative, energy-calibrated CAT10CZT spectra are:
    1. Construct histograms (2048-channel) for each of the CZT sensors from the
       event data;

    2. Collapse the spectra to 1024 channels and apply a correction for
       differential nonlinearity;

    3. Apply again and offset correction to put all of the spectra on the same
       energy scale, using calibration data acquired during ground calibration;

    4. Normalize the spectra using the scaler data to determine the absolute
       counting rate;

    5. Sum the gain-corrected spectrum to form a cumulative spectrum
       representative of the entire array;
The following CZT IDs are typically included in the sum:[0, 2, 3, 4, 5, 6, 7, 8, 9, 10,11, 14]. Note that CZT1 was inadvertently disabled in the FPGA software, and it was not possible to correct the software prior to delivery. CZT12 is a high gain channel that is not included in the sum. CZT13 produces a continuum spectrum and was turned off during ground testing and flight. CZT9 malfunctioned following the annealing demonstration in DC041, and, as of 2010- 07-21, CZT9 may not be usable (see the DC041 Activity Report, included in this archive, for a description of the problem).
A cumulative spectrum for CAT10 is shown in Figure 20 for events accumulated during ground testing. The source is a uranium ore (carnotite). Prominent lines from 214Bi (from the uranium series) are easily identified. Note that the low energy threshold is at about 300 keV.
Cumulative spectra for CAT10 are shown in Figure 21 for events accumulated during ICO and later, during Mars fly by. In both spectra, the 511 keV peak is visible in addition to a broad peak at higher energy. In addition, counts appear in the region below the 300 keV threshold (see the laboratory spectrum in Figure 20). The 511 keV peak has broadened throughout cruise due to radiation damage. Consequently, the array may be annealed prior to Vesta encounter.
The origin of the sub-threshold counts is presently unknown, but may be caused by the response of the shaper to high energy events. The broad peak centered at about 1.6MeV maybe caused by high energy protons that can traverse individual CZT sensors without triggering anti-coincidence with surrounding sensors. For example, such particles can enter through gaps in the anticoincidence shield passing through the edges and corners of individual CZT sensors (see Figure 22 Figure1). Both features were absent during laboratory testing and ATLO and, therefore, may be associated with the space environment; however, further analysis is needed in order to determine their origin. Hypotheses under consideration for the origin of the broad peak include:
    1. Summing of gamma ray cascades produced within the crystals (e.g. induced
       by neutron interactions);

    2. Charged particle interactions that trigger individual CZT sensors;

    3. Electronic artifacts (associated with very high energy deposition in the
       detector array or long rise time proton pulses), or a malfunctioning
       electrical component or subsystem;
The first hypothesis can be ruled out because the broad peak does not appear at the same energy in all of the detectors (Figure 23). If this peak was produced by gamma ray summing, then it would appear at the same average energy in every sensor. Rather, the location of the broad peak varies from sensor to senor. The observed variability could be caused by the interaction of energetic charged particles such as protons with individual CZT sensors, for which the energy deposited depends on the chord length of the proton track through the CZT sensors and surrounding materials. The geometry of GRaND is such that the average chord lengths would be different depending on the location of the detector in the array; however, the counting rate expected for protons interacting with individual CZT sensors without triggering anticoincidence estimated to be an order of magnitude lower than observed. Finally, during instrument development, electronic artifacts arose from timing problems between the CZT multiplexor and the FPGA, resulting in a malfunction in the baseline restorer. For a portion of events, the baseline did not return to zero. This resulted in "ghost peaks" that appeared above the full energy peak. The problem was eliminated for gamma rays, which have a very short rise time; however, the system was not tested with protons, which would produce long pulses (on the order of the drift time from cathode to anode). It is conceivable that long pulses might result in similar behavior (leaving the baseline greater than zero). Subsequent single interaction events could be shifted to higher pulse heights, resulting in the broad feature.
Currently, Level1b data are produced for the CZT array; however, they are not presently included in the Level1b data set for Mars Gravity Assist. Future versions of the Level1b data will include the CZT spectrum and selected peak areas.
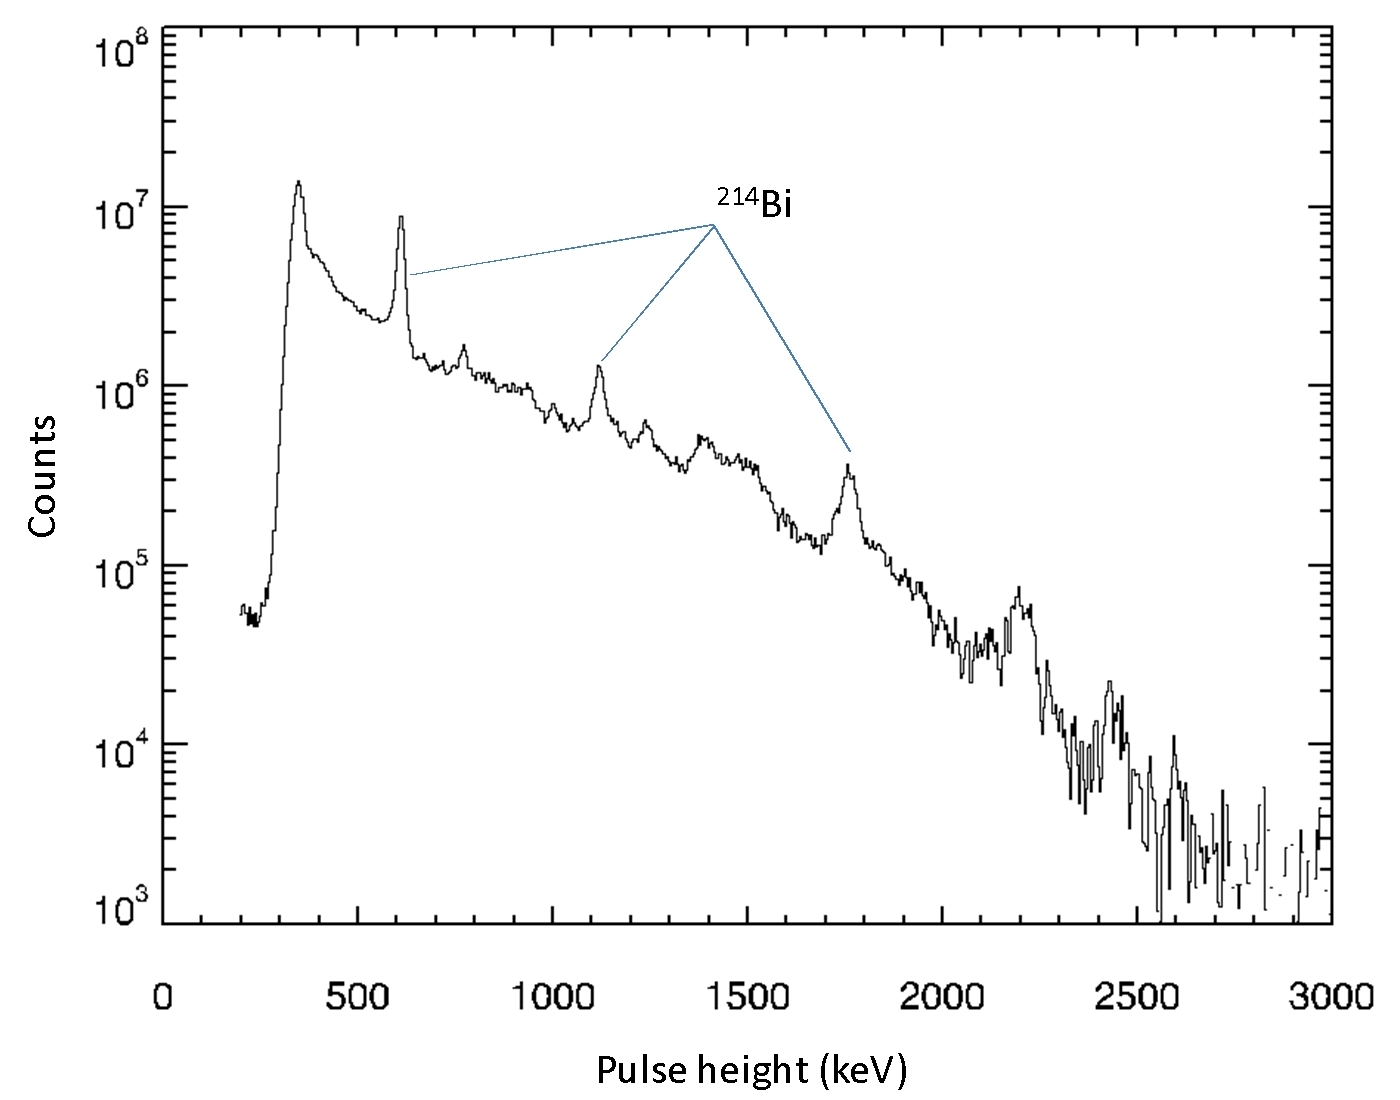
FIGURE 20. CUMULATIVE CZT PULSE HEIGHT SPECTRUM: CARNOTITE
The cumulative pulse height spectrum for carnotite (auranium ore) measured in
the laboratory.
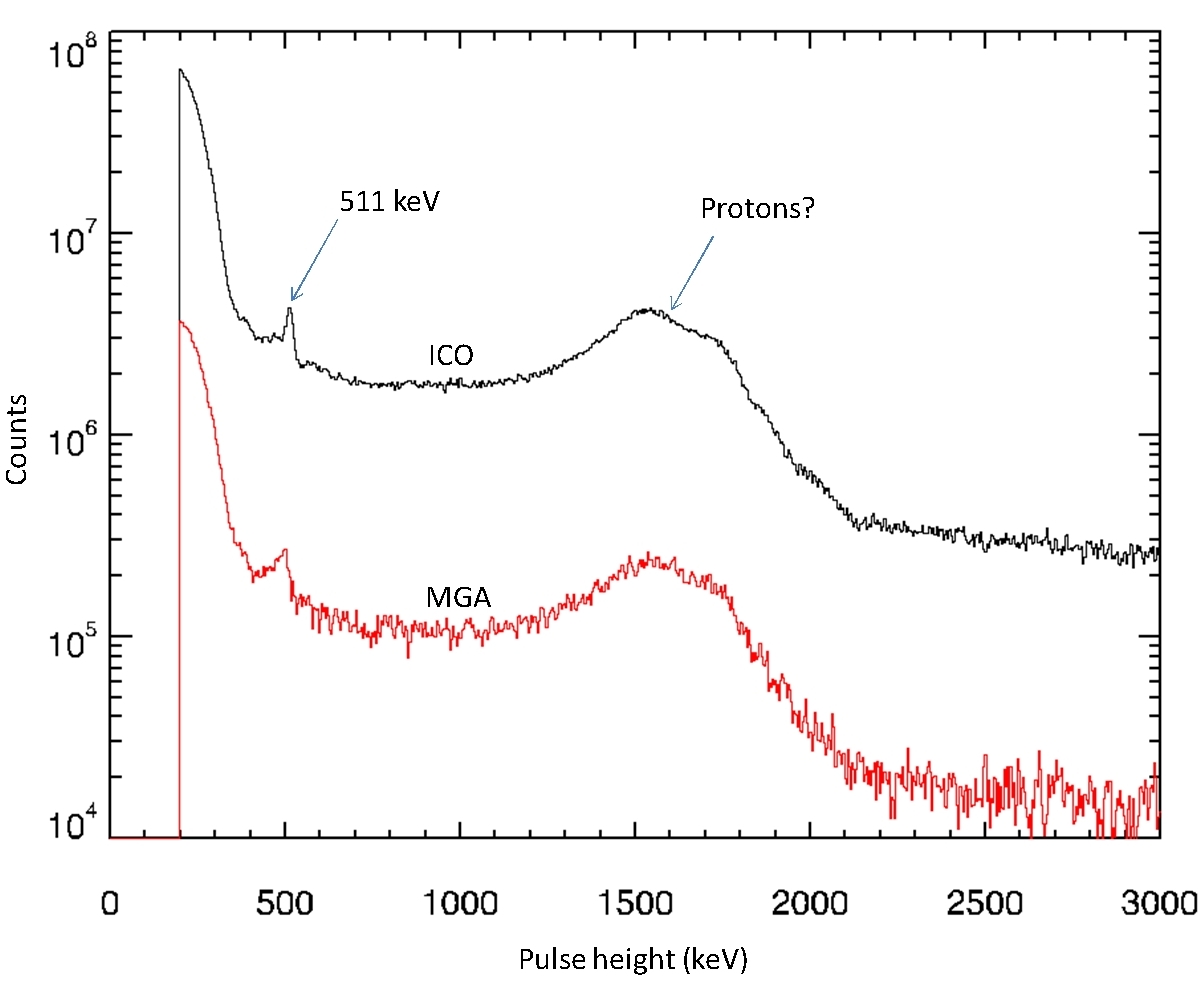
FIGURE 21. CUMULATIVE CZT PULSE HEIGHT SPECTRUM: ICO AND MGA
The cumulative pulse height spectra measured during ICO and MGA is shown. The
accumulation time for the ICO spectrum was longer than that of MGA, which accounts
for the difference in total counts.
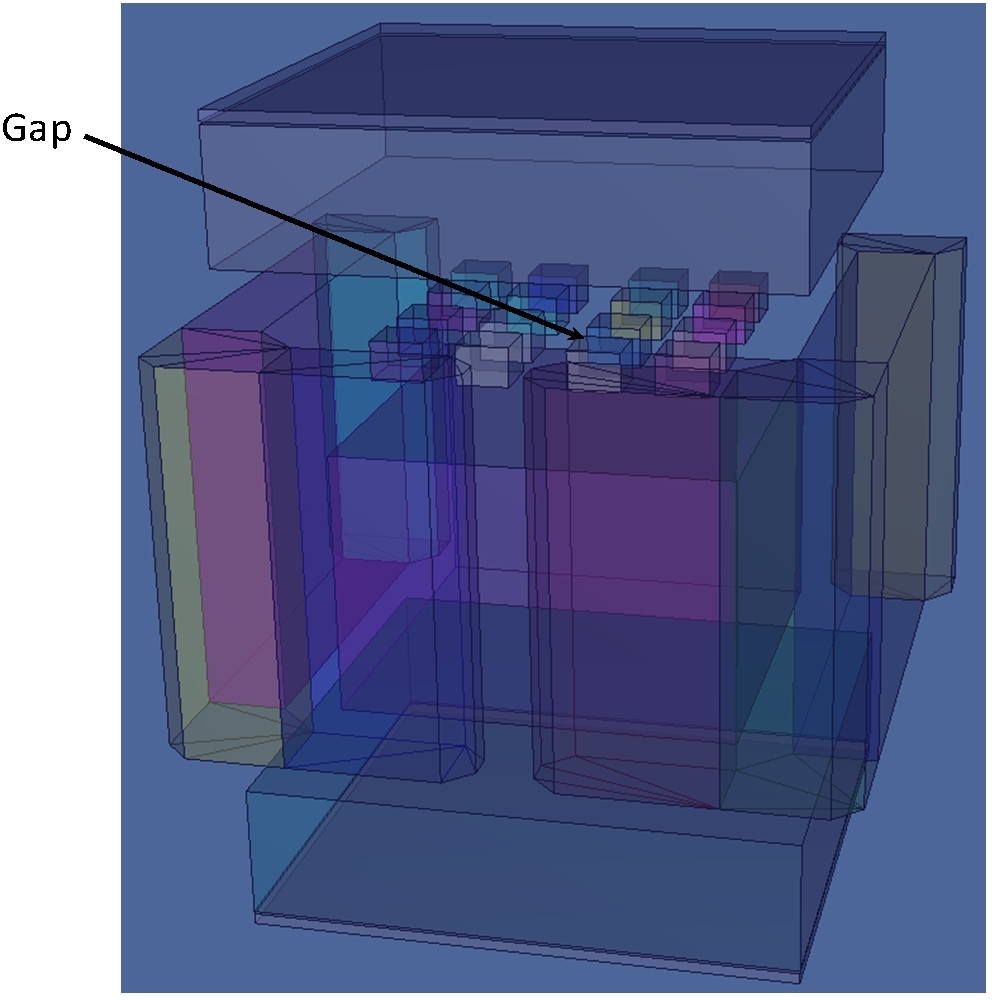
FIGURE 22. VIEW THROUGH SENSOR ASSEMBLY
A view through a gap in the anti-coincidence shield reveals exposed portions of
the CZT sensors (mainly edges and corners) through which charged particles can
pass without interacting with other sensors.
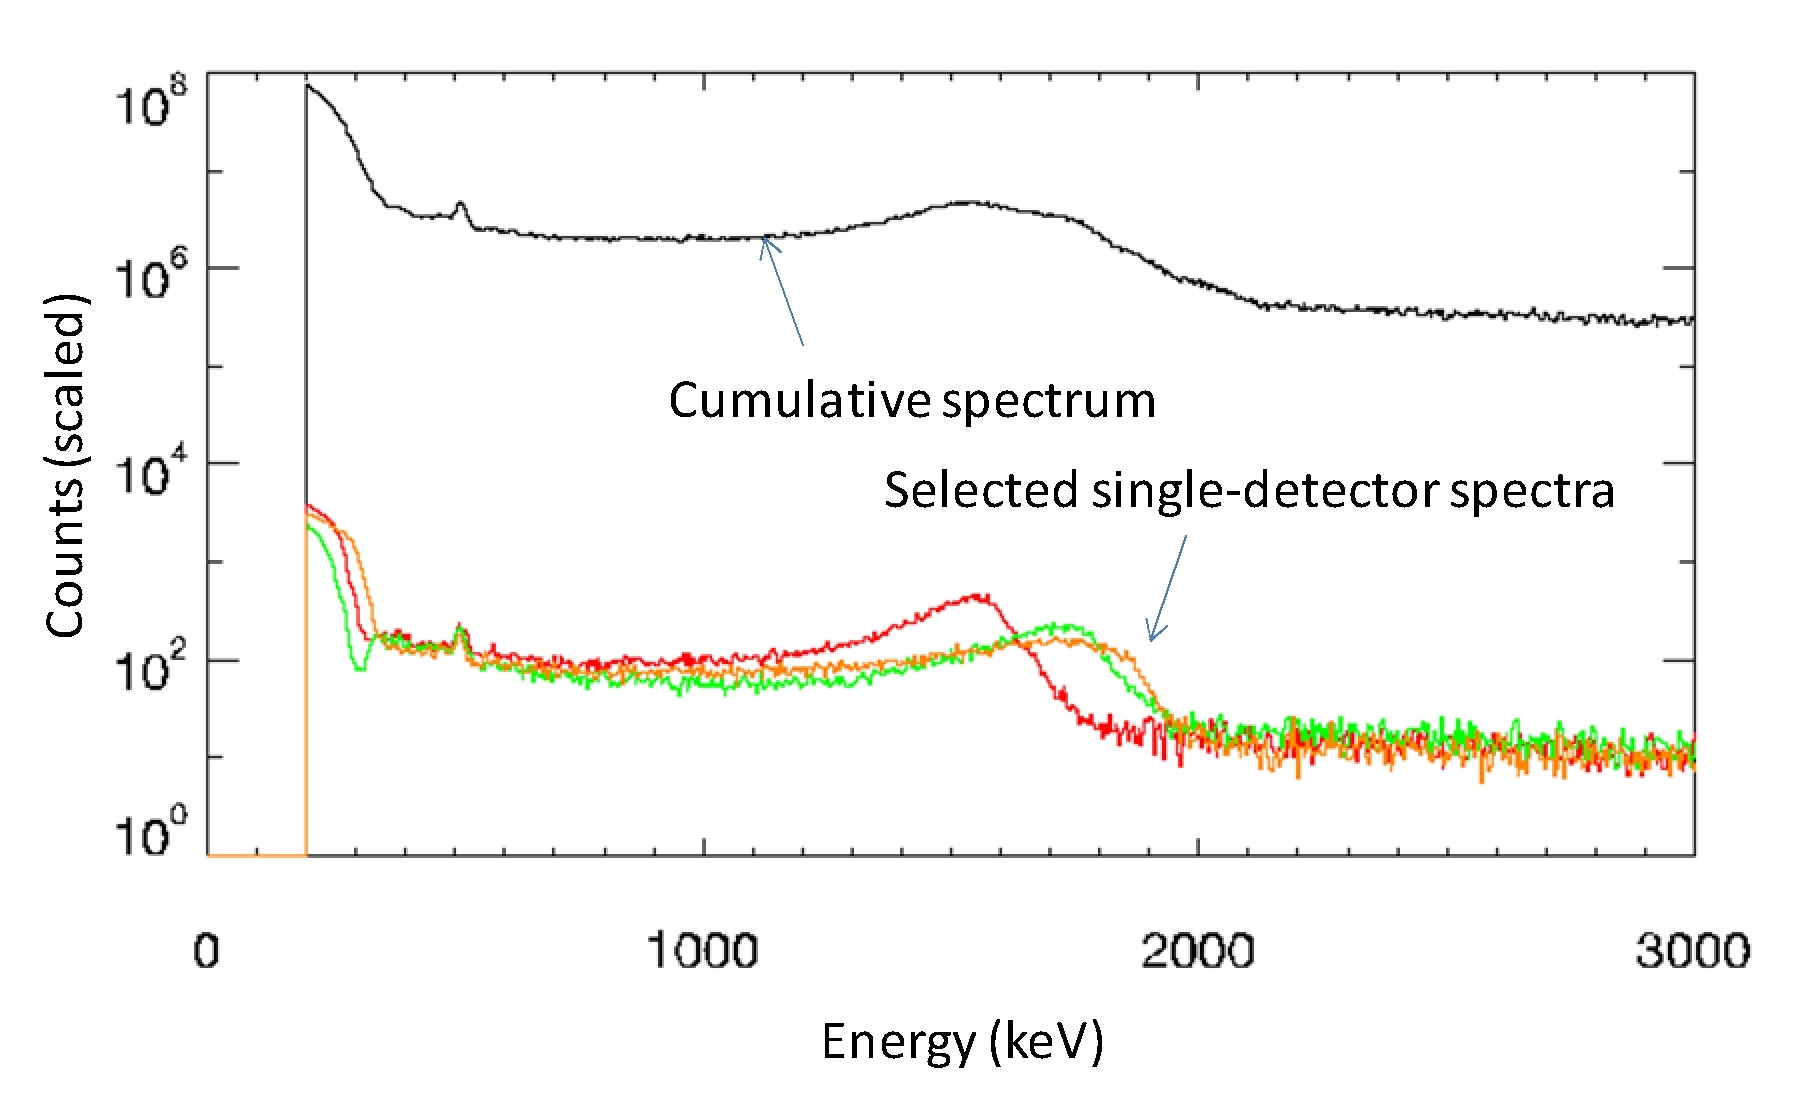
FIGURE 23. COMPONENT CZT SPECTRA
Selected spectra for individual CZT sensors are compared to the cumulative
spectrum.
The CAT7 spectra can be used for pair spectroscopy and to select events originating from the asteroid using the energy-angle relationship for Compton scattering. Three CAT7 data products are illustrated (see Figure 24. gamma ray categories recorded in the event buffer Figure 24 for an example): BGO pair spectrum; CZT pair spectrum; Compton telescope spectrum. All of the products require the calculation of the energy of the gamma ray from the event data. The event's pulse amplitude (channel number, i)is converted to energy by randomly sampling a value wξ + i, where w is the width of channel i (which equals 1 when the channel width is uniform - no differential nonlinearity), and ξ is a uniform random number on the interval [0,1). This generates a continuous channel number which is converted to an energy using the sensor's (CZT or BGO) energy calibration parameters. This approach accounts for the differential nonlinearity of the ADC if needed and, more importantly eliminates "picket fence" artifacts that can occur when discrete channel values are used.
BGO pair spectrum analysis:
CZT pair spectrum analysis:
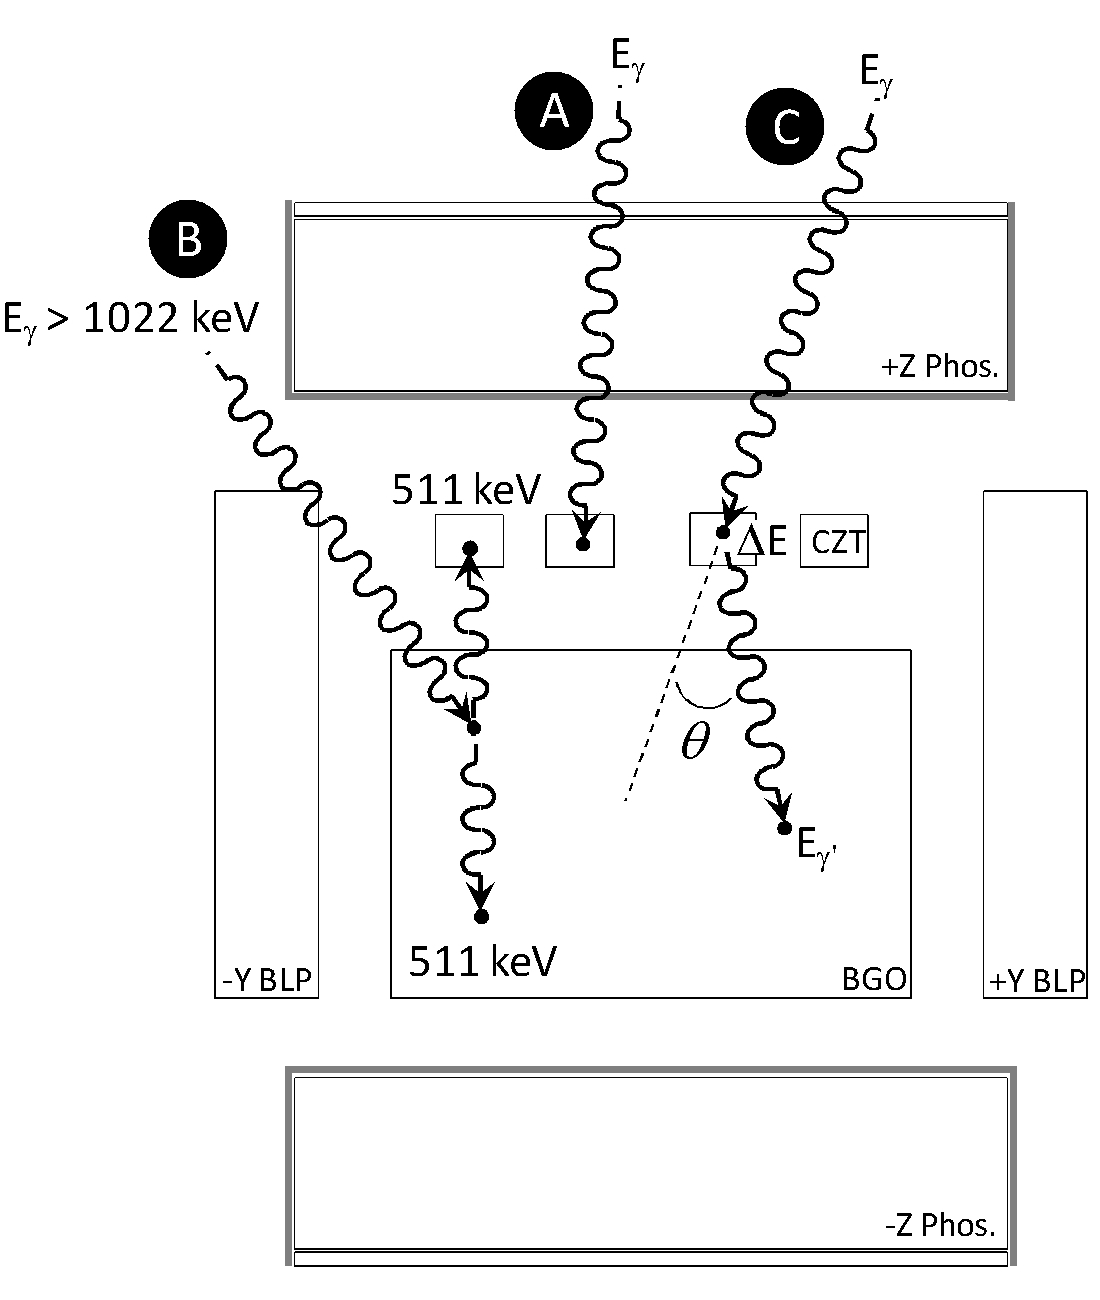
FIGURE 24. GAMMA RAY CATEGORIES RECORDED IN THE EVENT BUFFER
Example events are superimposed on a cross sectional of the GRaND sensors (YZ
plane). In each case, Eγ is the energy of the incident gamma
ray: A) CAT10, a single interaction with a CZT sensor; B) CAT7 pair
spectroscopy, in which 511 keV (annihilation gamma ray from pair production in
the BGO sensor) is deposited in a CZT sensor and the balance (for example,
Eγ - 511 keV) is deposited in the BGO sensor (alternatively, a
pair spectrum can be formed for the CZT array by windowing about the 511 keV
peak in BGO); C) CAT7 Compton telescope, in which a gamma ray undergoes a single
Compton scatter through an angle θ depositing ΔE in one of the CZT
sensors and the scattered gamma ray deposits its energy (Eγ')
in the BGO sensor. The incident gamma ray energy is given by
Eγ = Eγ'> + ΔE. The Compton energy-angle
relationship can be used to reject events originating from the spacecraft.
Examples of pair spectra measured by GRaND are shown in Figure 25. Note that the ghost peak does not appear in the CZT pair spectrum. The 2223 keV peak from neutron capture with H is just visible. Because the CZT array is well-shielded from the spacecraft, CZT-BGO pair spectra may provide a relatively low signal- to-noise measurement of Vesta's gamma ray leakage spectrum in comparison to the BGO and CZT singles spectra.
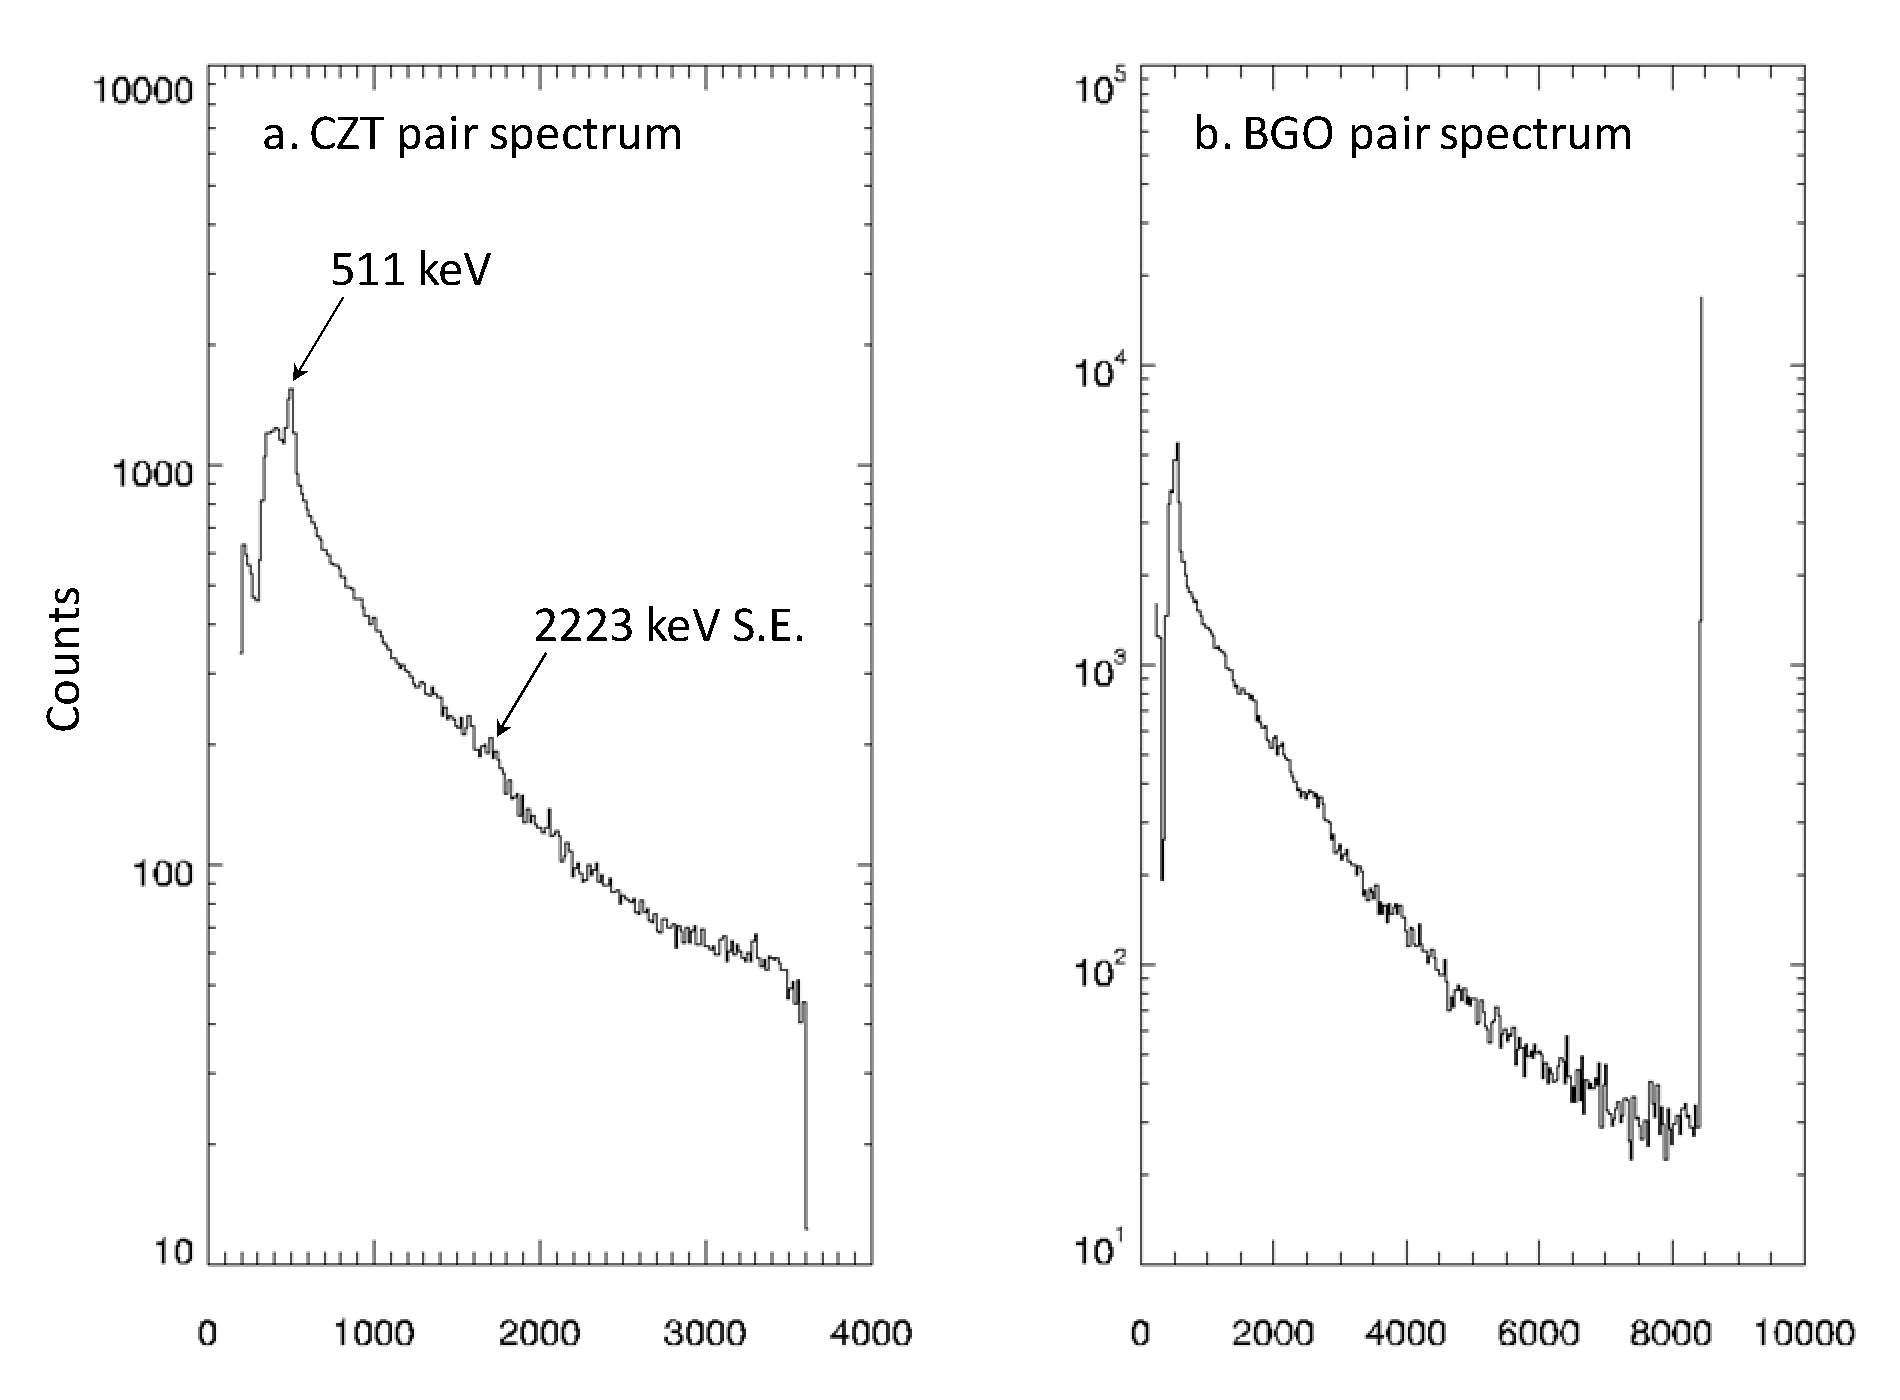
FIGURE 25. PAIR SPECTROMETRY CZT and BGO pair spectra accumulated during cruise. Data from MGA\09047_dawn\, MGA\09048_dawn\, MGA\09051_dawn\, MGA\09071_dawn\, MGA\09078_dawn\ were combined.
IDL functions were created to read the L1A science and state-of-health data and are included in the PDS distribution. These are intended to illustrate the L1A data for users and are not part of the L1B production pipeline. The function that reads science data converts the CZT and fast neutron event data into histograms, which could be a confusing and tedious process for user's starting from scratch. The L1B data are ASCII tables, which are easily ingested by widely- used, spread-sheet programs (e.g. Excel, KaleidoGraph, etc...). Additional modules for processing and visualizing the L1A data will be provided in future releases. The L1A IDL software includes the following routines:
Usage and examples are included in the code documentation.
Data acquired by GRaND during cruise and Mars flyby are useful for instrument calibration as well as characterization of the energetic particle background during periods of low solar activity, which are representative of data used for mapping (solar energetic particle events are excluded). The close fly by of Mars by Dawn provided a valuable data set that can be compared directly to data acquired by the Mars Odyssey Gamma ray and Neutron Spectrometer subsystems, enabling cross-calibration of GRaND with Mars Odyssey (Prettyman, 2010, Prettyman et al., 2011). The data were also used to evaluate different mapping scenarios at Vesta and Ceres, to determine the sensitivity of GRaND to different compositional models and to develop algorithms for mapping.
Mars flyby occurred at LS = 212° during mid autumn in the northern hemisphere (Figure26. MCA diagram). The seasonal cap in the northern hemisphere was thin. At high northern latitudes, the neutron spectrometers (GRaND and Mars Odyssey) were primarily sensitive to the water-rich regolith.
Data acquired up to S/C entry into safe-mode, which occurred after Mars Closest Approach (MCA) at an altitude of 3000 km. MCA was about 550 km. GRaND got close enough to Mars to see neutrons and gamma rays. About 16 min were spent below 1000 km and the S/C was nadir-pointing to within about 10° up to MCA. The space background environment was quiet, ideal for science data acquisition. The spacecraft ground track and the field of view of GRaND is superimposed on a map of the epithermal neutron counting rate measured by the Odyssey neutron spectrometer in Figure 26. The region sampled by GRaND extends from the water- rich northern high latitudes through the relatively water-poor Tharsis region.
QUALITATIVE COMPARISON
Is GRaND sensitive to variations in surface composition? We compared data acquired by GRaND for altitudes less than 1000 km for the +Z CAT1 6Li(n,t) reaction counting rate and the +Z CAT4 fast neutron counting rate (Figure 27) to mapped thermal and fast neutron counting data acquired by Odyssey. The CAT1signature is primarily sensitive to thermal neutrons. Odyssey measures fast neutrons using the same process (BLP double pulse) as GRaND. So, the fast neutron counting rates can also be compared. The GRaND data were corrected for altitude (solid angle) and the angle of the instrument relative to nadir, which affects the response of the instrument. The corrections neglected a number of important effects, including the details of neutron transport (ballistic trajectories, decay), the relative motion of the spacecraft, and the instrument response function, which are treated in the following section. These effects were included in the analysis presented by Prettyman et al. (2011). A qualitative comparison between GRaND and Odyssey counting rates is presented here (Prettyman et al., 2009).
The corrected counting rates were compared to Odyssey mapped counting rates averaged over the footprint of GRaND. A weighted average that accounts for the GRaND's response as a function of angle was used. The corrected counting rates are strongly correlated with the Odyssey footprint averaged counting rates (Figure28). In addition, the variation of GRaND counting rates with latitude is the same as that measured by Odyssey (after applying a linear stretch to the Odyssey data). The latitude variation measured by GRaND is controlled primarily by the abundance of water equivalent hydrogen (WEH). High abundances of WEH near the poles lead to suppressed thermal and epithermal counting rates relative to the relatively WEH-poor mid latitudes.
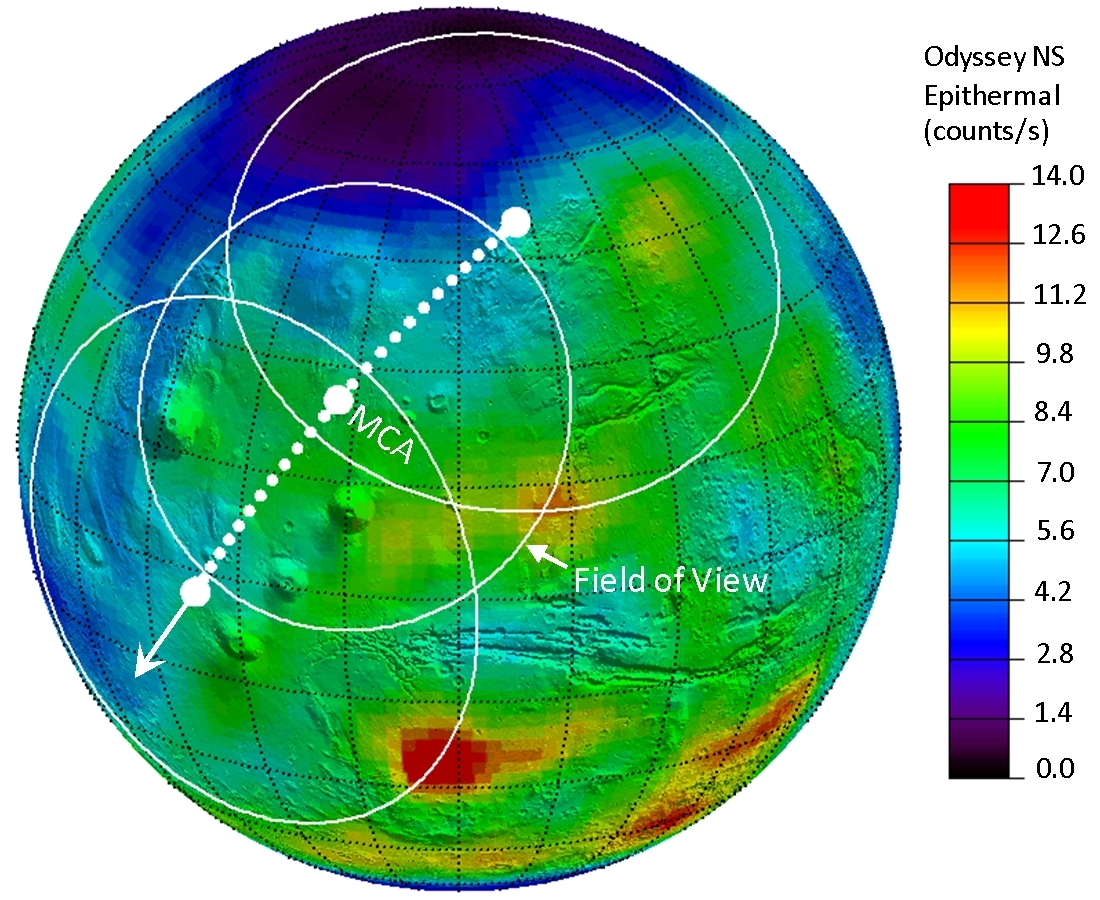
FIGURE 26. MCA DIAGRAM
The subsatellite point of the Dawn spacecraft (white points) and the GRaND field
of view is shown (white circles) during MCA for points below 1000 km. The field
of view of GRaND is shown as circles for the first and last subsatellite point
and for MCA. Note that the field of view decrease with altitude. The data are
superimposed on a seasonal map of Mars for a 10° LS interval that
includes LS=212°.
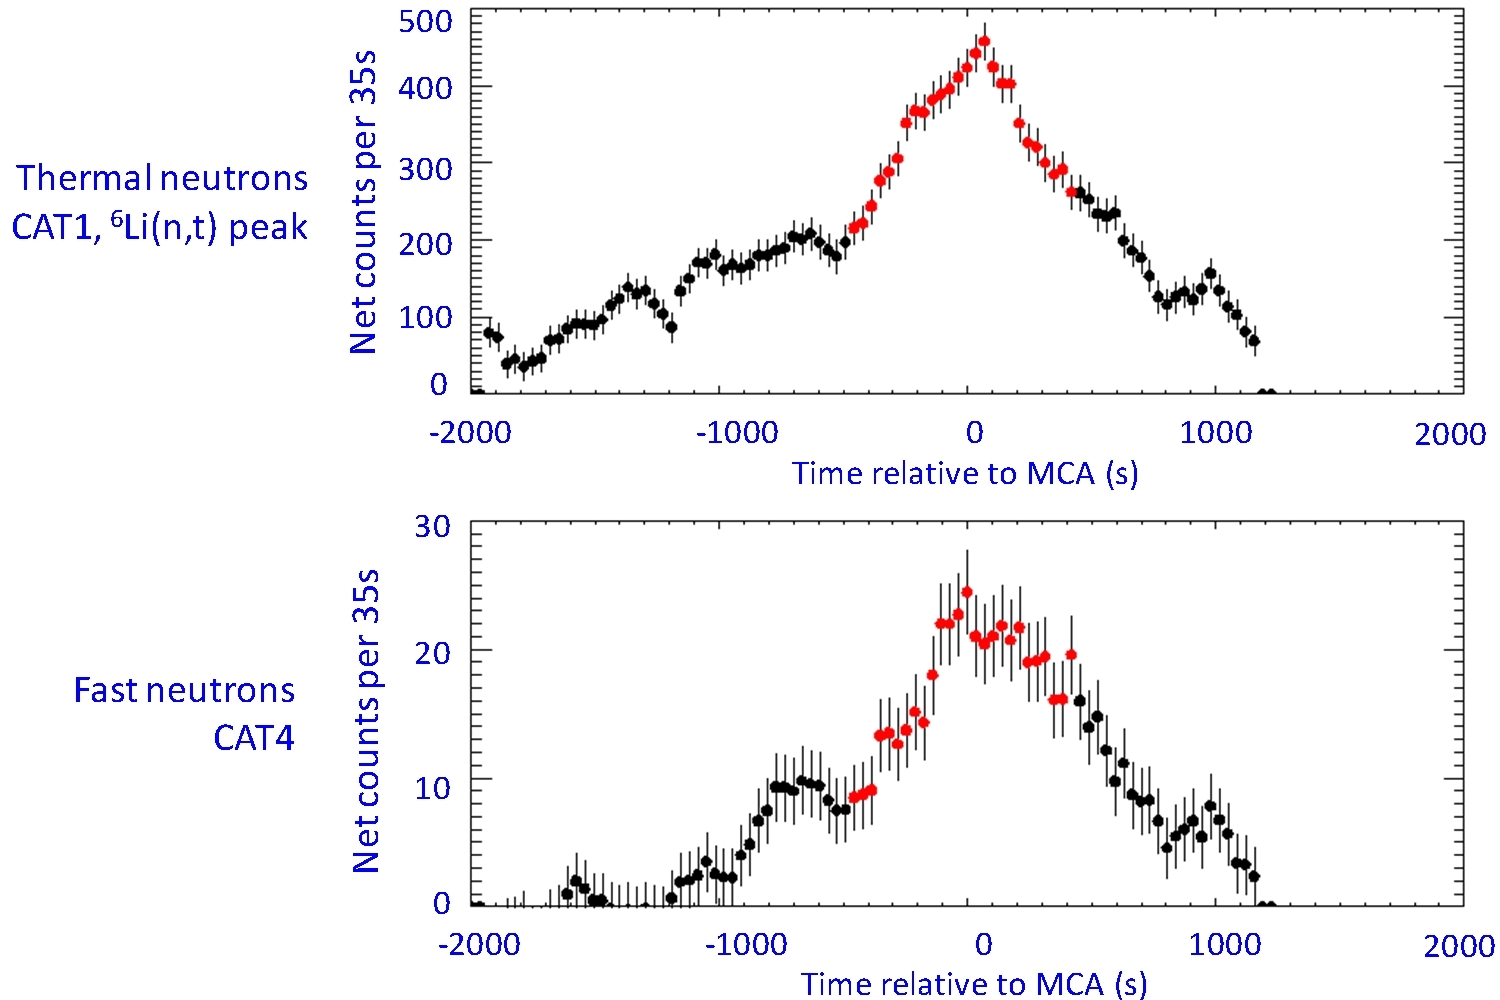
FIGURE 27. COUNTING RATES NEAR CLOSEST APPROACH
CAT1 counting rates measured by GRaND near MCA. The red points were acquired
within 1000 km of Mars. Note that fast neutron counting rates are for events
only and have not been normalized to the scaler data. Note also that the CAT1,
6Li(n,t) peak counts contain a small admixture of epithermal.
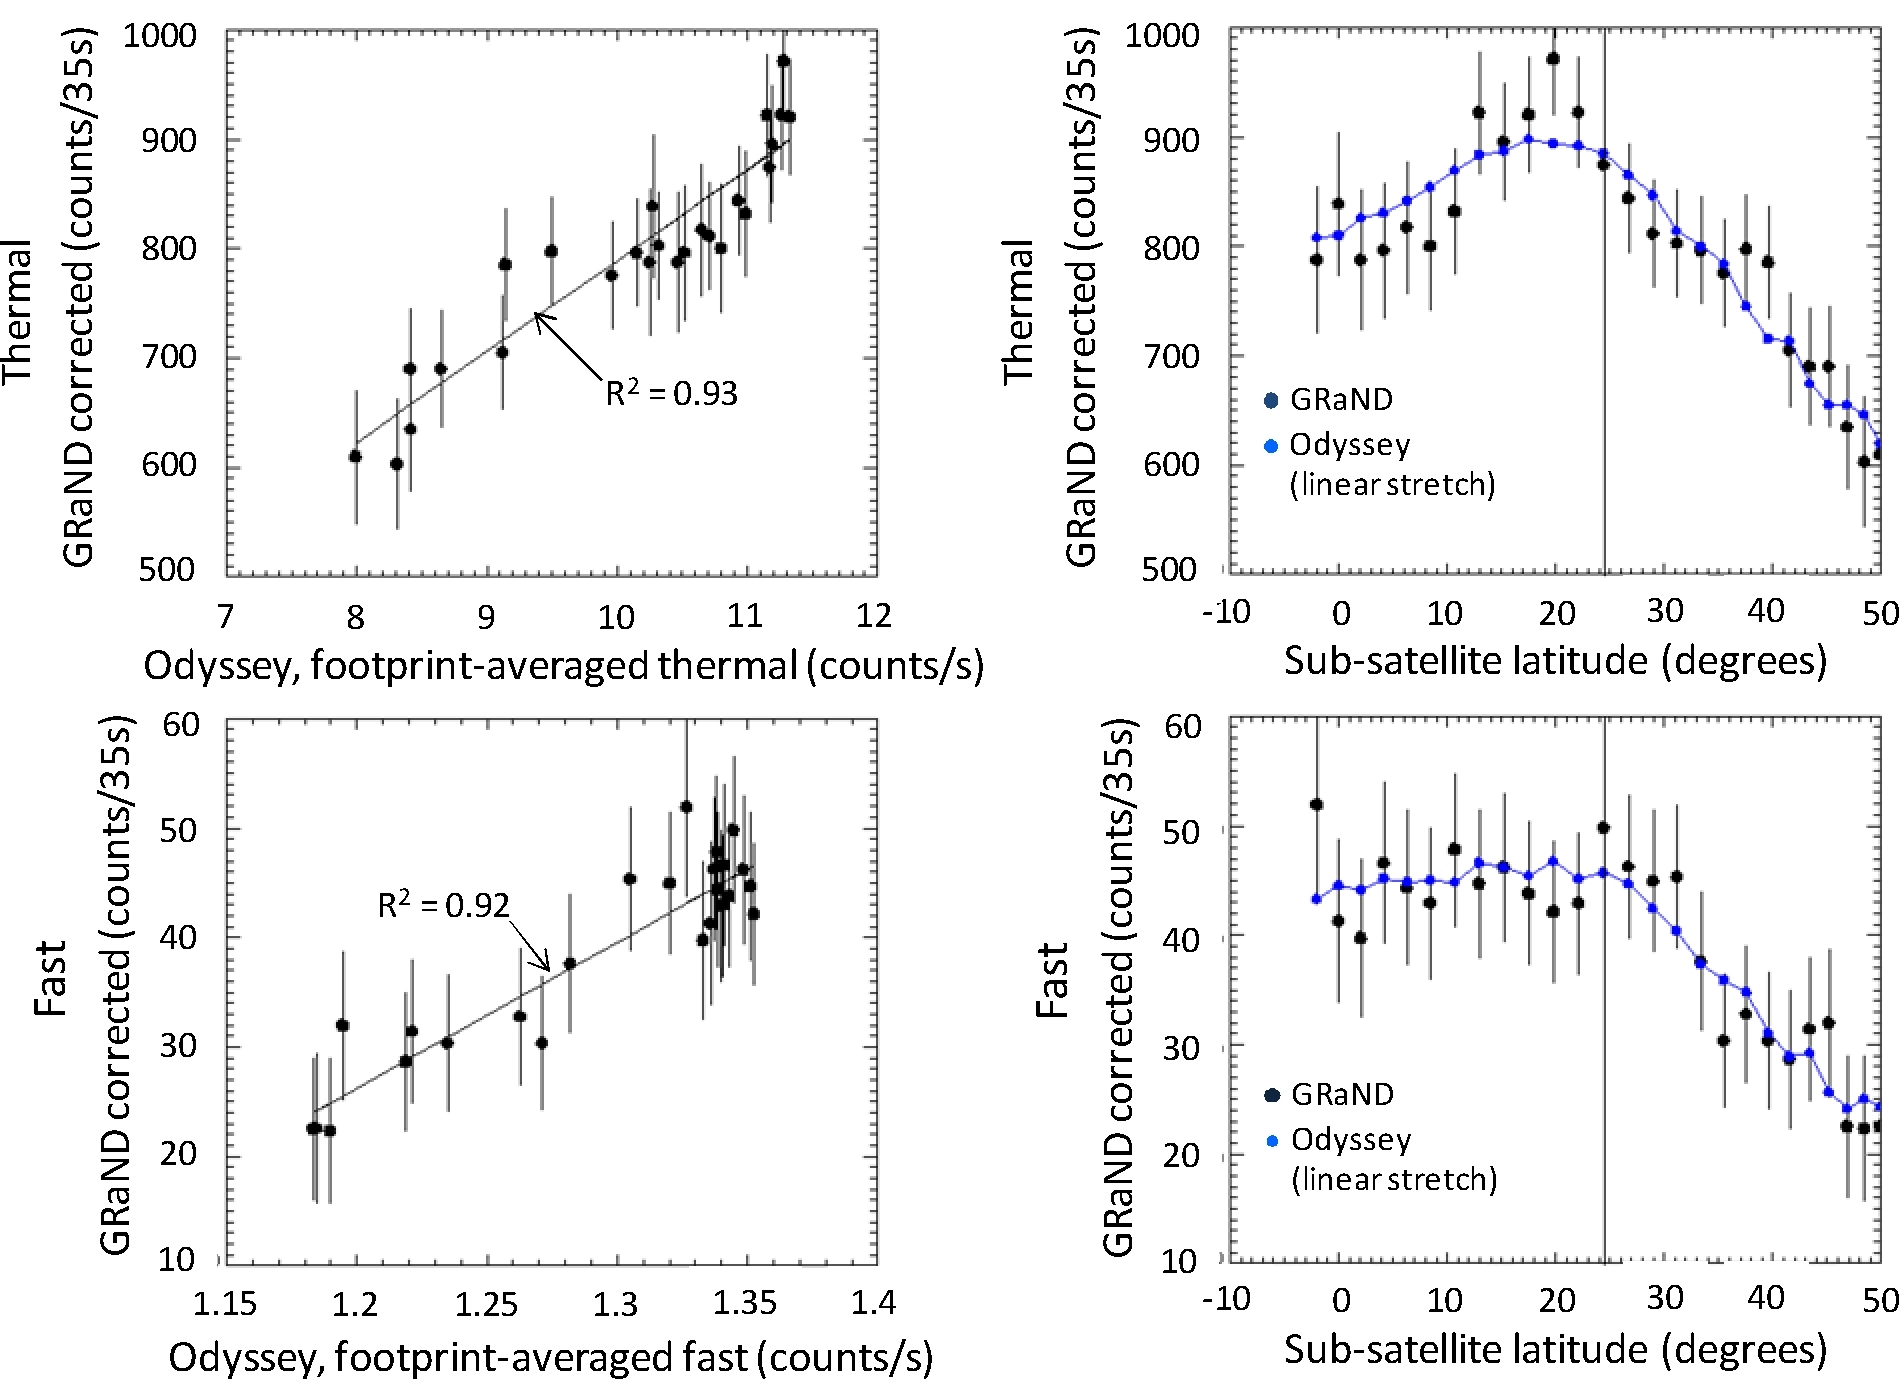
FIGURE 28. COMPARISON OF GRAND TO ODYSSEY
(left to right) Counting rates corrected for solid angle and altitude are
plotted against Odyssey data averaged over the footprint of GRaND. The GRaND
and Odyssey data (modified by a linear stretch) are compared as a function of
latitude.
Acton, C. H. (1996). Ancillary data services of NASA's Navigation and Ancillary Information Facility Ancillary Information Facility. Planetary and Space Science, 44 (1), 65-70.
Boynton, W. V., Feldman, W., Mitrofanov, I., & [26]co-authors. (2004). The Mars Odyssey gamma-ray spectrometer instrument suite. Space Science Reviews , 110 (1-2), 37-83.
Feldman, W. C., Drake, D. M., O, Dell, R.D., Brinkley,F., & Anderson, R. C. (1989b). Gravitational effects on planetary neutron flux spectra. J. Geophys. Res., 94 (B1), 513-525.
Feldman, W., Auchampaugh, G., & Drake, D. (1989). A technique to measure the neutron lifetime from low-earth orbit. Nuclear Instruments and Methods in Physics Research, A287, 595-605.
Feldman, W., Ahola, K., Barraclough, B., & [14]co-authors. (2004). Gamma- ray, neutron, and alpha-particle spectrometers for the Lunar Prospector mission. J. Geophys. Res. , vol. 109, E07S06, doi:10.1029/2003JE002207.
Lawrence, D. J., Maurice, S., & Feldman, W. C. (2004). Gamma-ray measurements from Lunar Prospector: Time series data reduction for the Gamma-Ray Spectrometer. J. Geophys. Res., 109, E07S05, doi:10.1029/2003JE002206.
Pelowitz, D. B. (2005). MCNPX User's Manual Version 2.5.0. Los Alamos Natl. Lab. Doc. LA-CP-05-0369, Los Alamos Natl. Lab., Los Alamos, N. M.
Prettyman, T. H. (2010). DAWN GRAND CALIBRATED MARS FLYBY COUNTS. V1.0. DAWN-M-GRAND-2-RDR-MARS-COUNTS-V1.0. NASA Planetary Data System.
Prettyman, T. H., Feldman, W. C., & McSween, H. Y. (2009). Geochemistry of Vesta and Ceres: In-flight calibration of Dawn's gamma ray and neutron detector. Geophysical Research Abstracts (EGU General Assembly 2009), 11, EGU2009-11816.
Prettyman, T.H., W.C. Feldman, F.P. Ameduri, B.L. Barraclough, E.W. Cascio, K.R. Fuller, H.O. Funsten, D.J. Lawrence, G.W. McKinney, C.T. Russell, S.A. Soldner, S.A. Storms, C. Szeles, and R.L. Tokar, Gamma-ray and neutron spectrometer for the Dawn mission to 1 Ceres and 4 Vesta, IEEE Trans. Nucl. Sci., Volume 50, Issue 4, pp. 1190-1197, August 2003, DOI 10.1109/TNS.2003.815156.
Prettyman, T. H., Feldman, W. C., Mellon, M. T., McKinney, G. W., Boynton, W. V., Karunatillake, S., et al. (2004). Composition and structure of the Martian surface at high southern latitudes from neutron spectroscopy. J. Geophys. Res., 109, E05001, doi:10.1029/2003JE002139.
Prettyman, T., Delapp, D., Feldman, W., & Maurice, S. (2004). Mars 2001 Odyssey Neutron Spectrometer Processing,Version 1.3. Planetary Data System document.
Prettyman, T.H., W.C. Feldman, H.Y. McSween, Jr., R.D. Dingler, D.C. Enemark, D.E. Patrick, S.A. Storms, J.S. Hendricks, J.P. Morgenthaler, K.M. Pitman, R.C. Reedy, Dawn's Gamma ray and Neutron Detector, Space Sci. Rev. (2011) 163:371- 459, DOI 10.1007/s11214-011-9862-0.