This document provides an overview of BGO single-interaction data (CAT9) processing for theNASA Dawn mission's Gamma Ray and Neutron Detector (GRaND). The data are part of the Planetary Data System (PDS), GRaND Reduced Data Records (RDR) for Vesta Encounter. The data are archived as ASCII files for each science phase during Vesta encounter. The methods used to correct and calibrate the BGO spectra recorded as a L1B product are described here. These follow the approach developed for the analysis of laboratory experiments and earlier mission phases (see Prettyman and Feldman, 2011; Prettyman et al., 2011).
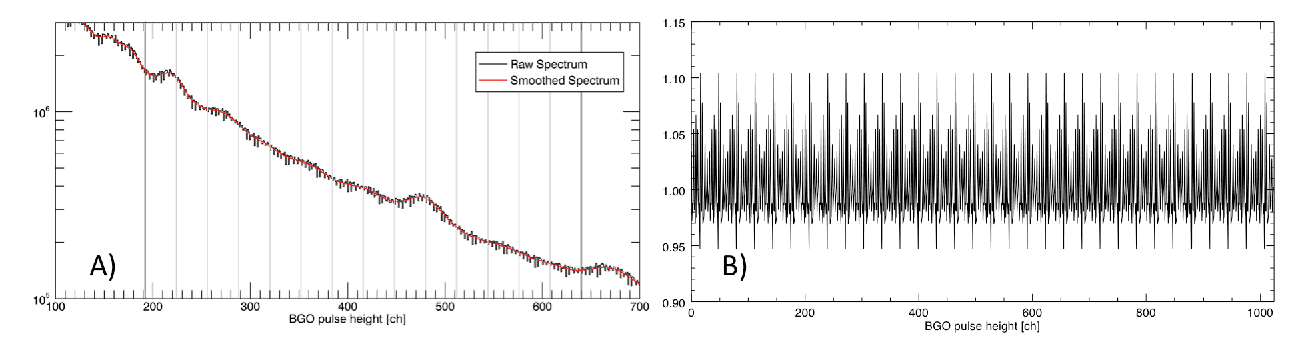
The pulse height of output signals from the BGO detector is analyzed and digitized by the Analog to Digital Converter (ADC). Each channel of the ADC has slightly variable widths, causing certain channels to be slightly more likely to count an event while others less likely (see the raw spectrum in Fig. 1A). This is called the differential non-linearity (DNL) of ADC and needs to be corrected (Prettyman et al., 2011). An examination of the relatively flat regions of spectra acquired over long integration times indicates that the DNL pattern repeats itself every 32 channels. Therefore, we derived the correction factor for DNL by taking the average of ratios for the spectrally smoothed counts (red spectrum in Fig. 1A) to raw counts (black spectrum in Fig. 1A) of 32-ch segments between 192 ch and 639 ch where the spectra were relatively flat (Fig. 1A). We apply this factor (shown in Fig. 1B) to the time-series spectra to remove the DNL artifacts.
Fig. 1 A) Raw BGO spectrum exhibiting the differential non-linearity (DNL) and its spectrally smoothed spectrum. B) The ratios between the raw and smoothed spectrum were taken for each of the 14 32-ch-wide segments between 192 ch and 639 ch. Their averages were repeated from 0 ch to 1023 ch to derive the DNL correction factor.
The gain of the BGO detector signal is sensitive to the surrounding environment and detector settings such as temperature, intensities of galactic cosmic rays, or HV. Consequently, the gain changed continuously throughout the mission. Temporal changes in the total gain or peak centroid positions in time-series spectra will cause apparent degradation of energy resolution of cumulative spectra, which leads to lower signal-to-noise ratio, poorer elemental identification, and larger spatial resolution. Therefore, it is crucial to correct each and every time-series spectrum to the same gain and offset prior to spectral accumulation for the optimal analysis of planetary gamma-ray spectra.
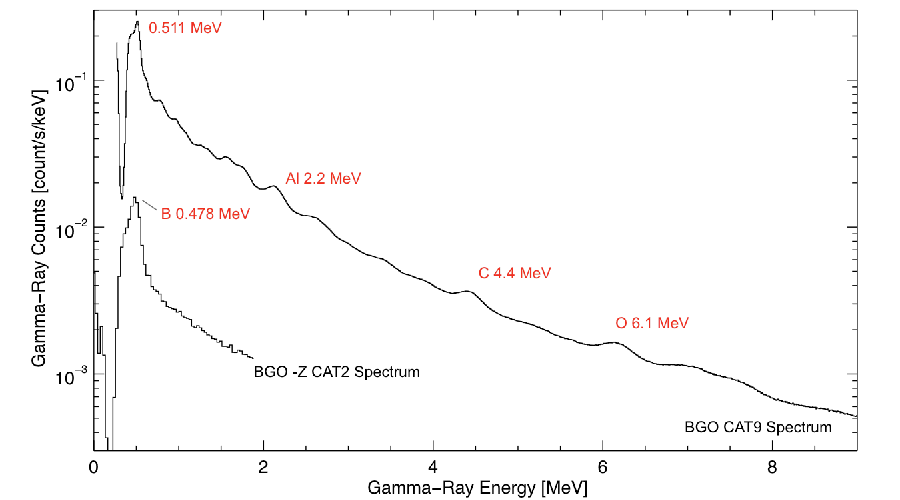
Fig. 2 Five distinct gamma-ray peaks used in the gain correction in single interaction events (CAT9) and a prompt coincidence between the BGO and -Z boron loaded plastic scintillators (-Z CAT2) BGO spectra.
Temporal variations of centroid channels of the five distinct gamma-ray peaks found in BGO spectra, namely those at 0.478, 0.511, 2.211, 4.438, and 6.129 MeV were determined as a proxy for the gain and offset (shown in Fig. 2; see also Yamashita et al., 2013). The centroids were determined by taking the second derivatives using Mariscotti's algorithm (Mariscotti, 1967; see also Prettyman et al., 2011).
The gamma-ray peaks and initial parameters used in the series of calculations are presented in Table 1. The parameter z indicates the number of averaging steps of the Mariscotti's algorithm carried out and w indicates the spectral window of the averaging. The z value of four for the B peak was chosen because it is a single peak observed in the coincidence event, while the z value of five was chosen for other peaks because they are potentially complex peaks. The determination of the optimum pair (z, w) is discussed in detail in Mariscotti, 1967. The i0_init values indicate the initial channel in a gamma-ray histogram with which to start the peak search. If the gain shift is so large that the second derivative at the starting search point is positive, then the i0_init will be replaced by the neighbor channel within ±4% that gives the smallest negative second derivative. If there was no negative second derivative found within ±4%, then the peaks search fails and the peak centroid for this peak will be classified as "not found" to avoid misidentification of surrounding peaks. Those initial values for the parameters were selected by analyzing the raw global spectrum obtained during each phase. For all of the five peaks, the modeled power-law backgrounds were subtracted before peak determination to account for the peak centroid shifts due to their steep baselines.
Table 1 Initial parameters used in deriving the second derivatives of the distinctive gamma-ray peaks. See text for explanations of other parameters. Abbreviations indicate: VSA, Vesta Science Approach; VSS, Vesta Science Survey; VSH, Vesta Science HAMO (high altitude mapping orbit); VTH, Vesta Transfer to HAMO; VSL, Vesta Science LAMO; VTL, Vesta Transfer to LAMO; VT2, Vesta Transfer to HAMO2; VTC, VH2, Vesta Science HAMO 2; Vesta Transfer to Ceres.
Event                Energy           io_init[ch]
                                    --------------------------------------------
Category   Source    [keV]  z   w   VSA  VSH  VSS,VTH,VSL   VTL  VT2,VH2    VTC
________________________________________________________________________________
CAT2         B       478    4   5    16   16       16        16     16       16
--------------------------------------------------------------------------------
CAT9     Anni.       511    5   3    42   39       36        36     36       36
--------------------------------------------------------------------------------
CAT9        Al      2211    5  13   230  230      220       220    220      220
--------------------------------------------------------------------------------
CAT9         C      4438    5  19   480  500      480       480    480      480
--------------------------------------------------------------------------------
CAT9         O      6129    5  25   704  704      674       674    674      670
________________________________________________________________________________
Prior to applying the Mariscotti's algorithm each spectrum was temporally smoothed. This is because each time-series spectrum is relatively sparse and contains many channels with low counts or even zero. Therefore we need to take an average of each channel over some period of time. This temporal smoothing is realized by taking the boxcar, central moving average of counts in each channel over 251 time-series spectra, starting from 125 events before and up to 125 after the spectrum of interest. See Fig. 3 for the directions of collecting averaging points for the temporal and spectral smoothing. The minimum number of spectra over which we take an average was determined based on statistics, which varies from five for the annihilation peak at 0.511 MeV to 125 for the oxygen peak at 6.1 MeV during the Low Altitude Mapping Orbit (LAMO) based on the initial analyses. However, since the gain is expected to change slowly with time, we decided to take a large, uniform smoothing window for all the five distinct peaks (Fig. 2) for statistically precise determination of peak centroids. The time window of 250 spectra corresponds approximately five hours or one orbit in LAMO. We have iterated this process with two other time windows of 125 and 501 spectra to confirm that corrected counting rates of the major peaks in BGO spectra were not sensitive to these temporal window widths within 3? uncertainty, as long as the width exceeds the statistical limits. In rare cases for low count-rate spectra when these long and fixed windows were insufficient, doubled temporal smoothing windows were used to overcome the statistical uncertainty.
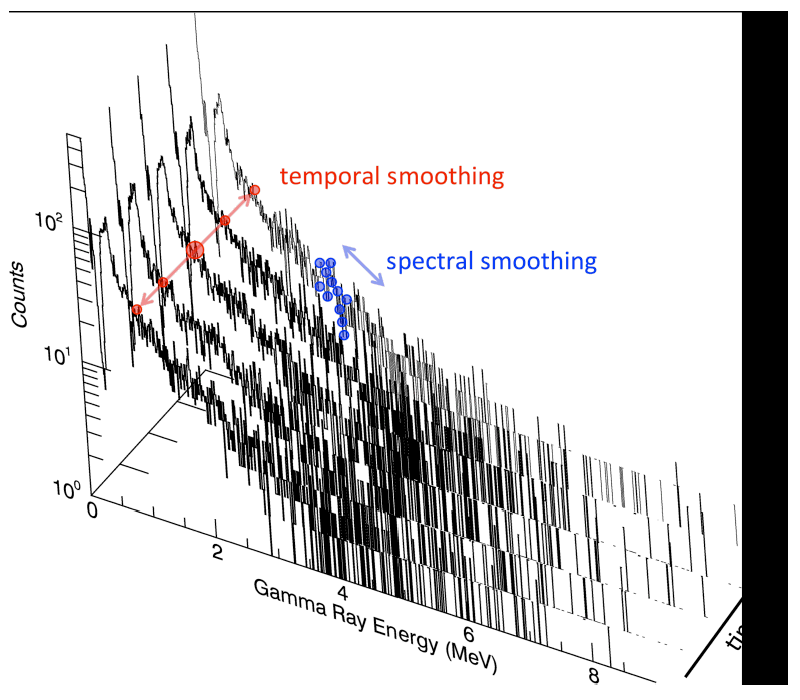
Figure 3 shows time-series variations of the peak centroids during LAMO. All the five peaks have a similar trend in peak shift. The variations in LAMO were within ±2%, except for during the SPE events and HV ramp-ups, which were not suitable for elemental mapping and removed from the reduced data records.

Fig. 4 Temporal variations of centroids of five peaks during LAMO determined by Mariscotti's algorithm. Each centroid channel was expressed relative to its mean values and shifted by ±0.08 or ±0.16 respectively for visibility.
The temporal variations of the peak centroids i0 were fitted against their reference energies (shown in Table 1) to correct all of the time-series spectra to the same gain and offset. CAT2 channels were multiplied by two and added with appropriate offsets (most of which were zero) to match with CAT9 channels. Several fitting schemes, including linear and quadratic ones, have been tried. We confirmed that a quadratic regression between the peak centroids and the reference energies give smaller absolute deviations of the peak energies as well as smaller relative deviations among the observation phases (Fig. 5) than a linear regression. However, the high energy range above 7 MeV, where there is no calibration point and therefore we had to extrapolate the relationship, suffers from larger deviations from the reference energies for the quadratic regression. This is especially critical for the Fe peaks at 7.6 MeV. For the overall consistency throughout the spectrum from 0.3 to 9 MeV, we decided to choose the linear regression at this point to produce L1B products.

Fig. 5 A) Linear (red) and quadratic (blue) regression between the peak centroids and the reference energies using the five distinct peaks at 0.478, 0.511, 2.211, 4.438, and 6.129 MeV. B) Deviations from the reference energies are shown for the five peaks used in A).
Using the regression line, the uncorrected channel counts were converted to corrected channel counts with each new pulse height channel having an equivalent energy of 8.9 x channel number [keV] and zero keV offset (Lawrence et al. 2004, Prettyman et al. 2004a, Prettyman et al. 2004b, Prettyman et al. 2011, Prettyman and Feldman 2012). The energy spectra before and after gain correction are shown in Fig. 6. The procedure preserves the counts in a spectrum as long as the original channel is not cut off at the upper or lower boundary of the new spectrum following gain correction. Note that the last channel (1023th channel out of 0-1023-ch histogram) in each uncorrected histogram contains a very large number of events that overflowed the range of the ADC. These overflow counts were eliminated by substituting 1022th-ch values to 1023th ch to avoid the artifacts that otherwise appear in channels around 900-1023 in the resulting gain-corrected spectra.
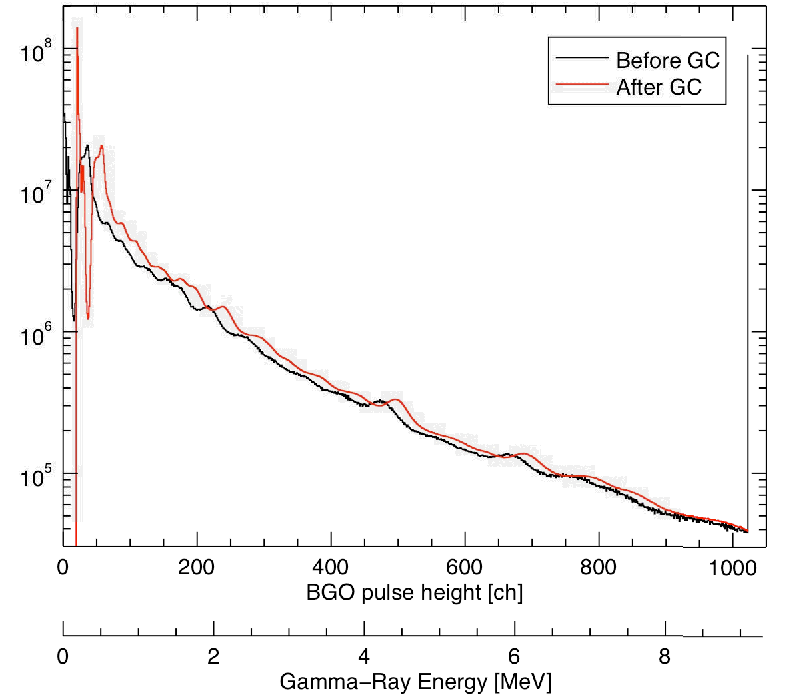
Fig. 6 BGO CAT9 energy spectra before (L1A) and after (L1B) gain correction.
As a result of gain correction, the corrected channel counts now contain floating numbers, because many of raw counts were subdivided and distributed to multiple new channels. As mentioned above, each BGO raw spectrum is sparse and the newly distributed corrected counts can also be very small in number, but not zero. Such very small decimal values create abnormal shapes in a histogram when accumulated over time and expressed with its y-axis in logarithm scale. These artifacts of round-off errors were dubbed "cathedral artifacts" after the spectral shape shown in Fig. 7A.
To remove the cathedral artifacts, the corrected counts were converted back to integers while the total counts in the spectrum were conserved. This was realized by generating a uniform random number ranging 0 to 1 to be compared with a decimal in each channel. If the decimal is greater than the generated random number, then the count in the channel gets rounded up, while if the decimal is smaller, then the count gets rounded down. Consequently, the smallest count (other than zero) that appears in the cathedral-removed spectrum is now 1, as shown in Fig. 7B.
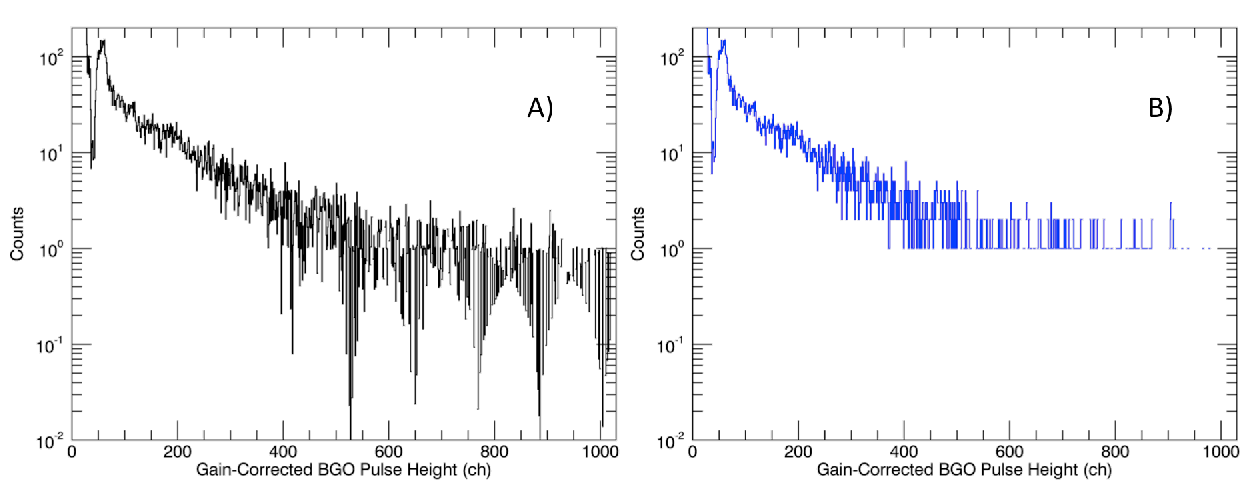
Fig. 7 A) Original spectrum with an accumulation time of 70 s after gain correction, showing the "cathedrals" resulting from fractions of counts. B) Spectrum after cathedral removal, with each channel count as an integer.
Not all spectra from the L1A products are suited for the elemental analysis of the vestan surface, because some of the spectra were obtained during the solar energetic particle events or the detector settings such as HV were not optimal. These "invalid" events were not included in the reduced data records. The criteria for identifying valid events are mainly based on the following three categories. The rest are filtered out as invalid events.
1) Counter values (live times and triples, see Prettyman et al., 2011) are within the proper ranges (see Fig. 8)
2)Spectral shape of the BGO signal is normal. In some cases, BGO spectra have abnormal shapes or are truncated at high and/or low end of channels (see Fig. 9).
3)Accumulation time (determined by TELREADOUT, see Prettyman et al., 2011) is optimum. Often TELREADOUT was set to be a large value to change the detector setting, causing discrete spikes in counter values (see Fig. 8).
4) The record occurs during quiet-Sun conditions.
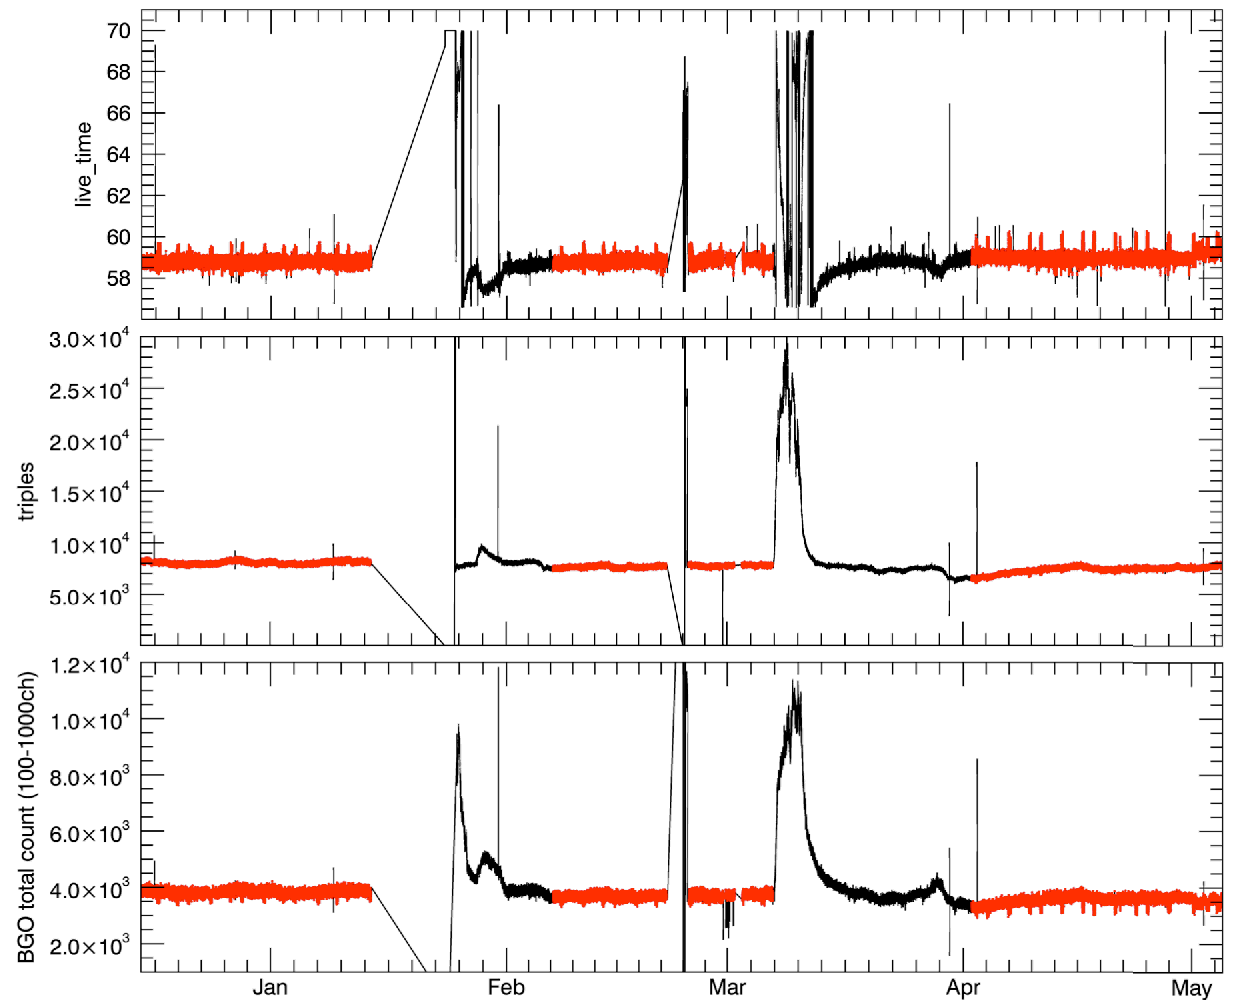
Fig. 8 Time-series plots of triples, live times, and BGO total counts (summed over 100 to 1000 channel after gain correction) acquired during LAMO. Filtered valid events are shown in red.
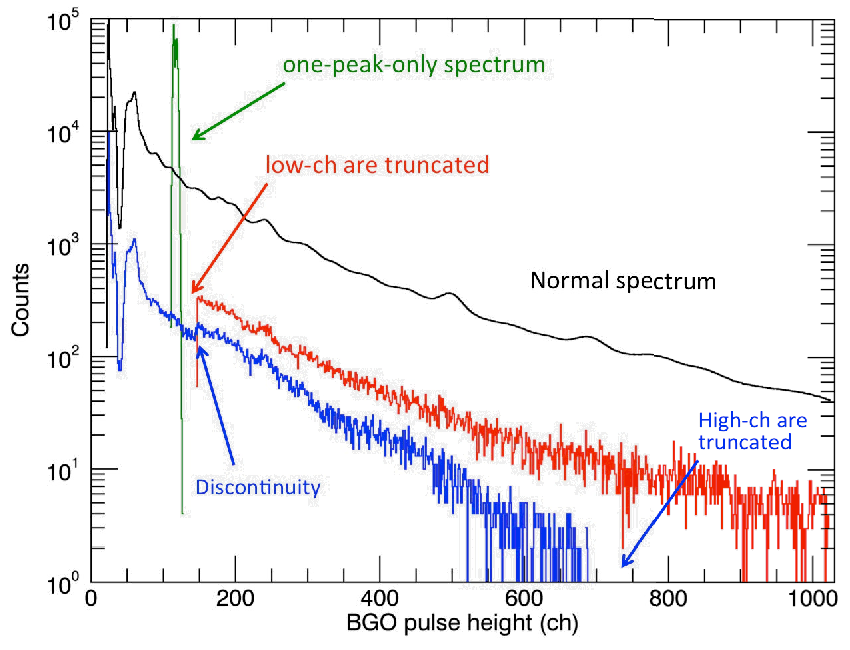
Fig. 9 Comparison of BGO spectrum shapes in a normal case and abnormal cases.
The actual criteria used in the data reduction were shown in Appendix A.
For some time-series spectra acquired when the Sun was active, the peak search failed within the given initial parameters due to the large gain shift. Since the gain correction was not possible, such spectra were excluded from the reduced data records.
As an intermediate processing step, gain corrected time-series spectra were output as a text file with each line corresponding to one event. As previously mentioned, events identified as invalid were ultimately excluded from the data file. Each line in the intermediate text file contained:
- SCLK ticks at the end of the science accumulation interval (s)
- UTC S/C event time (SCET) at the midpoint of the science accumulation interval
- Ephemeris time at the midpoint of the science accumulation interval (s)
- gain corrected counts for 0th to 1023th channels
The peak centroid channels of the five distinct peaks shown in Fig. 6 were derived. We were able to analyze 99% of all the L1A time-series spectra obtained during the Vesta Encounter. The events that failed the peak-centroid search and the gain correction are mostly attributed to solar energetic particle events that altered the peak position by more than 4% from the average centroid channel (see Section 2 in Method). The temporal variations of the centroids are shown in Fig. 10 from the Initial Check Out (ICO) to Vesta Transfer to Ceres (VTC) phase. The abscissa denotes time of the observation, which does not necessarily scale linearly, because of the large gap between phases, especially during cruise. From Fig. 10, we conclude that the gain of the GRaND gamma-ray spectrometer has been reduced by 10% since launch. During the solar events, the gain of the BGO detector seemingly increased rapidly, probably due to the pile up of the signals, as seen in the Approach and LAMO phases. The HV ramp up also increased the gain considerably, requiring some time for the gain to be resumed and stable, as seen at the beginning of EMC, MVC's, and Approach, in the middle of MGA and LAMO, and at the end of HAMO2. Therefore, for the geochemical study of planetary surfaces, the periods of such solar events and HV ramp up have been removed.
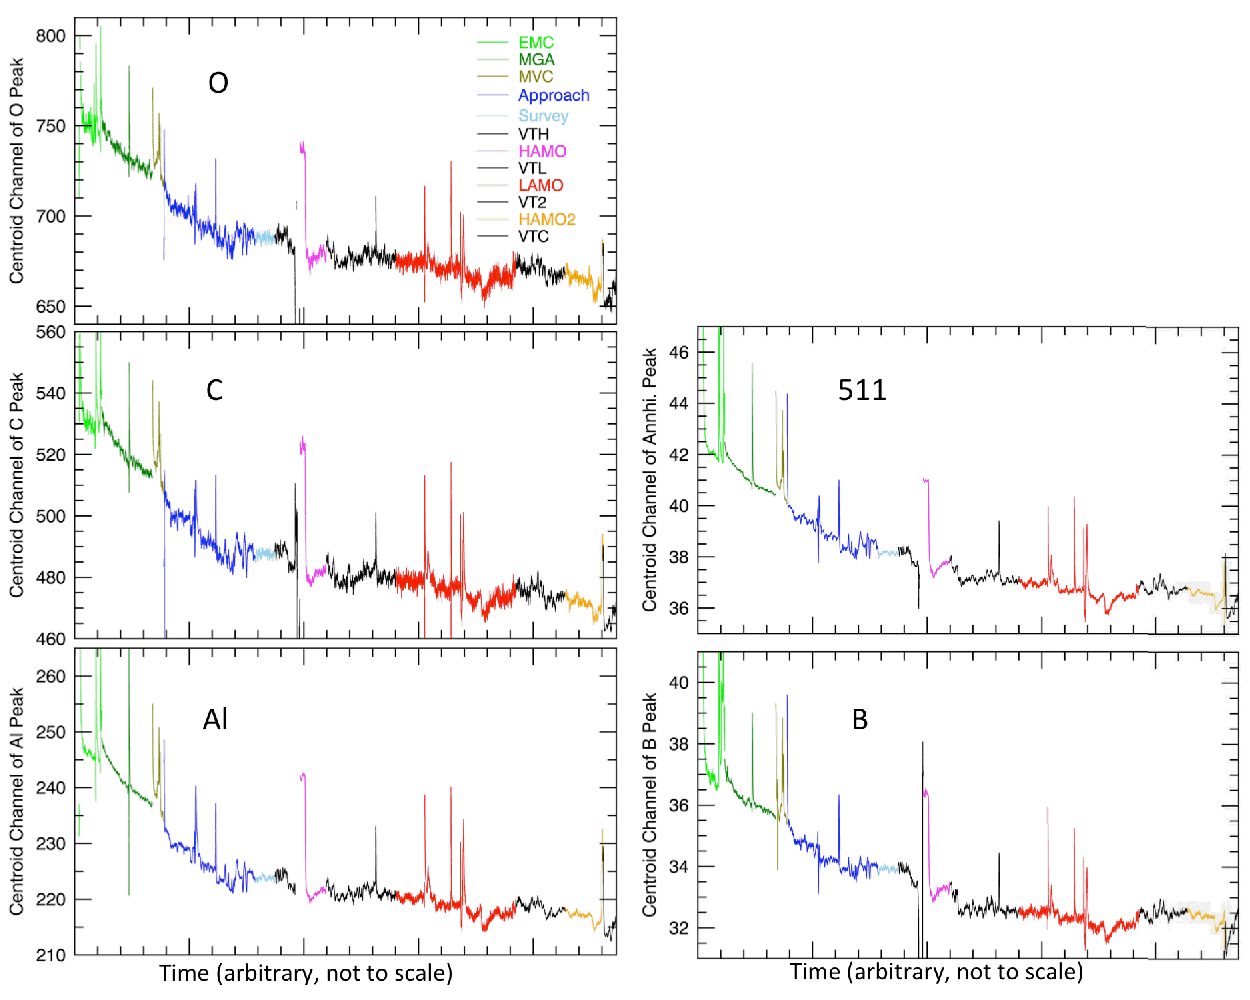
Fig. 10 Temporal variation of the centroids of the five distinctive gamma ray peaks observed by the BGO detector in GRaND. Abbreviations in legend indicate: EMC, Earth to Mars Cruise; MGA, Mars gravity assist; MVC, Mars to Vesta Cruise; VTH, Vesta Transfer to HAMO; HAMO, high altitude mapping orbit; VTL, Vesta Transfer to LAMO; LAMO, low altitude mapping orbit; VT2, Vesta Transfer to HAMO2; VTC, Vesta Transfer to Ceres.
The energy resolutions of the total spectra (integrated over the whole phase) have been improved by the gain correction (see Fig. 6). As a result, for LAMO, the peak widths were reduced by 31% at 4.4 MeV and 18% at 6.1 MeV. Peak entroids were well calibrated by this method within -0.2% and 0.5%, respectively. Net counts of the peaks were well preserved within 2%.
Lawrence D. J., Maurice S., and Feldman W. C. 2004. Gamma-ray measurements
from Lunar Prospector: Time series data reduction for the gamma-ray spectrometer.
Journal of Geophysical Research 109, E07S05, doi:10.1029/2003JE002206.

Mariscotti M. A. 1967. A method for automatic identification of peaks in the
presence of background and its application to spectrum analysis. Nuclear
Instruments and Methods 50:309-320.

Prettyman T. H., Feldman W. C., McSween H. Y., Dingler R. D., Enemark D. C.,
Patrick D. E., Storms S. A., Hendricks J. S., Morgenthaler J. P., Pitman K. M.,
and Reedy R. C. 2011. Dawn's Gamma Ray and Neutron Detector. Space Science
Reviews 163:371-459.

Prettyman T. H. and Feldman W. C. 2012. PDS data processing Gamma Ray and
Neutron Detector. Version 5.1. NASA Planetary Data System LIA archive.

Prettyman T. H., Feldman W. C., Mellon M. T., McKinney G. W., Boynton W. V.,
Karunatillake S., Lawrence D. J., Maurice S., Metzger A. E., Murphy J. R.,
Squyres S. W., Starr R. D., and Tokar R. L. 2004a. Composition and structure
of the Martian surface at high southern latitudes from neutron spectroscopy.
Journal of Geophysical Research 109, doi:10.1029/2003JE002139.

Prettyman T. H., Dot Delapp D., Feldman W. C., and Maurice S. 2004b. Mars
2001 Odyssey Neutron Spectrometer processing. Version 1.3. NASA Planetary
Data System.

Prettyman T. H., Feldman W. C., McSween H. Y. Jr., Dingler, R. D.,
Enemark D. C., Patrick D. E., Storms S. A., Hendricks J. S., Morgenthaler J. P.,
Pitman K. M., and Reedy R. C. 2011. Dawn's Gamma Ray and Neutron Detector.
Space Science Reviews 163:371-459.

W. C., Lawrence D. J., Peplowski P. N., McCoy T. J., Beck A. W., Toplis M. J.,
Forni O., Mizzon H., Raymond C. A., and Russell C. T. 2013. Distribution of
iron on Vesta. Meteoritics & Planetary Science, doi:10. 1111/maps.12139.
The criteria used to filter out invalid events are as follows. They are expressed as indices in IDL language. It is assumed that the variable phase contains the name of the subphases during Vesta Encounter, and bgo_gc contains time-series gain-corrected BGO spectra. Here, the variable good_ind gives the indices of events that are valid; and bad_ind gives the (complementary) indices of events that are invalid.
case phase of
   'vsa': begin
      good_ind = where(live_time ge 179.6 AND live_time lt 182.6 AND $
           sclk ne 357777806 AND sclk ne 357792506 AND sclk ne 358198016 AND $
           sclk ne 358236656 AND sclk ne 359105006 AND sclk ne 359794436 AND $
           ( (sclk ge 357845426 AND sclk le 360491846) OR $
           (sclk ge 361394846 AND sclk le 362424056) OR $
           (sclk ge 362999502 AND sclk lt 366293045) ) AND $
           triples ge 2.3e4 AND triples lt 2.85e4, complement=bad_ind)
   end
   'survey': begin
      good_ind = where(live_time ge 181 AND $
                 triples ge 2.3e4 AND triples lt 2.7e4, complement=bad_ind)
   end
   'vth': begin
      good_ind = where(live_time ge 180.5 AND $
                      triples ge 2.3e4 AND triples lt 2.75e4 AND $
                    sclk gt 368110805 AND sclk lt 369939695,complement=bad_ind)
   end
   'hamo': begin
     good_ind = where(live_time ge 180.35 AND live_time lt 182.5 AND $
                      triples ge 2.2e4 AND triples lt 2.75e4 AND $
                      sclk ge 371721897 AND sclk lt 373550577, $
                      complement=bad_ind)
   end
   'vtl': begin
      good_ind = where( ($
                      (sclk ne 373624497 AND sclk ne 373624707 AND sclk ne 373624917 AND $
                       sclk ne 375201787 AND $ sclk lt 376246187 AND live_time gt 50.) $; avoid HV off
                 OR $
                      (sclk gt 376574404 AND live_time lt 60. AND $
                       triples lt 1e4 AND triples gt 5e3) ), $
                      complement=bad_ind)
   end
   'lamo': begin
      good_ind = where( $
                 live_time gt 58.1 AND $
                 triples lt 8700 AND $ total( bgo_gc[*, 700:-1], 2) ne 0 AND $
                 total( bgo_gc[*, 0:143], 2) ne 0 $          ; truncated spectra

               AND $

                ( $
                 (sclk ge 377188024 AND sclk le 379787054 AND $
                  live_time lt 59.9 AND triples gt 7440 ) $               ; Ep1A

               OR $
                  (sclk gt 381853612 AND sclk le 383142872 AND $
                   live_time lt 59.9 AND triples gt 7000 ) $              ; Ep2A

               OR $
                  (sclk gt 383394445 AND sclk le 384348825 AND $
                   live_time lt 59.9 AND triples gt 7000 ) $              ; Ep1B

               OR $
                  (sclk gt 386605625 AND sclk le 389442847 AND $
                   live_time lt 60.3 AND triples gt 6000 ) $ ; Ep2B
                ) $
                , complement=bad_ind)
   end
   'vt2': begin
      good_ind = where(triples lt 2.8e4 AND $
                       NOT (sclk gt 389908527 AND triples lt 2.01e4), $
                       complement=bad_ind)
   end
   'hamo2': begin
      good_ind = where(sclk lt 396331797 AND live_time gt 181.5, $
                       complement=bad_ind)
   end
   'vtc': begin
      good_ind = where(sclk ge 396792117 AND sclk le 397748247, $
                       complement=bad_ind)
                       ; Wait until Sep. 29 for BGO counts to stabilize
   end
endcase