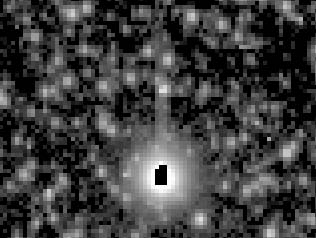
Despite the presence of anti-blooming gates, the CCDs of both cameras exhibit
what we believe is blooming in columns in which overexposed pixels are present
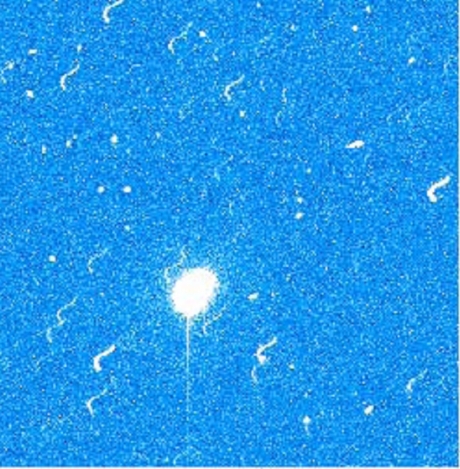
(although it may also be a charge transfer issue). Figure 13 shows an example
for FC2. This blooming appears to be exclusively upward (i.e. towards the top
of the CCD). We are in the process of understanding this phenomenon, but note
that dedicated observations are required to fully quantify it.
6.2 Comparison of FC1 and FC2 currents during ICO FT
The provisional key value has been used to compare average and range of
current for the two cameras, as observed during ICO functional tests. Details
are not in the scope of this document. The first table gives the results for
input current (PCU +28I SC) and the analog power supplies (PCU +5I ANA).
Following in Table 7 are DPU supply currents (PCU +3.3I DPU, and PCU +2.5I
DPU), then the FEE supplies in Table 8 (PCU +12I FEE), Table 9 (PCU +15I FEE),
Table 10 (PCU +5I FEE), and Table 11 (PCU -5I FEE).
Table 6 Summary of FC2-FC1 differences for input current and +5I ANA supply
currents during ICO functional tests
                               PCU +28I SC [A]                               PCU+5I ANA [mA]
                            FC1               FC2           D             FC1            FC2             D
                key  AVG     HR      N   AVG    HR     N     %    AVG     HR     N   AVG     HR     N    %
No MCU or FEE     0  0.376  0.052   75  0.378 0.050   75   0.7   218.3  125.5   75  229.6  122.3   75   4.9
MCU Power ON      1  0.370  0.034    4  0.376 0.041    4   1.6   240.9  103.9    4  209.0   80.2    4  -15.3
MCU Pow & Ctrl
 ON               3  0.428  0.158  560  0.462 0.157  409  -0.4   480.4  663.9   60  487.0  652.2  409    1.4
MCU and FEE ON    7  0.658  0.204 4673  0.647 0.191  377  -1.7   491.9  674.6  473  451.0  806.6 5377   -9.1
MCU + FEE +
 Door            15  0.725  0.107   36  0.723 0.103   38  -0.3   846.6  422.9   36  847.8  397.8   38    0.1
MCU + FEE + FW   23  0.707  0.138   72  0.690 0.138   78  -2.5   776.4  555.9   72  814.0  521.8   78    4.6
MCU + Baffle
 heater          35  0.440  0.157  259  0.427 0.144  170  -2.9   601.8  648.6   59  554.5  613.5  170   -8.5
MCU + FEE +
 Baffle heater   39  0.685  0.185 1734  0.690 0.178  623   0.7   612.1  671.8  134  701.3  675.3  623   12.7
MCU + CH heater  67  0.538  0.155  633  0.549 0.136  465   2.1  1105.9  649.4   33 1139.1  620.3  465    2.9
MCU + FEE + CH
 heater          71  0.746  0.203 1981  0.737 0.212  082  -1.2  1082.3  860.2  181 1021.2  864.7 2082   -6.0
MCU + Baffle
 & CH
 heaters         99  0.488  0.150  135  0.500 0.159   98   2.5   817.1  663.1   35  857.2  662.0   98    4.7
MCU + FEE +
 Baffle &
 CH heaters     103  0.720  0.198 1375  0.711 0.179  706  -1.3   921.3  920.2  175  918.1  673.8  706   -0.3

 Note: AVG = average; HR = half range; N = count; D = 100 (FC2-FC1)/FC2.
The key definition in terms of units ON has been included in the tables, and
the counts, average and half range for FC2 and FC1, and the percent difference
between FC2 and FC1 averages for each key. Half range has been used so
that average + half range could be used for an upper limit, but this is
not correct. Note also that average - half range can be negative. This
is because average does not represent a central value for range as an estimate
of spread.
These tables must be redone with average and standard deviation as statistical
measures.
Table 7 Summary of FC2-FC1 differences for +2.5I and +3.3I DPU supply currents
during ICO functional tests
                                 PCU +2.5I DPU [mA]                                        PCU +3.3I DPU [mA]
                            FC1                 FC2            D           FC1               FC2         D
                key  AVG    HR       N   AVG     HR      N     %   AVG     HR    N   AVG     HR      N   %
No MCU or FEE     0  746.3  155.0    75  741.1  146.7    75  -0.7  321.5   79.0  75  318.4   81.0    75  -1.0
MCU Power ON      1  776.3   12.3     4  770.0   11.0     4  -0.8  234.9    5.2   4  232.9    5.3     4  -0.9
MCU Pow & Ctrl
ON                3  749.5  108.5   560  744.8  115.9   409  -0.6  236.3   53.0 560  234.2   52.7   409  -0.9
MCU and FEE ON    7  718.3  140.3  4673  710.9  135.6  5377  -1.0  246.9   68.0 673  245.1   70.7  5377  -0.7
MCU + FEE +
Door             15  727.8   95.1    36  684.6  103.5    38  -6.3  237.7   50.1  36  246.9   49.9    38   3.7
MCU + FEE + FW   23  719.3  101.2    72  700.7  128.6    78  -2.6  241.1   53.3  72  242.4   53.0    78   0.5
MCU + Baffle
heater           35  753.9  105.2   259  742.8  100.5   170  -1.5  233.1    5.6 259  231.2   50.0   170  -0.8
MCU + FEE +
Baffle heater    39  710.8  140.6  1734  705.0  125.3   623  -0.8  249.1   63.8 734  243.3   63.9   623  -2.4
MCU + CH heater  67  743.6  105.9   633  742.3  112.7   465  -0.2  232.4   49.0 633  230.1   49.4   465  -1.0
MCU + FEE + CH
heater           71  714.5  130.9  1981  700.3  130.7  2082  -2.0  244.7   65.1 981  244.1   66.8  2082  -0.2
MCU + Baffle
& CH
heaters          99  766.3  102.5   135  740.8   99.0    98  -3.4  233.1   10.4 135  231.4    5.6    98  -0.7
MCU + FEE +
Baffle &
CH heaters      103  711.7  139.8  1375  708.2  117.3   706  -0.5  245.9   63.2 375  242.1   62.5   706  -1.6

Note: AVG = average; HR = half range; N = count; D = 100 (FC2-FC1)/FC2.
Table 8 Summary of FC2-FC1 differences for +15I FEE supply currents during ICO
functional tests
                     PCU +15I FEE <47mA [mA]                   PCU +15I FEE >47mA [mA]
               FC1                  FC2             D         FC1              FC2           D
          key   AVG    HR    N   AVG  HR       N    %     AVG  HR      N  AVG   HR     N     %
MCU + FEE  7    32.4  7.2  3062  36.0  4.6  2950  10.0   61.6  7.5  1611  59.0  4.1  2427  -4.3
MCU + FEE
  + Door  15    33.0  0.6    36  36.5  0.6    38   9.6                 0              0
MCU + FEE
  + FW    23    32.9  0.9    72  36.4  0.7    78   9.7                 0              0
MCU + FEE
 + Baffle
 heater   39    32.4  3.4   733  36.2  0.8   389  10.3   61.7  6.6  1001  59.2  0.8  234  -4.2
MCU + FEE
 + CH
 heater   71    33.0  2.1  1840  36.4  5.1  1793   9.5   61.9  1.2   140  59.1  3.1  289  -4.7
MCU + FEE
 + Baffle
 & CH
 heaters  103  32.8  1.8    890  36.2  2.9   412   9.3   61.8  1.2   485  59.3  4.1  294  -4.2
Note: AVG = average; HR = half range; N = count; D = 100 (FC2-FC1)/FC2.
Table 9 Summary of FC2-FC1 differences for +12I FEE supply currents during ICO
functional tests
                  PCU +12I FEE <75mA [mA]                         PCU +12I FEE <75mA [mA]
                     FC1                FC2              D      FC1              FC2               D
               key  AVG   HR       N   AVG   HR     N    %  AVG    HR     N   AVG    HR      N     %

MCU + FEE        7   65.3   3.9  3086   64.3  4.3 2988 -1.6  84.4   4.2  587   83.3   8.3  2389   -1.3
MCU + FEE +
Door            15   65.2   0.0    36   64.2  0.1   38 -1.6                0                 0
MCU + FEE + FW  23   65.2   0.1    72   64.2  0.1   78 -1.6                0                 0
MCU + FEE +
Baffle heater   39   65.4   3.6   743   64.2  3.4  395 -1.8  84.4   4.5  990   83.2   0.3   228   -1.4
MCU + FEE + CH
heater          71   65.0   5.2  1850   63.9  4.3 1810 -1.8  84.4   0.5  130   83.3   3.1   272   -1.3
MCU + FEE +
Baffle &
	CH heaters   103   65.2   3.8   903   64.2  3.5  414 -1.5  84.4   4.1  472   83.2   0.6   292   -1.5

Note: AVG = average; HR = half range; N = count; D = 100 (FC2-FC1)/FC2.
Table 10 Summary of FC2-FC1 differences for +5I FEE supply currents during ICO
functional tests
285mA)
                           FC1                 FC2         D        FC1               FC2            D
                key  AVG    HR       N   AVG   HR     N    %   AVG    HR     N  AVG    HR      N     %

MCU + FEE         7  266.3    7.0  3059  269.0  3.3 2953  1.0  297.5   0.8 1614 300.4   5.6  2424   1.0
MCU + FEE +
 Door            15  265.9    0.4    36  268.7  0.3   38  1.0                0                  0
MCU + FEE + FW   23  266.0    0.5    72  268.8  0.3   78  1.0                0                  0
MCU + FEE +
 Baffle heater   39  266.0    7.0   736  269.0  0.6  389  1.1  297.4   0.8  998 300.4   1.3   234   1.0
MCU + FEE + CH
 heater          71  266.9    2.4  1841  269.8  2.5 1780  1.1  297.6   1.6  139 300.3   8.7   301   0.9
MCU + FEE +
	Baffle &
	CH heaters    103  266.5    2.5   898  268.9  0.7  411  0.9  297.4   0.8  477 300.4   5.6   295   1.0

Note: AVG = average; HR = half range; N = count; D = 100 (FC2-FC1)/FC2.
Table 11 Summary of FC2-FC1 differences for -5I FEE supply currents during ICO
functional tests
PCU -5I FEE (<-80mA) [mA] PCU -5I FEE (>-80mA) [mA]
FC1 FC2 D FC1 FC2 D
key A HR N A HR N % A HR N A HR N %
MCU + FEE 7 -87.7 1.5 1619 -88.7 2.7 2417 1.1 -74.3 2.3 3054 -74.8 2.5 2960 0.8
MCU + FEE +
Door 15 na na 0 na na 0 -74.2 0.0 36 -74.8 0.1 38 0.8
MCU + FEE + FW 23 na na 0 na na 0 -74.2 0.0 72 -74.8 0.1 78 0.8
MCU + FEE +
Baffle heater 39 -87.7 0.4 1002 -88.7 0.3 231 1.2 -74.2 0.2 731 -74.9 0.2 392 0.9
MCU + FEE + CH
heater 71 -87.8 1.7 141 -88.7 3.8 296 1.1 -74.4 0.3 1839 -75.1 2.5 1785 0.9
MCU + FEE +
Baffle &
CH heaters 103 -87.7 0.4 476 -88.7 0.2 294 1.2 -74.3 0.3 899 -74.8 0.2 412 0.7
Note: A = average; HR = half range; N = count; D = 100 (FC2-FC1)/FC2.
7 Image streaks
In some images acquired by both FC1 and FC2 during ICO we find objects
moving through the FOV. We have come to conclude that these are truly
objects moving in front of the camera, and not effects created by the
FC itself. Of the 731 images taken with open front cover, 15 show
evidence for moving objects (FC2: 6, FC1: 9). These images were taken
at four different S/C attitudes: the 'background' attitudes during the
Functional block (both cameras), pointing to 20 Cep (Performance
block), and pointing to NGC 3532 (Calibration block). All attitudes
have the positive x-axis of the S/C aligned to the Sun between
-17.5° and +10.0° (see Figure 25, Figure 26, Figure 27
and Figure 28). Figure 29 shows the definition of the S/C coordinate
system.
In all the images listed in Table 12 and Table 13 the streaks are
aligned (more or less) horizontally from right to left (from +x
to -x in S/C-coordinates), except for image 455.
Possibly, the streaks are caused by small particles apparently coming
loose from the spacecraft and being forced by radiation pressure
and/or solar wind from the Sun through the FOV. This would explain
both the main orientation (x-z-plane) and direction
(-x) of the streaks in the images taken during 'ICO
background attitude 2' (Figure 26) and for the images 436 and 437
taken during 20 Cep pointing (Figure 27).
Two streak examples are show in Figure 30 and Figure 31. They are
associated with particles moving into -x-direction in the
S/C coordinate system. Figure 32 shows a very faint and thin streak in
the lower left corner. Unlike other streaks it is not blurred and only
about one pixel wide. The apparent size for a point source blurred by
defocusing is shown in
Table 14. Calculations show that it has to be at least 200 m away from
the S/C to be in focus. The widest streak was found in image 762
(Figure 33). Due to its varying width it was possible to calculate the
distance of the associated particle to the S/C at the beginning and
end of its crossing the FOV, and to determine the angle of its path
relative to the S/C. The streak is narrowing from 49 pixels at the
right edge to 37 pixels where it ends in the image. The corresponding
distances to the S/C are 4.6 m and 6.0 m. With a length of 810 pixels,
we find that the path is 74° inclined to the x-y-
plane. Assuming a linear motion of the object, it intersects with the
z-deck at a distance of around 1.5 m from the optical axis of
the camera.
Table 12.
Images with streaks in the FC2 Functional and Performance block.
camera      FC2   FC2    FC2    FC2    FC2    FC2     FC2
test      Func.  Func.  Func.  Func.  Perf.  Perf.   Perf.
attitude  ICO1   ICO1   ICO1   ICO1  20Cep  20Cep   20Cep
img-ID     295   296     297    298    436    437     455
exp-time    3s    3s     30s    30s    15s    15s    600s
Table 13.
Images with streaks in the FC1 Functional, CCDcal, and
Calibration block.
camera     FC1    FC1    FC1    FC1    FC1    FC1      FC1     FC1
test      Func.  Func.  Func.  Func.  Func.  Func.  CCDcal  CCDcal
attitude  ICO2   ICO2   ICO2   ICO2   ICO2   ICO2    ICO2     ICO2
img-ID     295    296    297    298    299   300      417      418
exp-time  0.3s   0.3s    3s      3s    30s   30s      30s      30s
camera       FC1    FC1     FC1     FC1
test       Calib.  Calib.  Calib.  Calib.
attitude   20Cep   20Cep   20Cep     NGC
img-ID       512     513     521     762
exp-time    3.7s    3.7s    160s     45s
Table 14.
Blur size of a point source at a finite distance.
Distance (m)  Blur size (px)
0.5            445.7
1              222.9
2              111.4
3               74.3
4               55.7
5               44.6
6               37.1
7               31.8
8               27.9
9               24.8
10              22.3
15              14.9
20              11.1
50               4.5
10               2.2
20               1.1
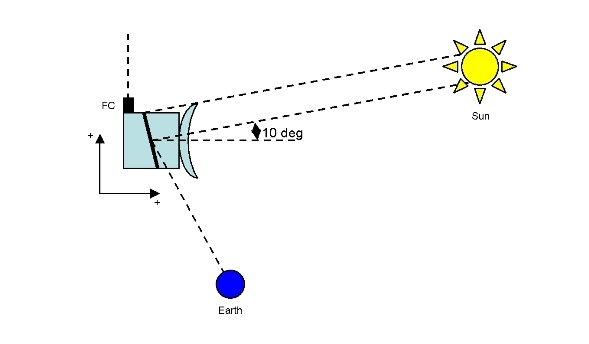
Figure 25.
ICO background attitude 1, 2007 Oct 8 (ICO1).
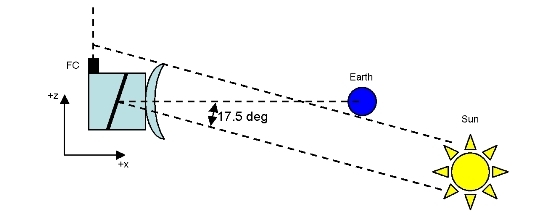
Figure 26.
ICO background attitude 2, 2007 Dec 04 (ICO2)
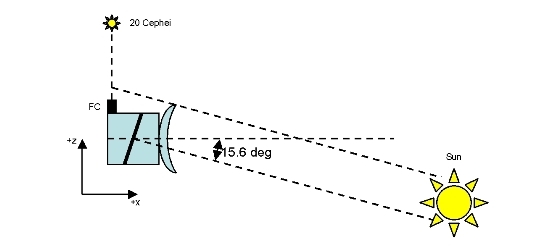
Figure 27.
20 Cep pointing, 2007 Dec 04 (20Cep)
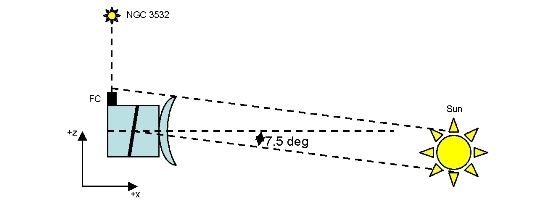
Figure 28.
NGC 3532 pointing, 2008 Feb 21 (NGC)
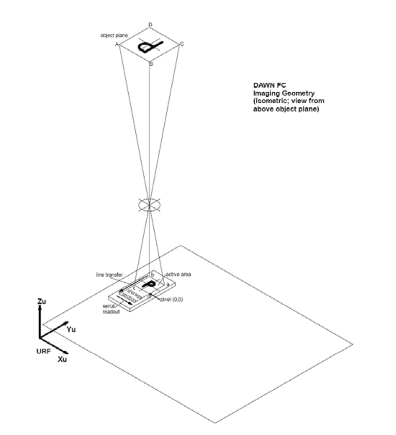
Figure 29.
FC imaging geometry and coordinate system
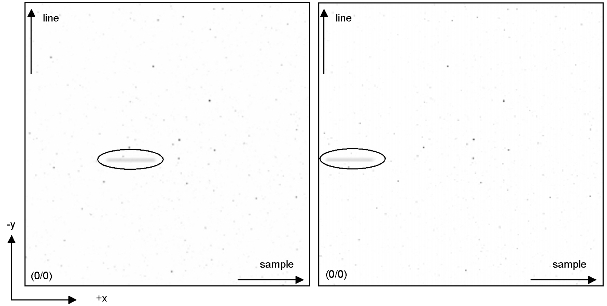
Figure 30.
Moving streak in images FC2_2007_12-04T04.57.15.436Z_ID10_0000000436_F1.img
and FC2_2007_12-04T04.57.39.396Z_ID10_0000000437.img
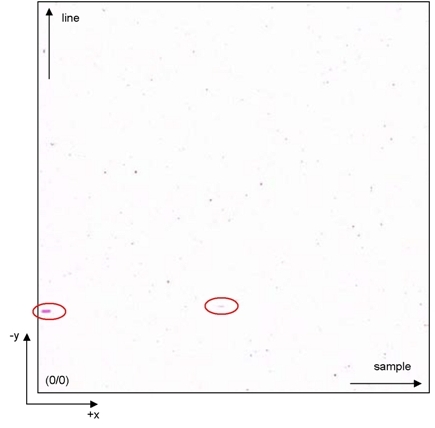
Figure 31.
Two streaks in image FC1_2007-12-10T20.19.15.883Z_ID10_0000000297.F1.img
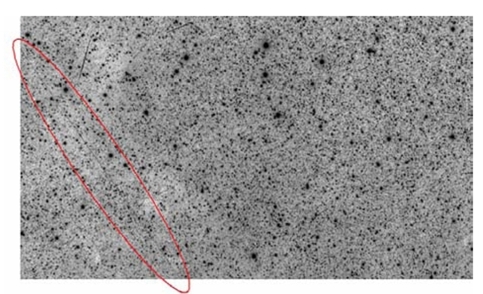
Figure 32.
Lower part of image FC2_2007-12-04T05.39.36.000Z_ID10_0000000455_F1.img:
a faint and thin streak in lower left corner
8 Conclusions
Commissioning of the Dawn Framing Cameras was performed in 7 slots, 4
on FC1 and 3 on FC2. Both cameras were found fully functional,
unaltered by the launch event and performing as designed in zero-g,
vacuum and mission thermal environment.
Total of 1157 images were acquired. Front doors were opened and
closed, filter wheels turned one-by-one and multiple filters, cal
lamps used for optical stimulation. Operational heaters stabilized the
FCs right at the target temperatures of camera head and baffle with
good power margins.
A few images were corrupted when received on ground. Further
investigation pointed at an issue in the spacecraft virtual recorders.
An ISA has been filed but no action is required on the FC side.
Flight software performed well, camera internal communication was
checked by checksum check and found ok. Image compression works well.
Engineering housekeeping was verified and found in expected ranges.
Thermal performance of both cameras is inline with s/c TVac based
predictions. CCDs ran at about -52degC for FC2, FC1 about 2deg warmer
at -50degC. There is room for improvement by lowering deck temperature
by -20degC, aiming for CCD target temperature of -60degC.
Camera performance was verified concerning bias, dark current, PSF,
and geometric distortion, all nominal as expected from ground tests.
S/C jitter was seen in long exposures adding to the PSF and providing
upper limits for exposure times.
Absolute calibration was found approx. 20% offset compared to ground
tests, very similar for both cameras indicating mismatch of ground
facilities (under review).
The CCDs were found with slight charge blooming column-up of strongly
over exposed pixels (which can be interpreted as insufficient CTE).
However, CCD anti-blooming gate is efficiently removing charges as no
column crossings were found.
Residual charge by incomplete clearing prior to exposure was found as
seen on ground in FC1 cal lamp images, and verified absent in FC2
frames. A software patch will be uploaded in April to mitigate FC1
residual charge in most color filters, but not in FC1 clear filter at
Vesta flux.
Streaks were seen in 19 images, the blur size indicates source of
streaks may be in only a few to a few tens of meters distance, moving
at low velocities. One streak is only 1 pixel wide, thus source at
least 200m away.
/P>
<
9 Appendixes
9.1 FC1 Functional test report
Dawn FC1 ICO Functional Test Block; DSC/UCLA
10 Dec 2007 (H Sierks, M Aye, S Schroeder, H U Keller, S Mottola at DSC;
P Gutierrez, T Maue, M Richards at MPS)
- ccd temperature was found in steady state with rampage readings of
-63.7C and camera head at -18.9C at bit below 50% duty cycle; pt 2000 final
calibration tunes not applied yet; deck temperature is -2.7C with unit off
- all times herein are DSC local time/PST

07:00 voca check ok

07:02 checked space weather on noaa, sun is quiet, no solar event ongoing

07:36 engineering playback finished

07:50 FC1 thermal data is ok to proceed

07:52 4th life boat sent (ends 11:22 with 30 min margin)

07:57 FC1 power on radiated

08:03 power on ok, memory check running, ch temperature drops as thermal
control demon is not yet up and running

08:13 mass mem check ok, mcu turned on, hk & temps ok, power on htr test
ok

08:16 camera is on, boot was nominal, CCD at -63.43C, radiator -78.75C, camera
head at -25.89C, thermal control catching up at 63% duty cycle and raising

08:28 radiated extended heater test cmds

08:32 thermal control stopped, ch htr turned on for 5 min

08:37 ch htr turned off, ok

08:38 table patch sent and verified: 125 steps to open door (flight config)


08:39 turned baffle htr on for 5 min

08:44 ok, htr tests went fine

08:46 sent fee switch on

08:49 all hk fine, ok

08:55 sent cmd acquisition of "ten basics"

09:09 radiate playback for 8 min, all images

09:12 temperature snap shot: CCD -57.27, camera head -23.89, radiator -77.75
baffle -30.87, i/f 3.6

09:15 first test pattern streaming down, ok

09:20 all 10 images down and look fine, checking, see cosmics, images are ok;
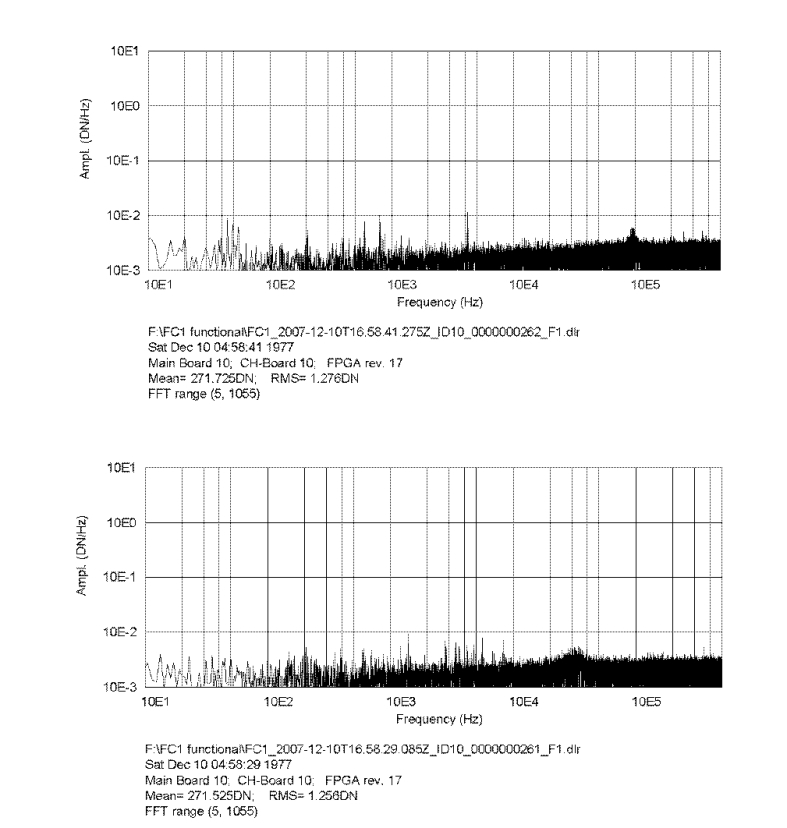
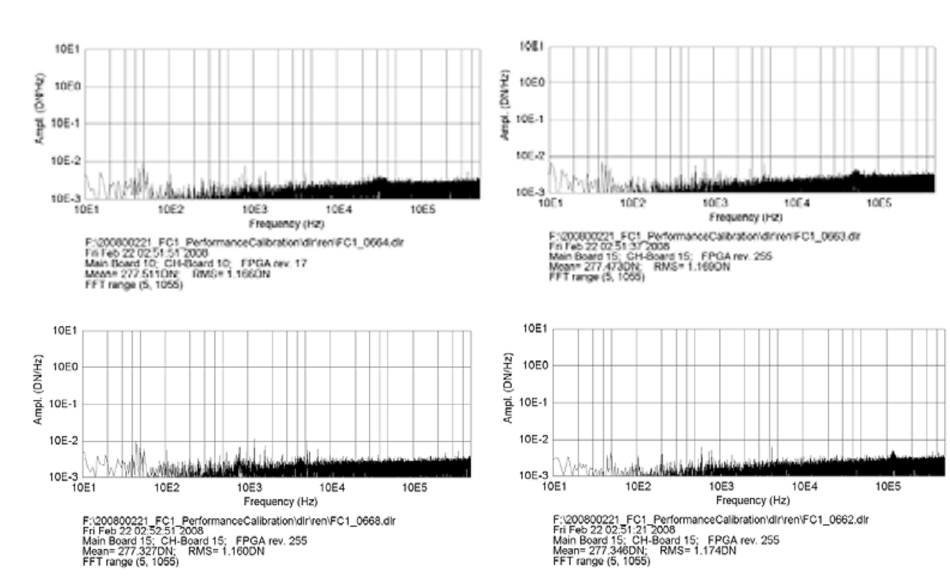
serial images show peaks at frequencies comparable to FC2, level is elevated
by approx. 15%, a broad peak at higher frequencies is visible

09:22 back to real time tim, gap check revealed no gap, wait for station
handover

10:00  back to cmding after station handover

10:01 radiated cal lamp imaging sequence

10:02 temperature snap shot: CCD -52.91, camera head -18.9, radiator -72.76
baffle -30.87, i/f 6.1

10:04 cal lamp is on

10:08 6 images taken, processing, done

10:14 radiated p/b cmd to download image data

10:15 note encoder values are #36 for filter wheel (F1), #35 for door (closed)


10:24 images are fine so far, cal lamps are operative, ccd sensitive, optics
 transmissive, door still close :-)

10:28 zero gaps in playback reported

10:29 radiated heat pulse sequence

10:33 test UDP on board

10:35 received hk alarm on 5V current as seen with vc1 when motor is powered
on top of thermal control turning htr on, ok

10:36 radiated fw init cmd

10:41 fw init found residual steps 3, encoder at end of init is 36 at F1

10:43 filter wheel rotated to pos 2, ok, end 26/2; cal lamp para changed, ok


10:47 2 full frames in F2, move to F3, ok, enc 19/3 with jitter to 20/3

10:52 2 full frames in F3, move to F4, ok, enc 10/4

10:58 2 full frames in F4, move to F5, ok, enc 4/5

11:03 2 full frames in F5, move to F6, ok, enc 58/6

11:12 2 full frames in F6, move to F7, ok, enc 52/7

11:14 2 full frames in F7, move to F8, ok, enc 42/8

11:17 2 full frames in F8, move back to F1, ok, enc 36/1, cal lamp off

11:22 life boat cancelled (radiated)

11:26 go to renew the 4th life boat, radiated (ends 14:56 with 30 min margin)


11:28 temperature sanp shot: CCD -50.37, camera head -18.9, radiator -70.77
baffle -28.88, i/f 7.1

11:30 start playback of image data in vr8

11:40 all images are down, 0 gaps, analyzing images

11:44 radiated back to realtime

11:49 radiated sequence to acquire dark images (2x 1sec, 300sec, 30 sec)

11:57 6 darks acquired, streaming out to VR, done

12:03 checked temperatures and hk prior to door opening, ok; door enc reads
35, decoded 'closed'

12:10 radiated door open sequence

12:15 door is open, encoder reads 14/open, yeah

12:16 radiated 3 full frames in F1 (36/1), goto F8, enc @ end of sequence:
42/8

12:23 radiated 3 full frames in F8 (42/8), goto F7, enc @ end of sequence:
52/7

12:30 checked temperature effect of open door, see baffle temp drop and hot
motor from door opening

12:40 radiated 3 full frames in F7 (52/7), goto F6, enc @end of sequence: 58/6


12:58 temperature snap shot: radiator -69.8C, cold stack -54.1C (pt2000
corrected), CCD -49.9C; baseplate is at 7.4C; duty cycle ch 19%, baffle 49%
  -Note: correction of pt2000s is FC1-CCD-A: subtract 2.1C, FC1-CCD-B:
subtract 2.0C, FC1-CH-A: subtract 3.1degC, FC1-CH-B: subtract 2.8C


12:56 radiated 3 full frames in F6 (58/6), goto F5, enc @end of sequence: 4/5


13:12 radiated 3 full frames in F5 (4/5), goto F4, enc @end of sequence: 10/4


13:28 radiated 3 full frames in F4 (10/4), goto F3, enc @end of sequence: 19/3


13:44 radiated 3 full frames in F3 (19/3), goto F2, enc @ end of sequence:
26/2

14:01 radiated 3 full frames in F2 (26/2), goto F1, enc @end of sequence:
36/1

14:18 radiated 'random' filter access f1, f4, f7, f1, 2x, 1sec, 30sec, ok

14:29 radiated close door cmd, enc changed from 14/open to 35/closed

14:34 radiated acquisition of darks, running, done, ok

14:52 radiated door init, executed (mcu pwr busy), ok

14:55 temperature snap shot: radiator -69.8C, cold stack -54.6C
(pt2000 corrected), CCD -50.3C; baseplate is at 7.7C; duty cycle ch 16%,
baffle 53%

14:57 radiated fee pwr off and checked hk, done

15:04 ready for preppowerdown, radiated, done and fine, checked parameter
hardware and life time table dumps and ok

15:12 power down fc1, ok

15:17 ccd temp going up by ccd non-op htr, ch htr enabled, thermal handover
done successfully

15:20 radiation to kill life boat

15:26 life boat terminated

15:30 starting desat

15:45 temperatures are back to cruise, non-op heaters are operating

16:07 ready for playback, radiated, awaiting first light images

16:10 first light received, nice..

16:56 all images downloaded


note: s/c apid forwarding was none functional on fc1
current


          - unused themal sensor 3047 not removed yet (as of fc2 runs)


          - tune down of s/c read pt 2000 themistors not performed yet

Summary:

The Dawn Framing Camera FC1 was turned on for slightly more than 7
hours for functional checkout. It received 150 cmds, acquired 102
images, 12776 hk frames, and 12324 events. All radiated sequences ran
nominally, the instrument worked fine. All FC1 subsystems were found
alive and functionally unaltered by the launch event. The filter wheel
initialization found the 3 step off pre-launch configuration. The
electronics performed nominally, the CCD and optics performed
nominally. Filter wheel mechanism checkout cw and ccw and multiple
filter change test were ok, front door operation was nominal, a door
init was run to leave the unit in nominal state at power down. A few
housekeeping alarms were noted during motor pulse check while thermal
control used the heaters. Yellow and even one red limit were
triggered, but current delivered to the subsystems was well within the
power converter unit capability. This hick-up was seen on FC2 before
and is a one time c/o feature only. The CCD reached steady state at
approx. -50.3C with camera head at -20C (16% duty cycle) and deck at
+7.2C. There is good potential to get CCD temperature further down by
decrease of camera head and deck temperatures. The image data was
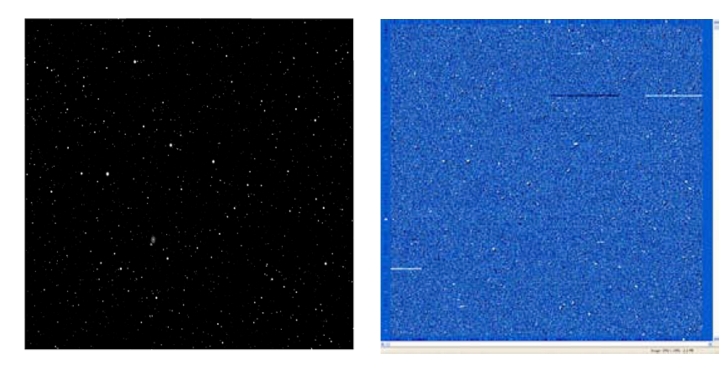
quicklook analyzed, find samples attached. Optical performance shows
good sensitivity and excellent star psf, fwhm 1.23px x 1.18px in 3s
exposure @Vmag 6.9, the unit is well in focus. We saw debris again. We
saw M51 galaxy clearly. Deeper analysis is to come. Congratulations
again to the Dawn team at JPL, DSC, and home at MPS. We do have 2
science cameras on their way.. H Sierks for the FC Team, 10 Dec 2007

attachments:

 - this report of activity

 - fit analysis of serial images

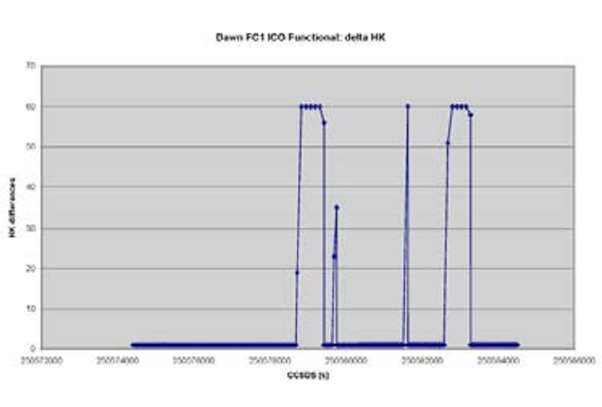
 - plot of hk ccsds packet deltas on p/b hk periods

 - star catalogue FC FoV in ICO pointing

 - first clear filter image

 - debris image
Attachments:
9.2 FC1 CCD Minical test report
Dawn FC1 ICO CCD Calibration Test Block; DSC/UCLA
12 Dec 2007 (M Aye, S Schroeder, H Sierks, H U Keller, S Mottola at DSC;
P Gutierrez, T Maue, M Richards at MPS)
- ccd temperature was found in steady state with rampage readings of
 -63.7C and camera head at -18.9C around 50% duty cycle; deck temperature is
 -2.8C with unit off

- all times herein are DSC local time/PST
10:30 voca check ok

10:32 checked space weather on noaa, found sun on decline of small solar event


10:40 FC1 thermal data is ok to proceed

10:48 all stations go for test

10:49 FC1 CCD cal sequence radiated

10:56 power on and boot ok

10:57 temp snap shot: CCD -62.53, radiator -77.75, ch -22.89, i/f -2.6, all
degC

11:00 UDP upload successful, FEE is on and ok

11:06 20 minutes for thermal stabilization with test image acquisitions (4)


11:15 cal lamp is off

11:20 imaging test pattern, storage read outs, serial readout, darks

11:41 CCD checkout sequence started, done.

11:57 opening door, ok

12:14 door is closed at enc #35, filter wheel at F1, enc #36

12:19 FEE off, hk ok

12:27 first image received

12:30 test pattern received and ok

12:34 found noise pattern in serial images, have to get characterized

12:57 43 images received, will get open door images soon...

13:09 71 images downloaded, star field are sub framed due to coding
residual:-(

14:05 last packet received, FC1 is powered off

14:08 ccd temp going up by ccd non-op htr, ch htr enabled, thermal handover
done successfully

14:17 temperatures are back to cruise, non-op heaters are operating nicely

14:20 no gaps reported, end of test


Summary:

The Dawn Framing Camera FC1 was turned on for slightly more than 3
hours for CCD checkout by use of calibration lamp. It received 68
cmds, acquired 72 images, 5644 hk frames, and 5716 events. All
radiated sequences ran nominally, the instrument worked fine, all
subsystems were activated during test. Both mechanisms were operated
in order to gain confidence: the filter wheel was operated thru all
filters imaging 'random' star field as of ICO pointing. The front door
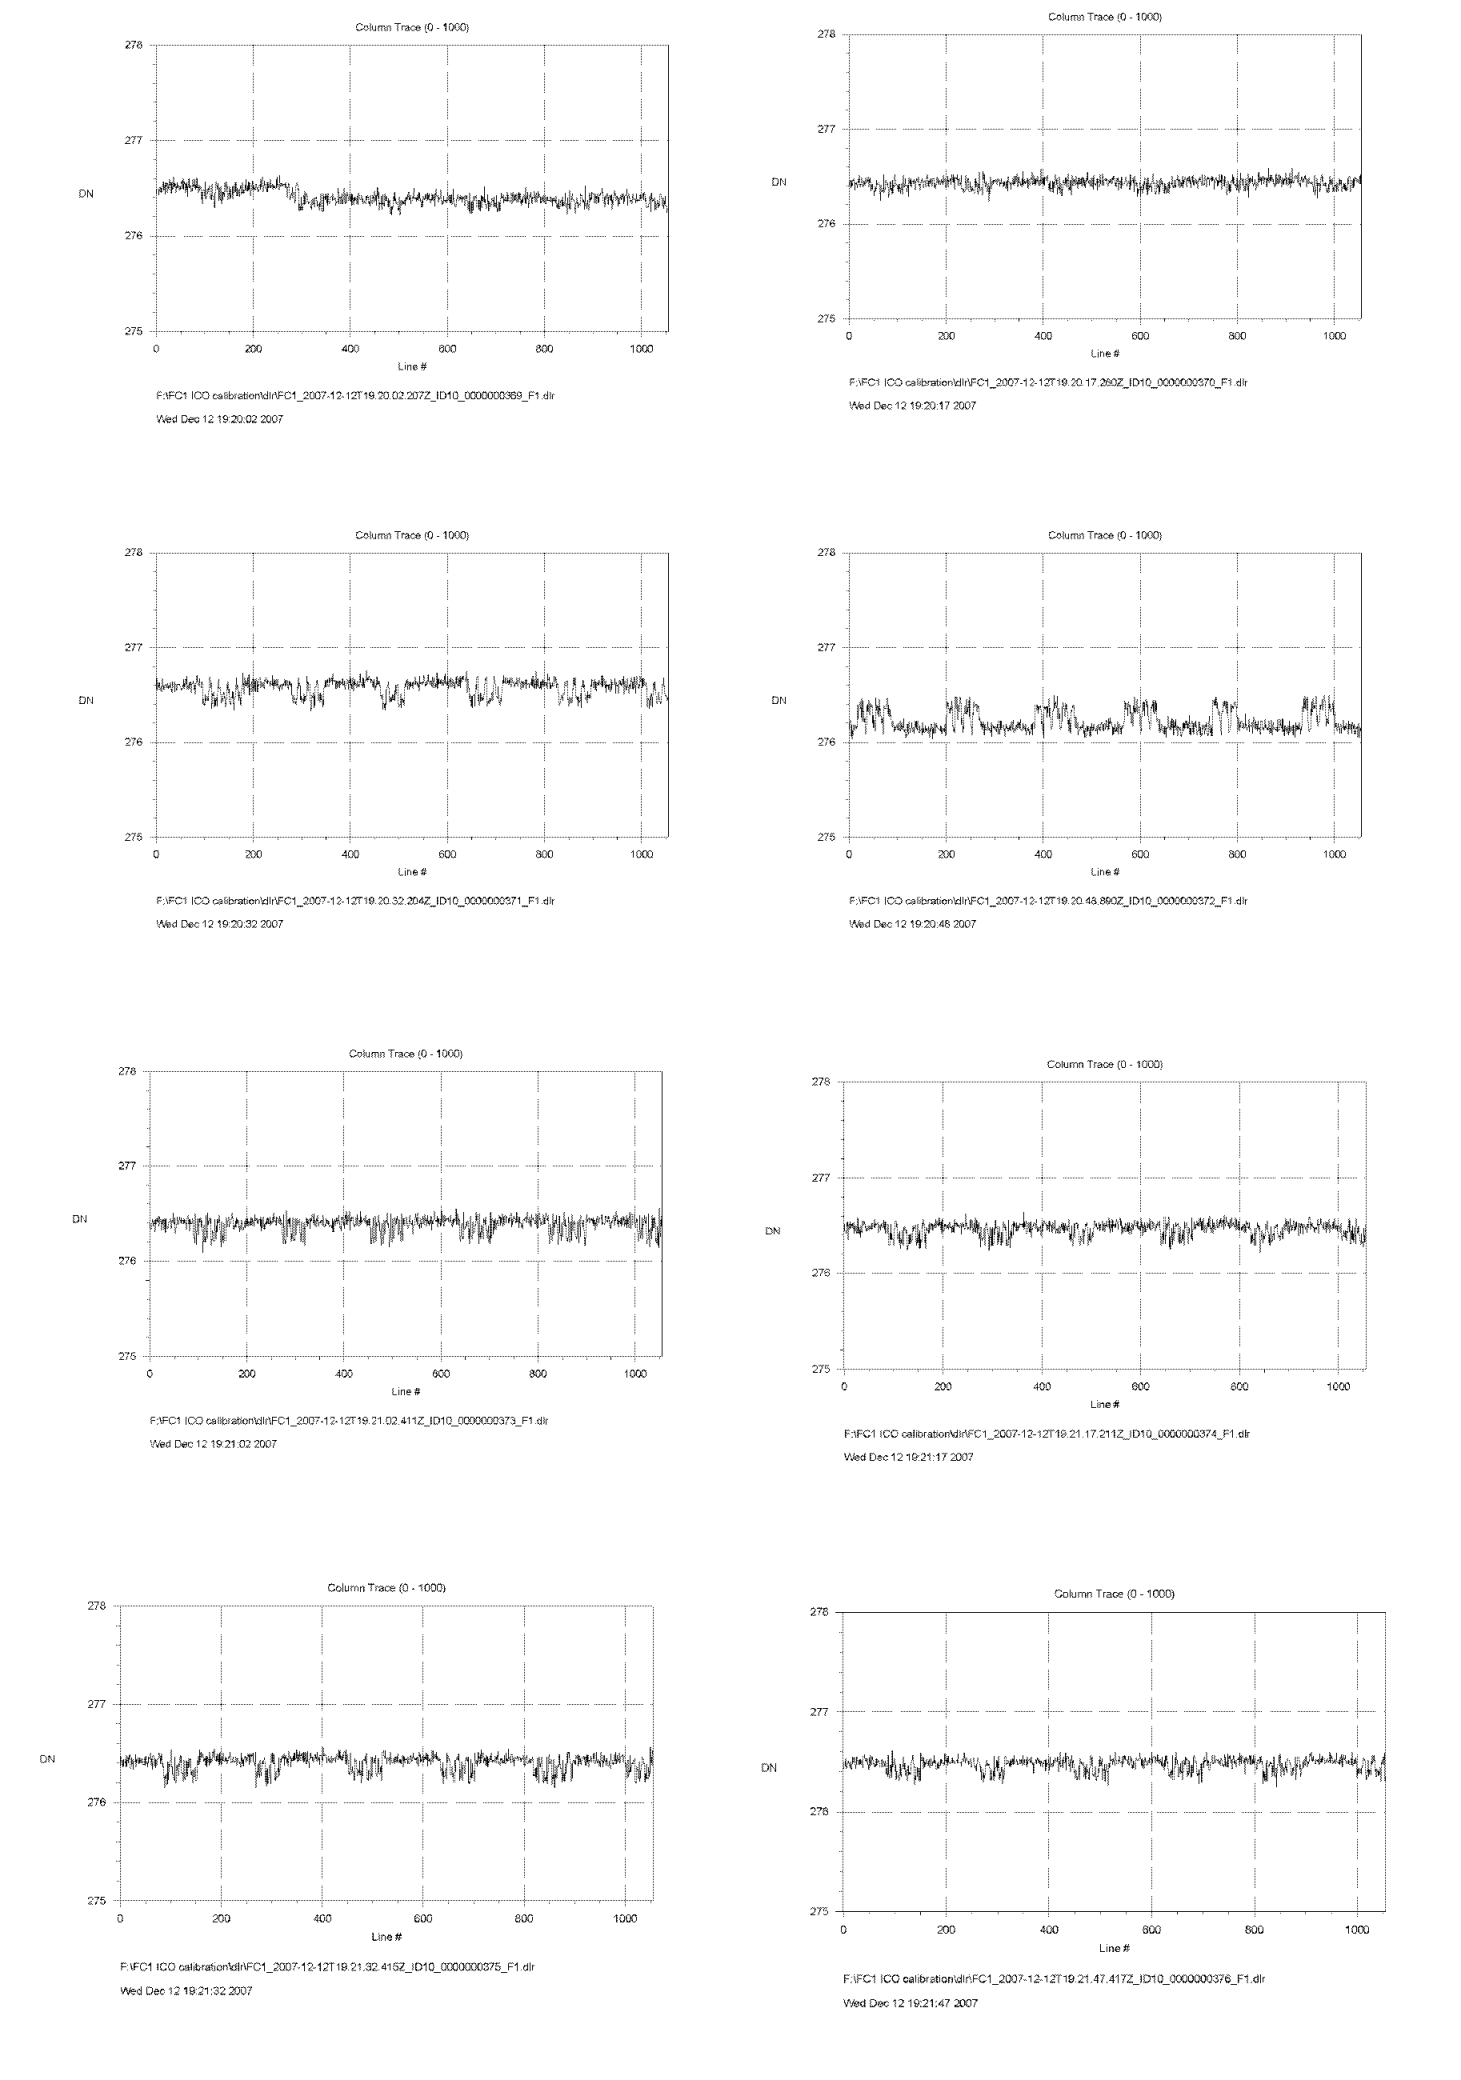
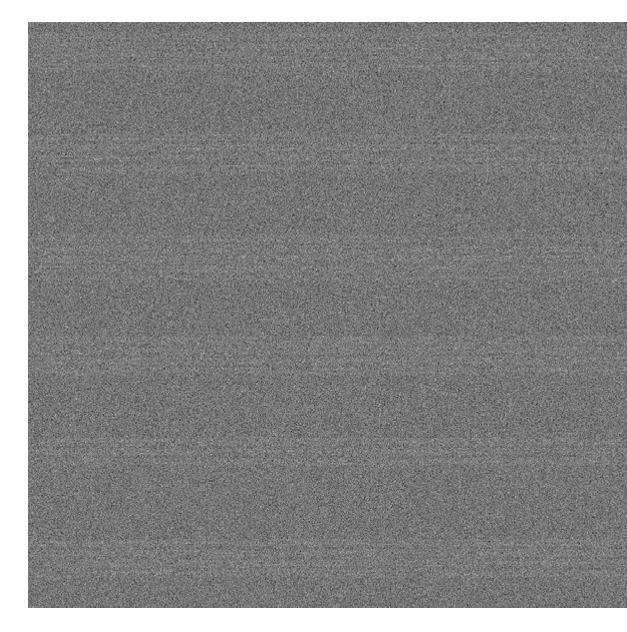
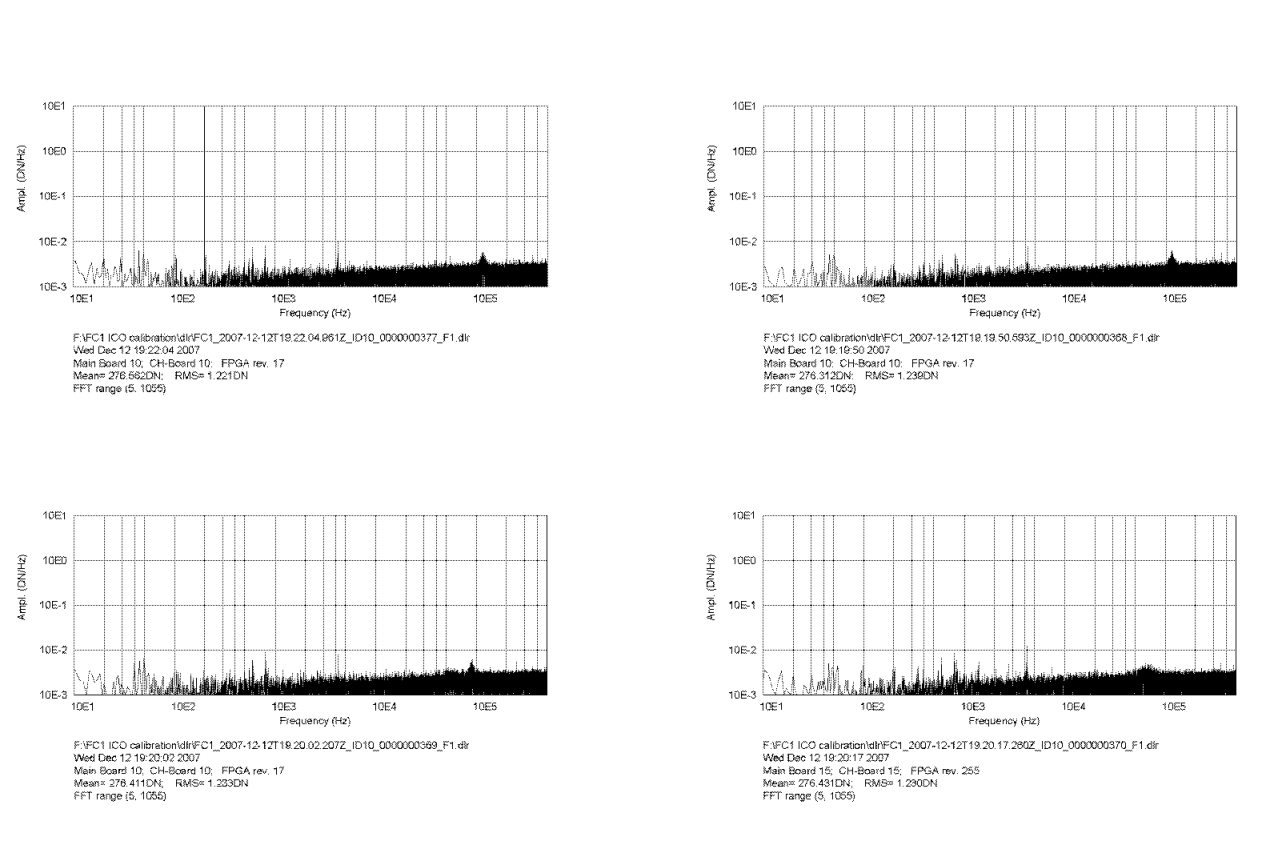
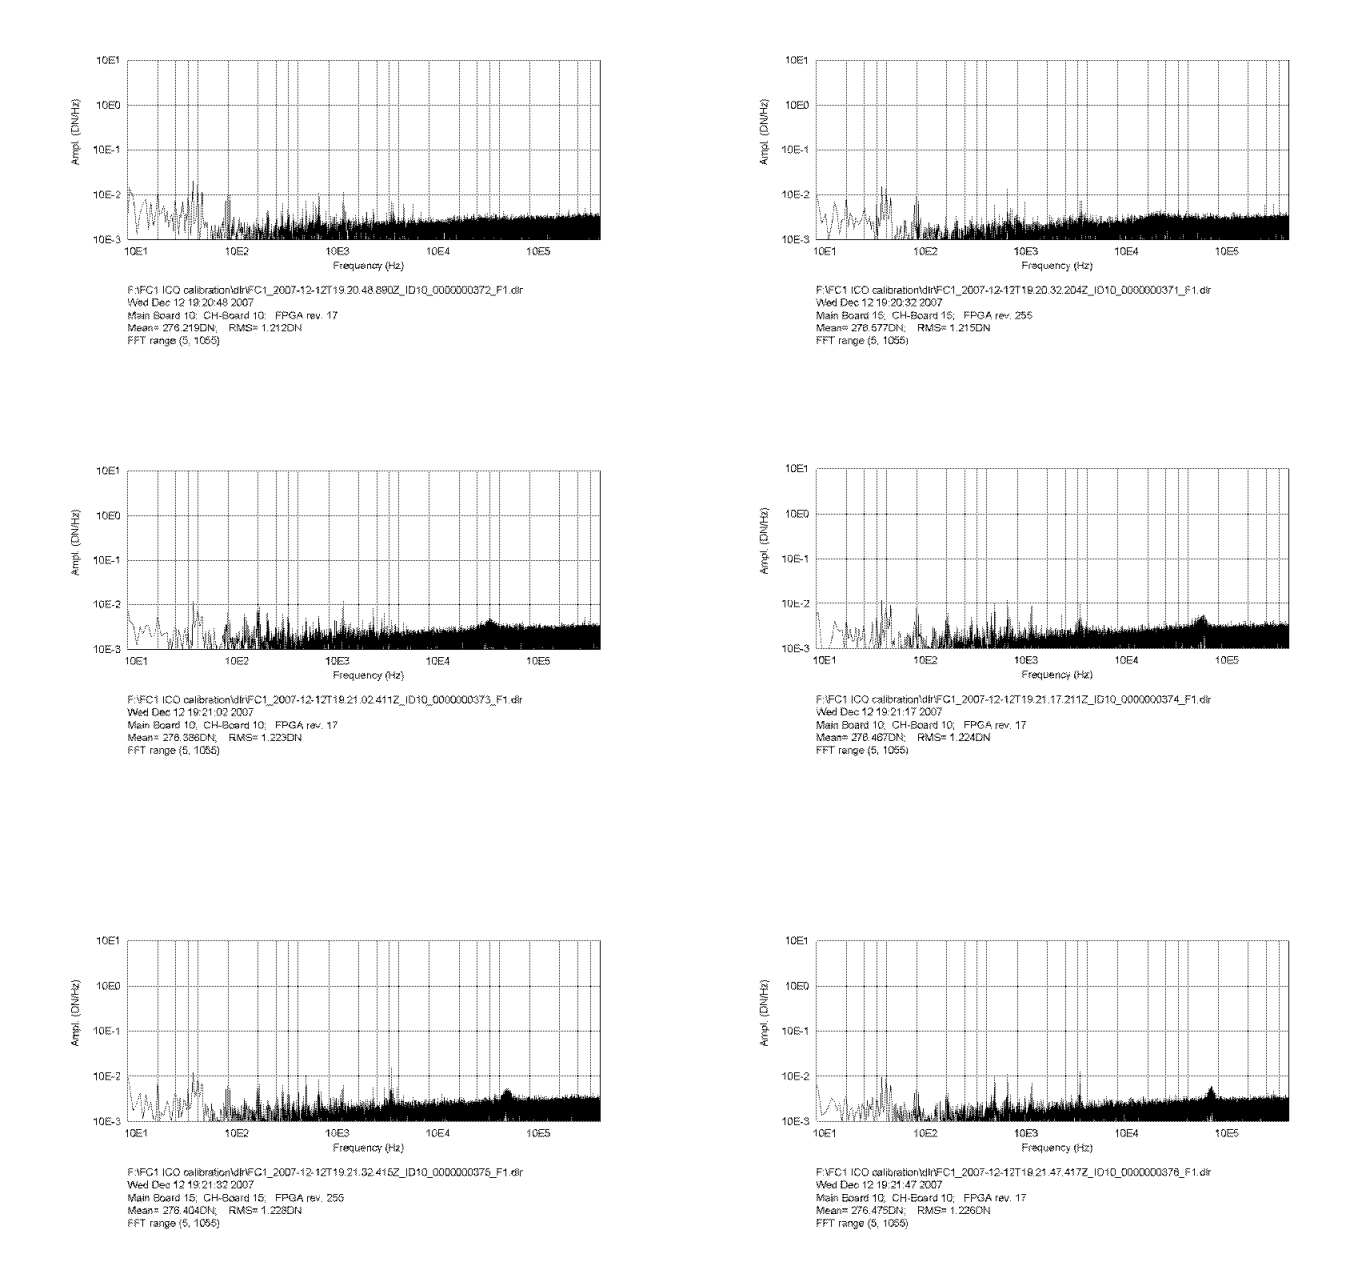
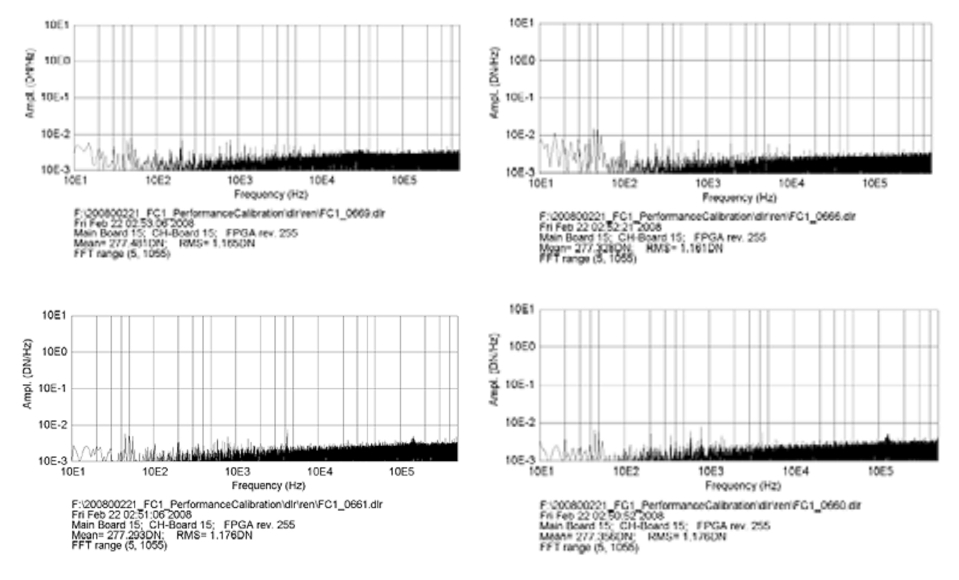
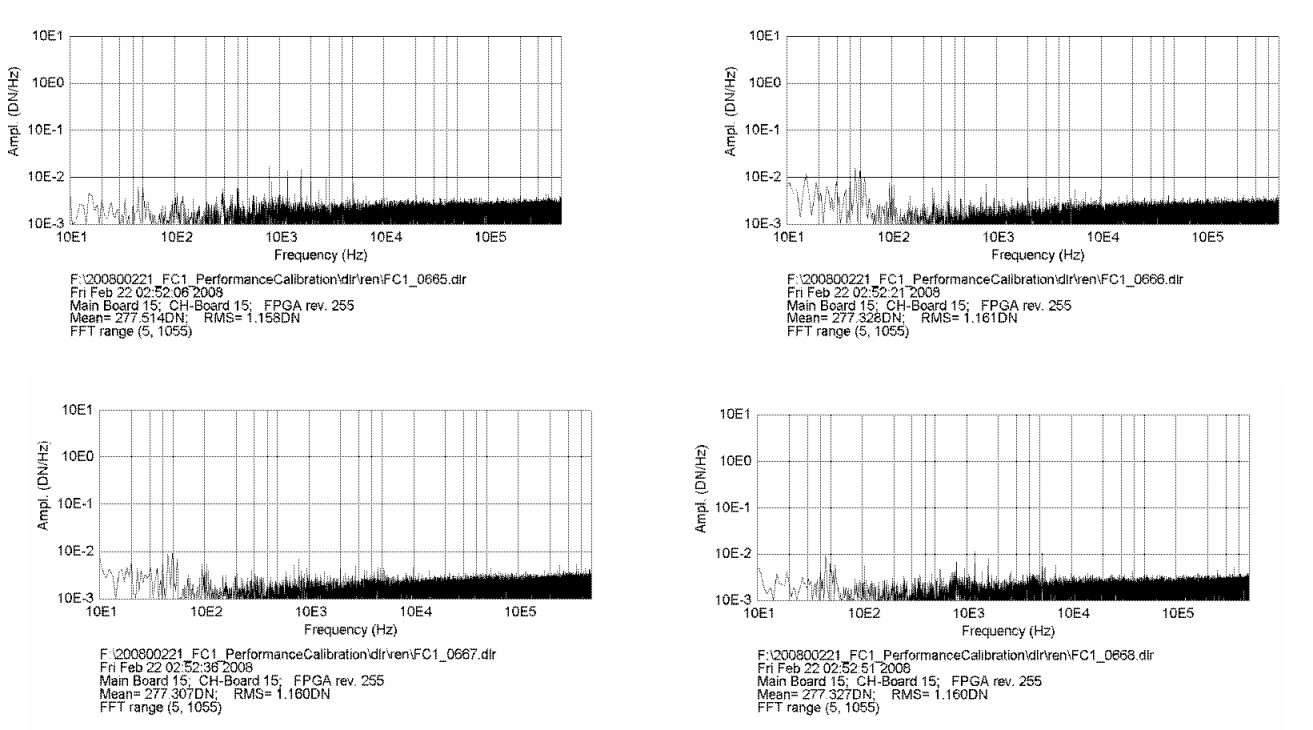
was opened and closed successfully. Analysis of serial images reveals
pattern at 5Hz and triplet at 45/50/55 Hz visible at a level of about
0.4 DN in the images. Check of s/c TVac data shows same triplet in
fft, but non visible in image display; thus at fairly low intensity.
Same for FC2 in performance checkout, triplet or single frequency 45,
50, or 55Hz visible, but effect not detectable in image display. Star
field came down as sub frames. This was unexpected as full frames were
thought to be commanded. Check of coding revealed residual in
commanding sequence that had sub framing switch set to on using
default windowing setting. Images are ok for the purpose of this test
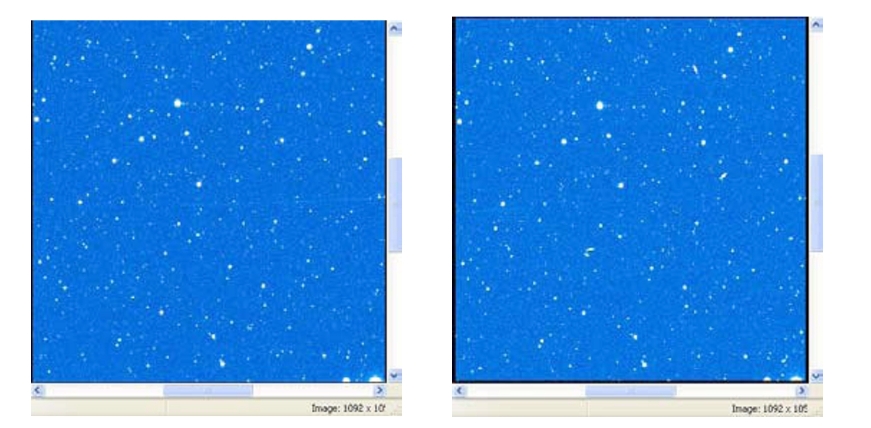
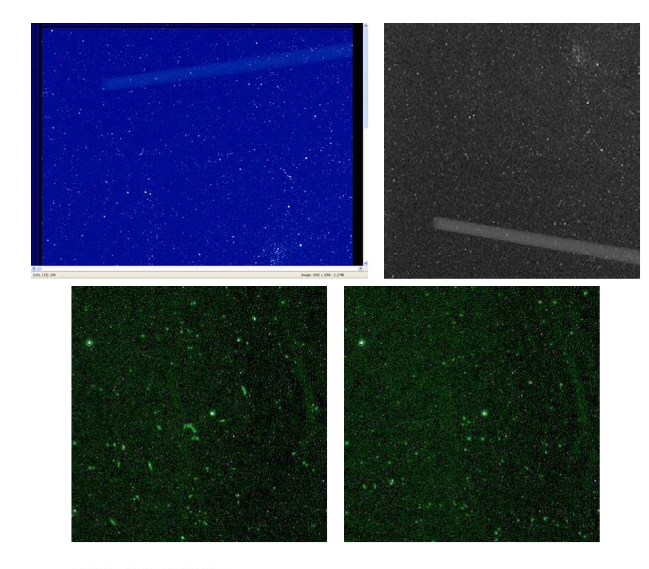
just taking advantage of the open door.  Two out of 18 open door
images show faint streaks, they appear to come from +x moving towards
-x in z-x plane. Streaks may be investigated in more detail by stereo
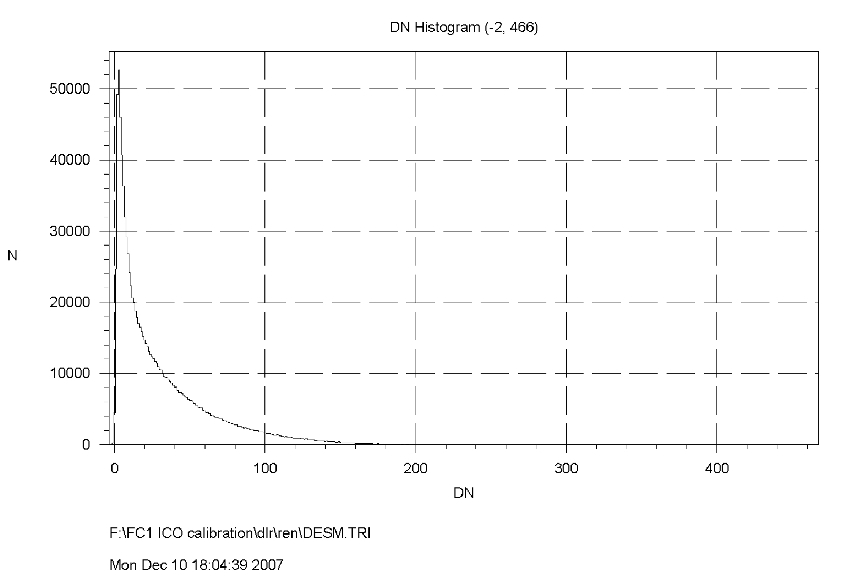
imaging using both cameras concurrently. Quicklook analysis of cal
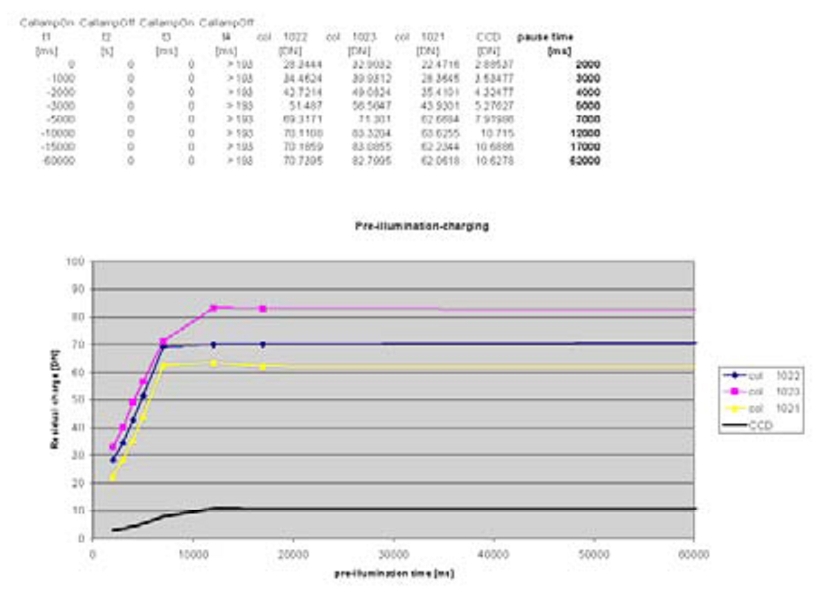
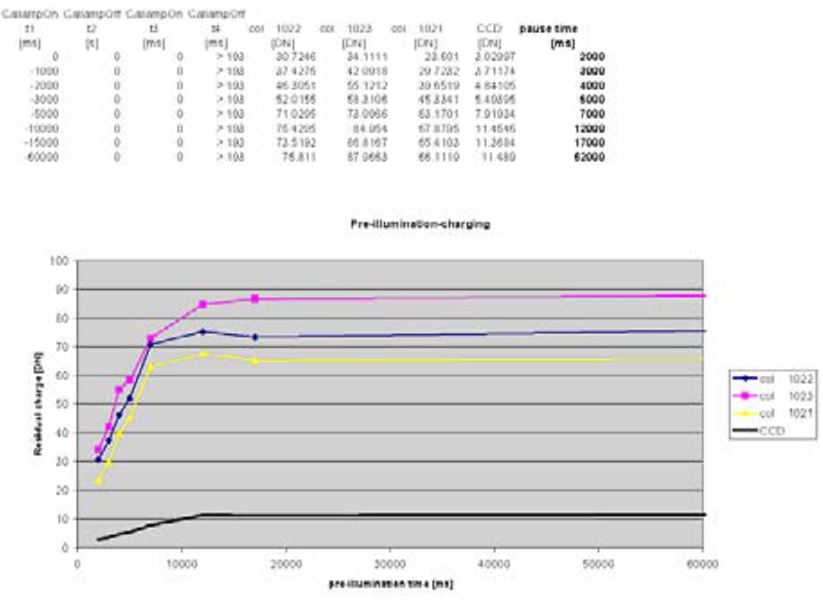
lamp images show residual charge at the CCD. The data set is usable
for comparison with ground data and FC2 data as of FC2 calibration
test on Dec 14, 2007. Thanks to the Dawn team at JPL, DSC, and home at
MPS. There is data to analyze though.. H Sierks for the FC Team, 12
Dec 2007

attachments:

 - this report of activity

 - line scans of the 10 serial images

 - fft of the 10 serial images

 - image display of 19:20:48 serial image

 - two streak images taken in clear filter with 30sec exposure time:
FC1_2007-12-12T20.01.28.785Z_ID10_0000000417_F1.dlr
FC1_2007-12-12T20.02.08.823Z_ID10_0000000418_F1.dlr
- residual charge histogram for reference in ground and FC2
comparison
Attachments:

9.3 FC1 Performance test report
This is a brief summary of the activities conducted on Feb 21st 2008 (2008-52)
Pass started right on time at 1400Z. Connection was established with both
DawnEgseSrv in Lindau and Dawn-QM-Egse at DSC
1420Z Power on . Boot sequence was nominal. VR8 packet counter before the
operation of the camera is 667065 VCDUs 1427Z FEE swtich on, MCU status 10,
Door encoder 35 (Closed), Filter encoder 36 (1)
Voltages and currents
30.60
0.60
16.24
31.94
12.10
64.28
5.20
269.50
-5.08
-74.80
5.29
1211.00
3.37
229.80
2.53
763.80
-5.21
-28.27
Temperatures
-59.66
9.72
5.74
7.49
7.75
-21.89
-22.89
-23.89
-21.90
-22.89
-76.75
1438Z DSC reports that Epoxy spacecraft has gone into safe during the night
and the Epoxy team asks if it is possible to avoid commanding in the next two
hours.

- The fact is that there is no commanding scheduled and if the need should come
to send a contingency sequence, we are still free to do so.
  - They will not take the tracking pass from us.
- 1448Z 25 min after power on, the i/f temperature has rised from 1 to 5 C.
  - CCD Temperature (PT2000) as rised from -62 to -57.
  - Thermal control is catching up from a minimum temperature of approx -24 C
- 1523Z 1 hour after power on, the i/f temperature is 8.2 C.
  - CCD Temperature (PT2000) is -54.1 C. We read -51.90 C
  - Thermal control is stabilizing around 42%
- 1530Z The stabilization period has completed with 21 images (as opposed to the
20 displayed in the control file).
  - The standard set of reference images are being acquired.
- 1555Z The set of dark images has completed with 42 commands and 40 images. Cal
 Lamp is enabled and ready for the cal lamp phase.
- 1615Z Cal lamp set completed with 34 images (as opposed to the 35 displayed in
the control file). The counters show 98 commands and 74 images.
  - Playback started at 1616Z
- 1640Z All images transmitted to VR8. VCDU counter shows 774202
- 1646Z Back in RT124K. 48 image were transmitted. Starting Door opening
sequence.
- 1650Z Door opened successfully (Encoder 14).
- 1905Z Engineering data playback has completed. The images in all filters and
long exposures have completed nominally.
  - The command and image counters show 130 and 97. CCD temperature is back to
       -52.5 C, i/f temperature down to 8.3 C.
  - With an open door, thermal control stabilizes around 15 % on the CH, 40% on
the Baffle
- 1925Z Second playback round provided 25 more images for a total of 73. Image
481, that did not complete in the first playback session came corrupted.
  - This is in line with past experience from FC2 Performance, where the images
that were interrupted never recovered.
- 1930Z Turn to Vega started.
-2225Z Telemetry re-established. Camera reports 343 commands and 214 images
acquired in total. This is in line with the expected transmission of 213
  - commands and the acquisition of 117 images. CCD temperature (PT2000) is
       -52.5 C and i/f temperature 9.8 C. The camera reads -50.50 C
- 2237Z Door closed nominally for an encoder value of 35. The filter wheel is
back in clear filter at encoder 36.
- 2258Z The final darks were acquired for a total of 220 images.
- 2303Z FEE was switched off nominally
- 2308Z Camera was switched off nominally and the CCD non-op heaters stayed off.
CH heaters are initially off but are expected to kick in as soon as the CH
cools below -22.
- 2313Z FC Team gave GO for upload of the Calibration sequence. 1st bit
radiation time was 23:08:28
- 2315Z Playback of VR3 showed no errors and just a warning about the door
being already closed during the FCPrepPowerDown.
- 2324Z Playback of VR7 completed and science data started to come
- 2338Z The temperature of the CH has stopped falling, probably because of the
non-op heaters (the low datarate does not allow to confirm that the heaters
are really cycled).
- 2358Z Playback completed. 219 images have been retrieved. Image 529, the last
in VR10, is missing.
  - Probably we should be able to recreate them from the DSC files.
DOY 053
0010Z The activity of the CH non-op heaters is confirmed. Temperatures 1 hour
after power down are -61.1 C on the CCD, 4.5 on the i/f.
0133Z DSC generated the TM files from TDS and both APID 74 and 76 showed no
gaps, but TRAP still report corruption of image 481 (the one that was paused
during continuous playback) and the missing of the end of 529 (from VR10)
Flight has requested and obtained approval to radiate the commands to replay
dataset 1 on VRs 8 and 10 in an attempt to retrieve the missing data.
This replay was completed at 0142Z
0223Z FC1 is powered up for Calibration
0246Z Tracking pass is ended
0249Z VCDU counter on VR8 is 807026, on VR10 is 52552
After some workaround we were able to find the missing packets of image 529
and complete the image. Still image 481 found no missing packet, just a
corruption at some point, but we have not been able to determine where it
happened.
9.4 FC1 Calibration test report
2008-053T18:12Z
Pass has started, connection to EGSEs at DSC and in Lindau is successfully
reestablished. FC1 and FC2 status is as expected: both cameras are off and
ready for long-term cruise (CCD heaters warm and under S/C control, CH cold
and under S/C control).
Duty cycle on the non-op heaters is approximately 50 % for the CCD and less
than 10 % for the CH on both cameras. Baseplate temperatures are 1.8 C for
FC1 and 0.7 C for FC2.
Event playback showed no errors and just the usual warning about the door
being already closed.
The camera reports having acquired 190 images with no errors.
It reports two (2) door operations (opening and closing) and 56 filter moves
with no errors.
On a preliminary evaluation of the images, the effect of extra charge can
be seen with bare eyes.
The playback completed with 190 images, 222 commands, 17165 HK packets and
2500 events
Side track: FC1 Performance investigation
The second file delivered by DSC contained image 528, not 529. The fact that
it is the beginning of an image triggered the saving of image 529 when this
file was processed after the original file, but none of them contained the
final two (2) packets of image 529
In the investigation of image 481:
The last packet received in the first phase of playback was 7976, with SCLK
256881709:082 (256881709 seconds and 1377296384 fractions). This
packet included ULONGs [5270, 5521) of the image.
The first packet after resuming the playback was 7977, with SCLK 256881709:087
(256881709 seconds 1464152064 fractions). This packet included ULONGs [5521,
5772) of the image.
The attached file FC11A0000481_08052155318F5A.raw is the image as it was
received on ground (prior to decompression). A row of zeros can be seen in the
middle of compressed data starting at byte 22738 (ULONG 5684) until byte 23088
(ULONG 5772).
The conclusion is that the header of the packet and the beginning of the data
of packet 7977 was transmitted correctly but not the end of the packet.
In the investigation of image 487:
The last packet received in the first phase of playback was 14710, with SCLK
256882245:031 (256882245 seconds and 515145728 fractions). This packet
included ULONGs [181723, 181974) of the image.
The first packet after resuming the playback was 14711, with SCLK
256882245:036 (256882245 seconds 600985600 fractions). This packet included
ULONGs [181974, 182225) of the image.
The attached file FC11A0000487_08052155627F5A.raw is the image as it was
received on ground (prior to decompression). A row of zeros can be seen in the
middle of compressed data starting at byte 728708 (ULONG 182177) until byte
728900 (ULONG 182225).
The conclusion is that the header of the packet and the beginning of the data
of packet 14711 was transmitted correctly but not the end of the packet.
Because of the late appearance of the error in the file, the relevance is
small and escaped visual inspection, but a more detailed analysis shows a
relevant difference with neighboring images.
In the investigation of FC2 image 408:
The last packet received in the first phase of playback was 8034, with SCLK
250006541:036 (250006541 seconds and 599293952 fractions). This packet
included ULONGs [18824, 19075) of the image.
The first packet after resuming the playback was 8035, with SCLK 250006541:041
(250006541 seconds 686100480 fractions). This packet included ULONGs
[19075, 19326) of the image.
The attached file FC21A0000408_07338020630F1A.raw is the image as it was
received on ground (prior to decompression). A row of zeros can be seen in the
middle of compressed data starting at byte 76722 (ULONG 19180) until byte
77304 (ULONG 19326). The conclusion is that the header of the packet and the
beginning of the data of packet 8035 was transmitted correctly but not the end
of the packet.
Image 408 shows a second segment of missing data:
The last packet received in the second phase of playback was 8070, with SCLK
250006542:246 (250006542 seconds and 4122198016 fractions). This packet
included ULONGs [27860, 28111) of the image.
The first packet after resuming the playback was 8071, with SCLK 250006543:031
(250006543 seconds 513327104 fractions). This packet included ULONGs [28111,
28362) of the image.
The attached file FC21A0000408_07338020630F1A.raw is the image as it was
received on ground (prior to decompression). A row of zeros can be seen in the
middle of compressed data starting at byte 112458 (ULONG 28114) until byte
113448 (ULONG 28362).


9.5 FC2 Functional test report
Dawn FC2 ICO block 1 (functional checkout); DSC/UCLA
18 Oct 2007 (HU Keller, H Sierks, P Gutierrez, M Richards, T Maue, S Mottola)
- ccd temp reached steady state at -66.8C/-66.5C with camera head at
     -21.7/-21.2C, pt2000 final calibration tunes not applied yet.
  - (FC2-CCD-A: subtract 2.6 degC, FC2-CCD-B: subtract 2.6 degC, FC2-CH-A:
     subtract 2.8 degC,  FC2-CH-B: subtract 2.2 degC) so real temperatures are
     closer to -69.4C with camera head at -24.5C compared to s/c tvac -61C at ch
     -19C, so ccd is ~3C colder in space wrt tvac
- PG implemented egse change to omit old packets which will enable us to
 see realtime events during playback; it cleans up s/c hk plots in playback
- updated fc egse and hk egse on these mods
- reported at the status mtg the ccd temp drop went fine, ~3deg colder
than tvac, and calibration tune not in yet
- filter table will be jammed during playback as requested allowing all
events coming down in playback (actions done last night by carol and team)
09:12 voca check (all times to follow are dsc local time/pdt)
09:20 checked space weather on noaa, sun is quiet, no solar event nor cme
09:22 red-line procedure walk thru done
09:29 all systems are go to proceed with fc2 functional test
09:34 4h life boat sent (ends 13:04 with 30min margin)
09:36 fc2 power on radiated
09:48 power on ok, memory check running, ch temperature drops as thermal
control demon is not yet up and running
09:52 mass mem check ok, mcu turned on, hk & temps ok, power on htr test
ok
09:56 all hk fine :-)
09:58 radiated extended heater test cmd
10:00 thermal control stopped, ch htr turned on for 5min
10:05 ch htr turned off, ok
10:06 table patch sent and verified: 125 steps to open door (flight config)
10:07 turned baffle htr on for 5min
10:12 ok, htr tests went fine
10:14 sent fee switch on, all hk fine, ok
10:22 sent cmd acquistion of 'ten basics'
10:30 egse detected 1 limit violation on fee +5v current, o/b hkmonitor did
not detect this event, could be remnant of fee power up, checking.. ->
verified by egse playback, ok as linked to fee power up
10:43 first test pattern streaming down, ok
10:49 all 10 images down and look fine, checking, see cosmics, images are ok;
1 of 2 serial images shows 3 minor peaks at frequencies 603, 800, 4198 Hz
(reference for interference tests)
11:11 back to cmding after station handover
11:13 radiated cal lamp imaging sequence
11:21 images taken, processed and downloaded to the vr
11:24 radiated p/b cmd to download image data
11:31 images are fine so far, cal lamps are operative, ccd sensitive, optics
transmissive, door still close :-)
11:36 last 2 cal lamp images appear slightly different in exposure while all
settings were identical, checking. -> verified ok, was seen in ground test
before
11:40 radiated heat pulse sequence
11:44 received alarm on 5V current as heater check does not turn off thermal
control, ok as this test sequence is only used this very first time to
checkout the flight hardware post launch.
11:50 radiated filter hardware init cmd, executing, residual steps 0, so no
change compared to pre launch configuration, F1 encoder is 62/1
11:55 filter wheel rotated to pos 2, ok, enc 55/2; cal lamp para changed, ok
11:58 2 full frames in F2, move to F3, ok, enc 46/3
12:00 2 full frames in F3, move to F4, ok, enc 39/4
12:03 2 full frames in F4, move to F5, ok, enc 30/5
12:05 2 full frames in F5, move to F6, ok, enc 23/6
12:08 2 full frames in F6, move to F7, ok, enc 14/7
12:11 2 full frames in F7, move to F8, ok, enc 7/8
12:14 2 full frames in F8, move back to F1, ok, enc 62/1
12:18 cancelled life boat sequence
12:20 4h life boat sent (ends 15:50 with 30min margin)
12:24 start playback of image data in vr8
12:40 all images are down, 0 gaps, analyzing images..
12:41 radiated back to realtime
12:43 radiated sequence to acquire dark images (2x 1sec,300sec,30sec)
12:57 6 darks acquired, streaming out, done
12:59 checked temperatures and hk prior to door opening, ok; door enc jitters
between 9 and 10, decoded 'closed'
13:02 radiated door open sequence
13:04 door is open.
13:05 radiated 3 full frames in F1, goto F8, enc @ end of sequence: 7/8
13:10 checked ccd temperature: reached steady state at approx -52C compared to
-48C in TVac, thus get ccd ~4C colder in space wrt tvac
13:16 radiated 3 full frames in F8, goto F7, enc @ end of sequence: 14/7
13:20 checked temperature effect of open door, see baffle temp drop and hot
motor from door opening
13:30 radiated 3 full frames in F7, goto F6, enc @ end of sequence: 23/6
13:44 radiated 3 full frames in F6, goto F5, enc @ end of sequence: 30/5
13:53 temperature snap shot: radiator -69.8C, cold stack -54.6C (pt2000
corrected), CCD -53.0C; baseplate is at 6.8C comp to ~13C in TVac
13:58 radiated 3 full frames in F5, goto F4, enc @ end of sequence: 39/4
14:12 radiated 3 full frames in F4, goto F3, enc @ end of sequence: 46/3
14:26 radiated 3 full frames in F3, goto F2, enc @ end of sequence: 55/2
14:40 radiated cancel life boat sequence
14:42 4h life boat sent (ends 18:12 with 30min margin)
15:00 stefano checked ccd bias and found it consistent with ground tests
15:08 temperature snap shot: radiator -69.8C, cold stack -56.2C (pt2000
corrected), CCD -53.9C; baseplate is at 7.0C comp to ~13C in TVac
15:26 resumed cmd capability after station handover
15:28 radiated 3 full frames in F2, goto F1, enc @ end of sequence: 62/1
15:44 radiated 'random' filter access f1, f4, f7, f1, 2x, 1sec, 30sec, ok
15:52 radiated close door cmd, enc changed from 53/open to 9-10/closed
15:55 radiated acquisition of darks, running, done, ok
16:09 radiated door init, executed (mcu pwr busy), ok
16:12 radiated fee pwr off and check hk, done, taking hk snap shot
16:19 ready for preppowerdown, radiated, done and fine, checked parameter
hardware and life time table dumps and ok
16:25 power down fc2, ok
16:29 ccd temp going up by ccd non-op htr, ch htr enabled, thermal handover
done successfully
16:38 filter table patch sent and verified
16:42 cancelled life boat sequence
16:45 ready for playback, radiated, awaiting first light images
17:30 all images downloaded, analyzing..
18:30 all temperatures back to cruise, non-op heaters are operating
Conclusions:
The FC2 was turned on and run for more than 7 hours in commissioning
block 1 (functional checkout). It acquired 102 images, 11967 hk
frames, and 11654 events. All radiated sequences ran nominally. All FC
subsystems were found alive and unaltered by the launch event. The
electronics performed nominally, the CCD and optics performed
nominally. Filter wheel mechanism checkout cw and ccw and multiple
filter change test were ok, front door operation was nominal, a door
init was run to leave the unit in nominal state.
Two housekeeping alarms were noted: one was identified as artefact of
FEE switch on, when FEE ON was reported, but a subset of related hk
not updated yet, thus misleadingly sending an out-of-limit. The 2nd
out-of-limit was real, the motor pulse check to verify the filter and
door motor windings are present, was run on top of thermal control,
thus heaters and motors run simultaneously during this test when TC
turned on the camera head heater. This occurred once triggering
yellow alarm, which is well within the unit capability.
The image data was quicklook analysed, find samples attached. Optical
performance shows high sensitivity and good star psf (sigma 0.64px for
star Asellus Borealis), the unit is well in focus. Deeper analysis is
to come. Congratulations to the Dawn JPL flight team and the DSC team
making this test a success.
H Sierks for the FC Team, 18 Oct 2007
Attachments:
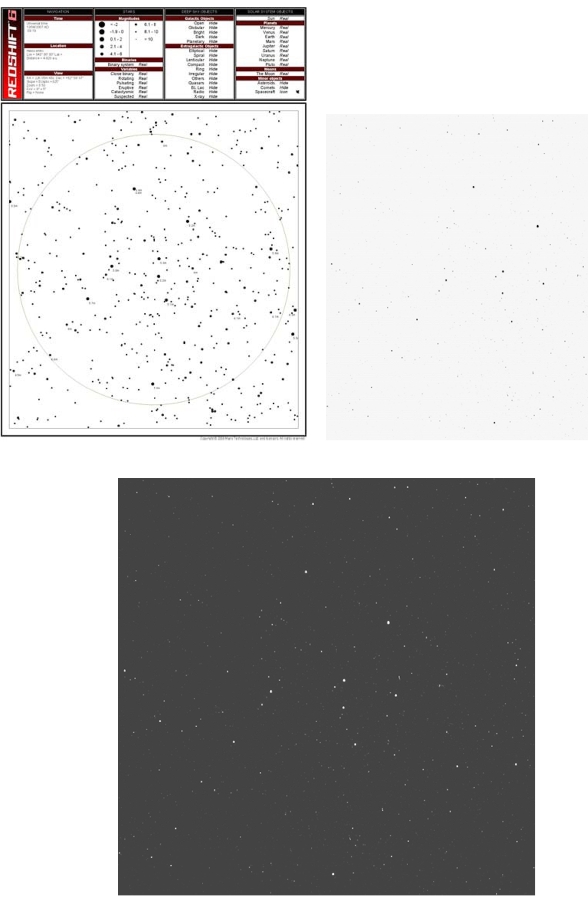
(1) pdf-file of expected star field
(2) bitmap of star field as seen by FC2 in clear filter, 30sec exposure
(mirrored wrt catalog star field)
(3) black stars on white ground representation
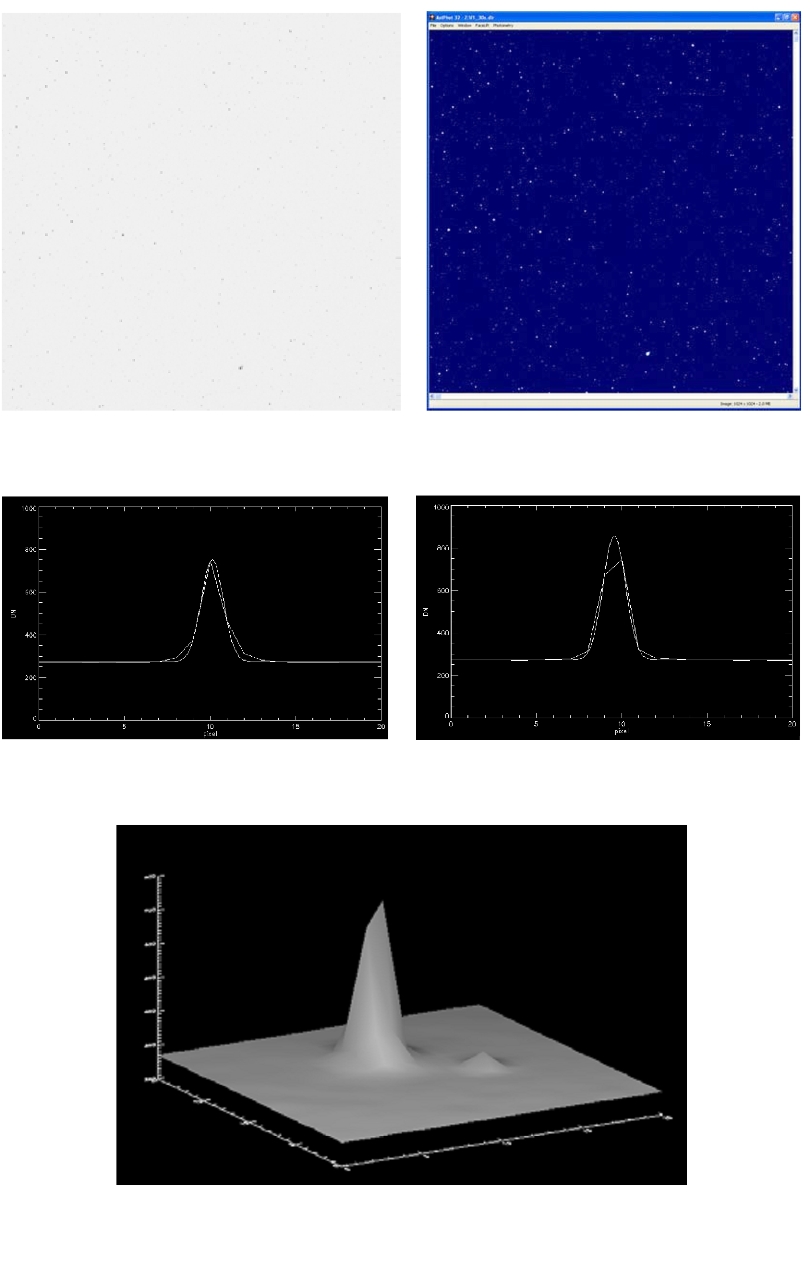
(4) sample PSF of one star to demonstrate optical performance
(5) housekeeping logs in pdf format
star: Asselus Borealis
mag = 4.6
exp_time = 3 s
max DN = 745
Gaussfit:
sigma_x = 0.643697
sigma_y = 0.654397
Dawn FC2 DSC ICO Functional Checkout
Housekeeping Summary
HK data from first hour of ICO FC2 Functional Checkout was ripped and plotted.
Preliminary statistics - averages, range, standard deviation - of voltage,
current and temperature parameters were produced for the entire interval or a
part of the interval (see Count). The following table is a summary of these
statistics.
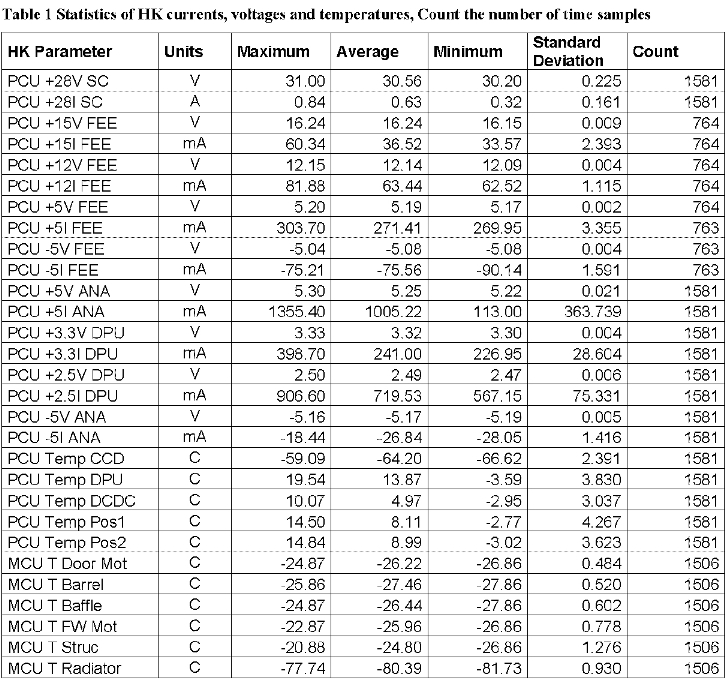
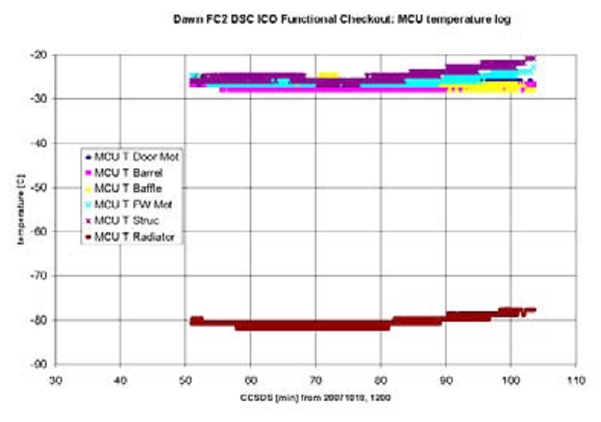
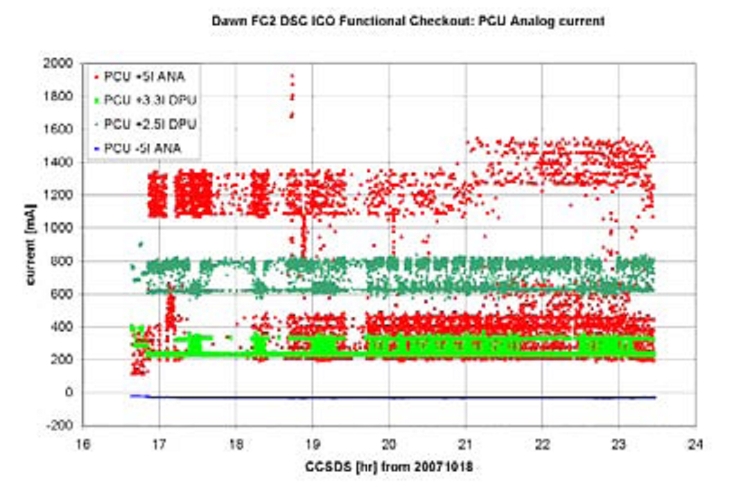
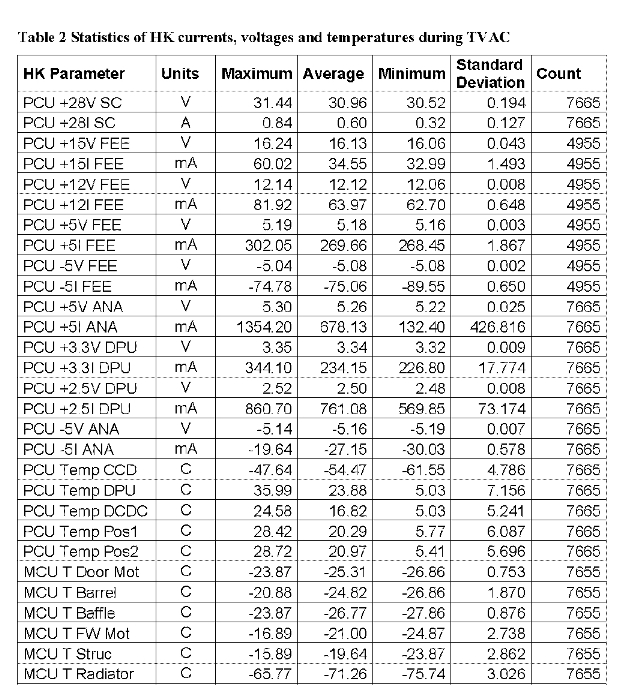
Table 2 provides a comparison to the ICO values of Table 1. These are the
comparable statistics for data obtained during Dawn S/C TVAC, 2007-02-05.
Differences are significant for currents and teperatures.
Temperatures during TVAC were higher than the ICO temperatures, the Radiator
and CCD 10C warmer, the PCU 20C to 23C, the DPU 27C hotter, the CH 6-7C
hotter, the Barrel 3C and the Baffle +-1C.
Average 5V analog current is significantly larger during ICO. The minimum
value is smaller, but this is due to the memory test during the beginning 13
minutes of ICO, a test not run in TVAC.
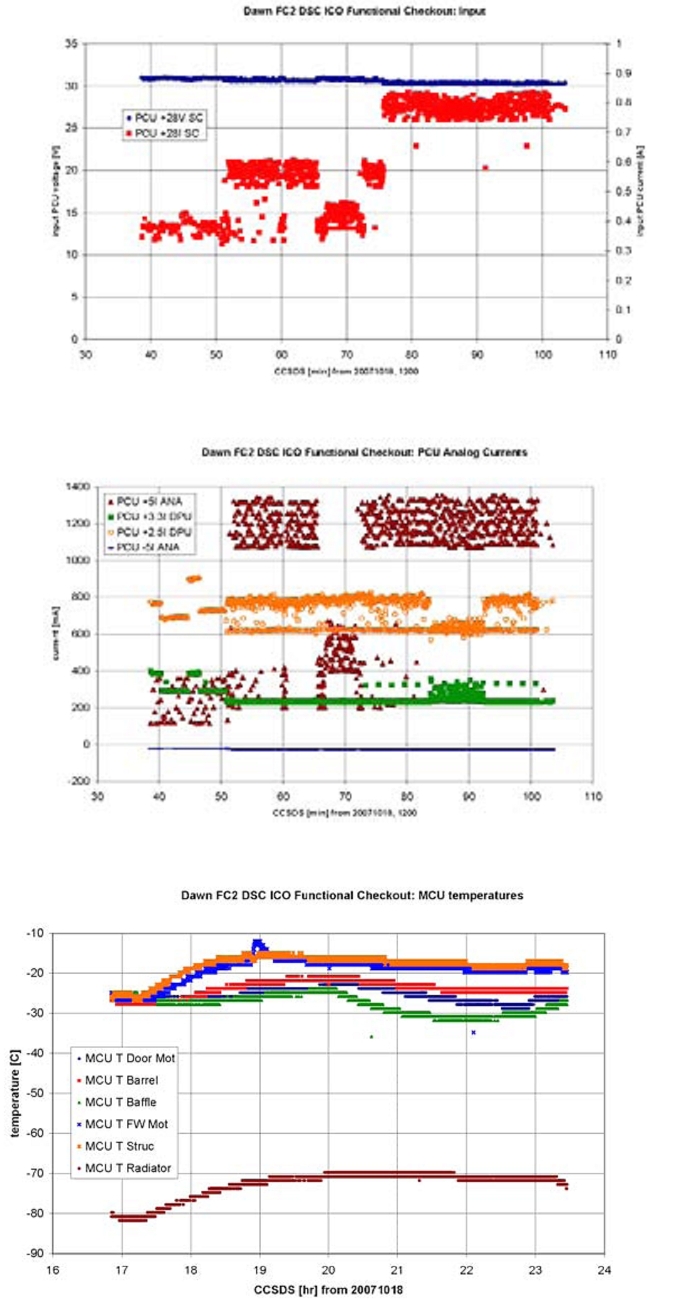
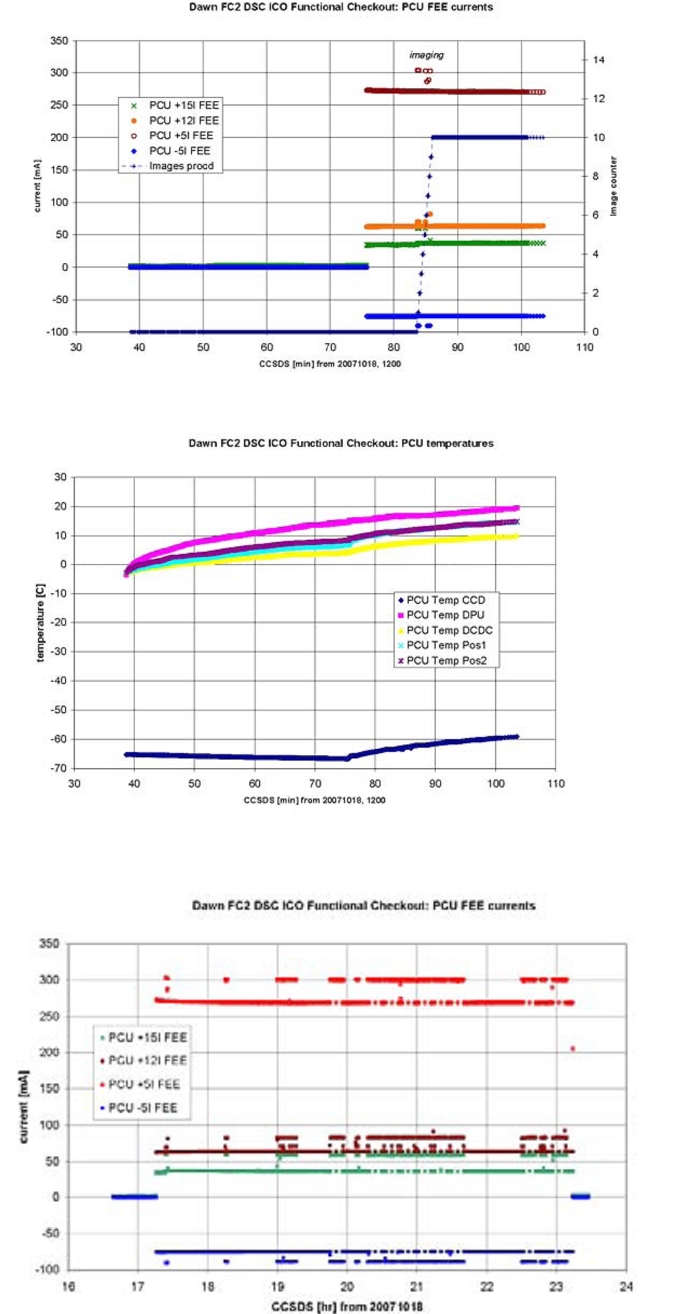
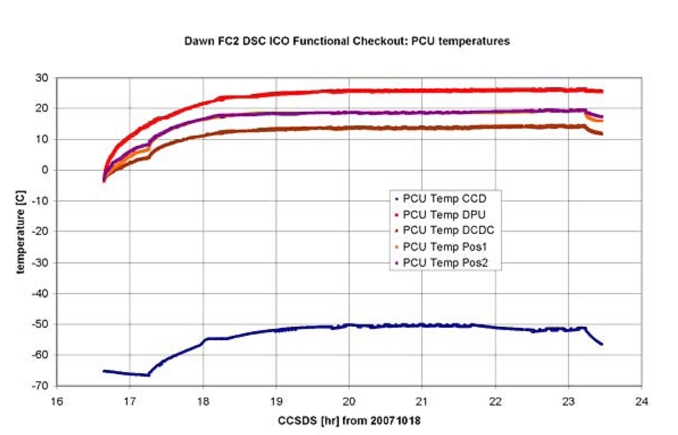
Following are the plots of temperature and currents. Voltages can be seen to
vary insignificantly (Fig. 1), so they were not plotted.
9.6 FC2 Performance test report
Dawn FC2 ICO Performance Block; DSC/UCLA
03 Dec 2007 (H Sierks, M Aye, S Schroeder, S Mottola at DSC; P Gutierrez,
T Maue, M Richards at MPS)
- ccd temperature was found in steady state with rampage readings of
-64.8C and camera head at -18.9C at 48% duty cycle; pt2000 final calibration
tunes not applied yet. (FC2-CCD-A: subtract 2.6degC, FC2-CCD-B: subtract
2.6degC, FC2-CH-A: subtract 2.8degC, FC2-CH-B: subtract 2.2degC) so real
temperatures are closer to -67.4C with camera head at -21.7C; deck temperature
is -2.6C with unit off
- all times herein are DSC local time/PDT
15:30 voca check ok
15:44 checked space weather on noaa, sun is quiet, no solar event ongoing
16:02 all systems are go to proceed with FC2 performance test
16:19 light time to s/c is 1min 4sec (= distance of 19.2 Mio km)
16:20 4h life boat sent (ends 19:50 with 30min margin)
16:24 FC2 power on radiated
16:30 camera is on, boot was nominal, CCD at -65.61C, radiator -77.75C, camera
head at -22.4C, thermal control catching up at 36% duty cycle and raising
16:36 FEE is on and HK is ok
16:38 table patch for checksum check received and confirmed
16:39 first image acquisition running on thermal stabilization sequence
(21 times 30sec darks every 3min for total of 1h)
16:41 CCD is at -62.5C, started at -65.6C, will see where it stabilizes camera
head is at -23.39/-24.39C toggling
16:48 thermal control reaches 63% duty cycle at camera head
16:58 note encoder values are #62 for filter wheel (F1), #9/10 for door
(closed)
17:05 CCD is at -57.45C, camera head -22.4C, deck i/f 2.3C
17:19 CCD is at -57.33C stabilized, camera head still coming up at -21.4C,
duty cycle 59%, 14 images acquired; rampage reads -57.4C CCD temp, thus
missing the gradient between CCD carrier/die and cold finger stack
17:41 last image acquired, CCD -56.07, CH -20.4C, radiator -71.7C, I/F 4.2C
17:44 test pattern, storage and serials acquired, running darks..
17:48 camera head is stabilized at -19.4 reading, duty cycle is 43%,
CCD -56.0C
18:02 darks are done, running cal lamp sequence, on and ok
18:23 images acquired, starting playback, darks look fine, test pattern ok
18:54 playback stopped, 49 of the 74 acquired images received, analysing..
19:04 desat ongoing and visible on pointing screen
- action item: request accuracy of ra dec reading from s/c allowing
- 0.1 px resolution analysis to compare image data with
19:09 thermal control reached 21% duty cycle at -20C with FEE up and running,
thus there is room to dive to lower CCD temperatures but throttling down
thermal control, and by lowering deck temp (currently at +6.2C) with unit on,
current CCD reading is -53.8C
19:18 desat completed, awaiting sequence to complete
19:35 storage area images analysed and ok, serial images checked and ok
showing slight increases at 4 frequencies as seen in functional and ground
- test (600Hz, 800Hz, 1.4kHz, 4.2kHz)
19:42 life boat cancelled (radiated)
19:45 go to renew the 4h life boat, radiated (ends 23:15 with 30min margin)
19:50 radiated performance part 2, 41k on LGA reduces HK rate to 1 out of 20
20:23 s/c is still slewing to 20Cephei
20:35 turn completed, awaiting settling..
- action item: how to get s/c roll angle for data analysis
20:50 acquiring darks prior to door opening
20:52 about to open door.. moving.. open, encoder reading is #53
20:55 temp snap shot: CCD -54.28, radiator -70.77, camera head -20.40, baffle
-26.38, rampage CCD -53.6, CH -16.0, I/F 6.6 (all degC)
20:57 first image of 20Cephei acquired
21:10 20Cephei pointing is visible in deck temperature decrease of ~0.2degC
which caused the FC E-box temperature decrease at power converter and DPU
21:25 still imaging thru filter wheel, currently at filter 8
21:28 back in filter 1 for deep exposures (600sec, 2x)
21:31 rampage monitor R-3047 is still monitored and in alarm, to be removed as
requested as no physical hardware behind -> action item to project
21:38 pointing based on quaternions indicate jitter of 1 to 1.5 px in ra and
dec over 10min, should be visible in long exposures if reading is right and
representing physical movements of the s/c
21:40 2nd deep exposure started
21:51 deep exposures finished, total of 97 images acquired at this point in
time, ready for playback
21:57 not receiving VR10 data as expected, potential residual of s/c safe mode
22:20 decided to continue with part3 and downlink VR10 at end of session
22:35 cancelled life boat
22:40 go to renew the 4h life boat, radiated (ends 02:10 with 30min margin)
22:56 radiating contingency product to deal with VR10 downlink routing
23:01 go to proceed with part 3 of performance sequence, and radiated
23:09 slewing to Vega
23:12 sub frame patches executed successfully
23:22 corrupted 1st image from VR10 received, downloading the 2nd
23:33 2 F8s and 600sec F1 received, analysing.., VR10 downlink halted
23:41 Vega imaging sequence started
23:47 pointing jitter is about 0.1 to 0.2px on the typical imaging time scale
of few seconds
23:52 cmd counter at 174, total of 129 images taken so far
23:53 starting slew to corner of field of view
04 Dec 2007
00:05 patching CCD corner sub frames
00:06 imaging corner sub frames while slewing (nicely)
00:14 all images acquired and processed, cmd couner 208, image cnt 145
00:18 patches sent for intermediate sub frames and imaging
00:25 imaging done and processed, cmd counter 242, image cnt 161
00:31 patch done for center sub frame and imaging the 8 (by 2)
00:39 imaging done and processed, cmd counter 270, image cnt 177
00:41 patches sent for intermediate sub frames and imaging
00:51 imaging done and processed, cmd counter 304, image cnt 193
01:05 imaging done on outer frames and processed, cmd counter 338, images 209
01:14 cancelled life boat
01:18 temp snap shot: CCD -53.90, radiator -69.77, camera head -19.40, baffle
-28.38, rampage CCD -53.6, CH -15.4, I/F 9.4 (all degC)
01:21 sequence block 5 radiated to close door, take dark, and shut down FC2
01:26 FC2 door is closed, encoder reads 10, closed. FW is at F1, encoder 62.
01:42 6 darks running
01:48 done, total of 215 images acquired. dark processed and shipped to VR
01:50 slewing back to ICO pointing
02:19 FEE off sent and down
02:24 FCPrepPowerDown, saving lifetime to NVRAM, done.
02:26 camera is off.
02:29 CCD non-op heater is on and running temp up as expected.
02:47 playback continues
03:00 VR10 playback completed, 20 images received on VR10 (as expected)
03:30 VR08 playbakc of initial cal lamp images completed
03:42 VR08 playback of Vega sub frames 256x256 done, saw Vega nicely crossing
field of view pointing/slew to be checked as not following diagonal track
(track rotated) and thus Vesta signature apparently lost in some images
03:45 VR08 final darks down, end of downlink, 215 images saved
Summary:
The Dawn Framing Camera FC2 was turned on for more than 9 hours for
performance checkout. It acquired 215 images, 17845 hk frames, and 18595
events. All radiated sequences ran nominally, the instrument worked fine.
Onboard image transfer checksum check was turned on for this test (FEE to
DPU). All images were confirmed Ok in o/b transmission. All images were
acquired as full frames; 112 of these were cropped onboard by the DPU to
256x256 size and transmitted as windows (sub frames).
The housekeeping monitor reported no alarms, all HK stayed well in limits.
There was an issue with VR10 playback which could be a residual of s/c safe
mode recovery (tbc).
The CCD reached steady state at -53C with camera head at -20C and deck at
+9.7C, deck still slighly increasing temp. There is good potential to get CCD
further down by decrease of camera head and deck temperatures. Thermal
analysis by OSC should get initiated.
All FC subsystems were behaving fine as of functional checkout. Thermal and
optical performance is excellent. Image data analysis is ongoing, hope we'll
be able provide first quicklook results in time to Tuesday's 14:00 debrief.
A few actions/requests for clarifications were identified. The project should
tune the CCD and Camera Head non-op readings as they are off by a few
degrees.
Congratulations to the Dawn team at JPL, DSC, and home at MPS. This was a
smooth test:-) ..and this is exciting.
H Sierks for the FC Team, 4 Dec 2007
attachments:
- this report of activity
- fft analysis of serial images
- first clear filter 20Cephei image b/w and inverted
- star catalogue FC FoV pointing 20Cephei
to come in time to debrief (tbc):
- image index file
- housekeeping data plots
- 20Cephei analysis
- Vega plot 256x256 and perhaps first spectrum
- slew assembly of Vega mosaics


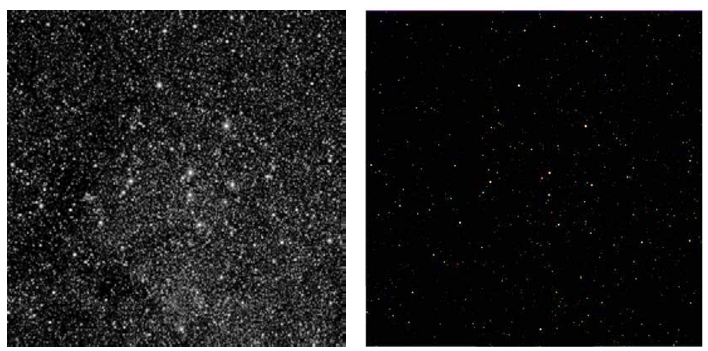
Analysis of the Vega-slew images
An analysis of the 32 (4 in each filter) 256x256 pixel images during the slew
over Vega lead to the following results:
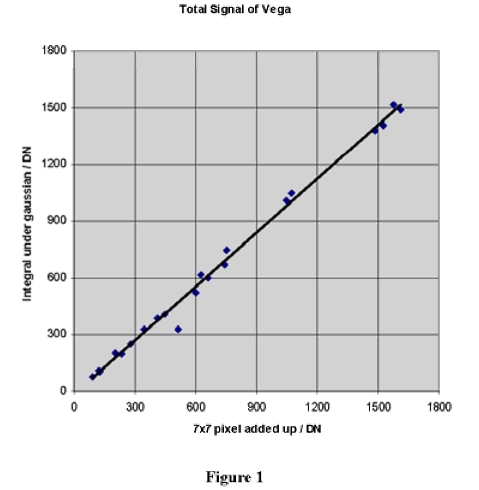
Figure 1 shows how well a Gauss-fit matches a simple adding of the DNs of the
affected pixels.
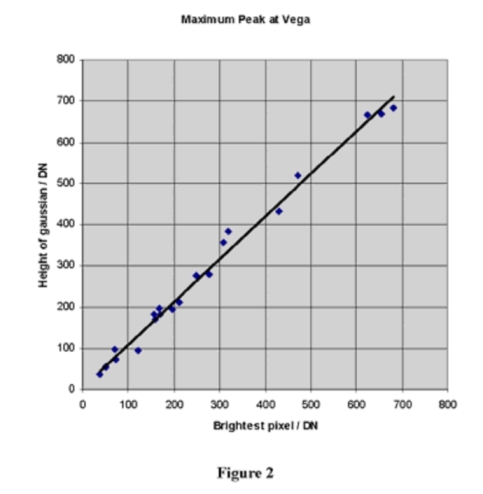
Figure 2 compares the value of the brightest pixel with the height of the
fitted Gaussian.
Conclusions: The differences between the two appraches are not very big (in
the cases where the Gauss-fit converges to the correct solutions).
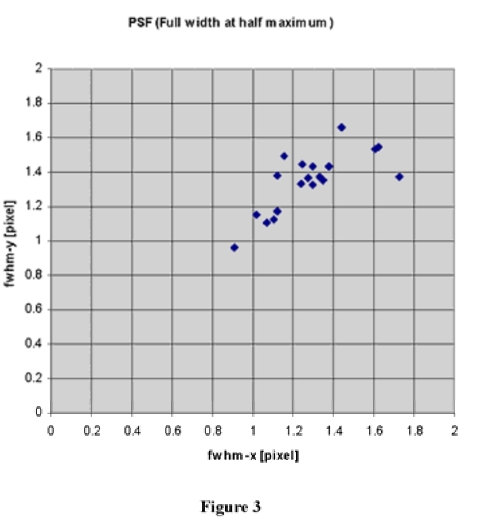
In Figure 3 the PSF for the images during the slew is plotted.
The average is 1.36 pixel full width at half maximum in x-direction and 1.41
pixel in y-direction. The slew didn't seem to have an effect in widening the
PSF.
This is a preliminary summary of housekeeping data from the Dawn FC2
Performance Test on 04 Dec 2007, part of the Dawn instruments checkout. The
data used in this summary were logged at the MPS server VestaXP during real
time transmissions from the Dawn S/C. The data were monitored during the
entire test also at FC EGSE at MPS as well as at the DSC.
The h/k data covered are FC instrument temperatures ands FC instrument voltage
and current variations. MPS technical notes DA-FC-MPAE-TN-033,-035 are
references for the h/k parameters.
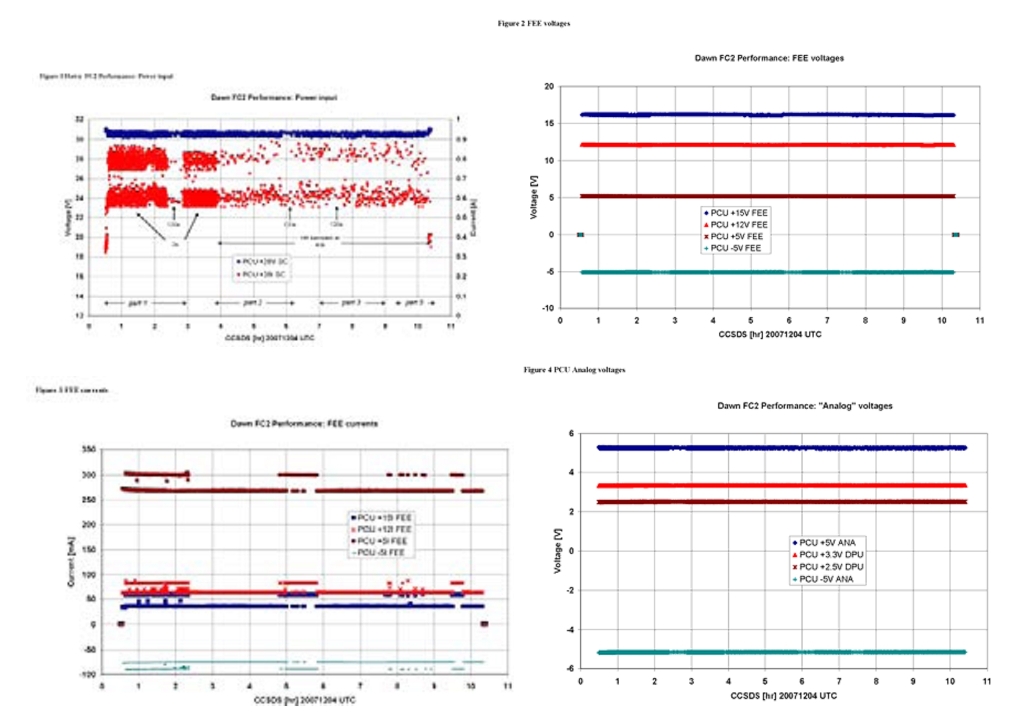
The power from S/C to FC2 is shown in Figure 1. Test phases and h/k sample
interval are indicated on the graphs of voltage and current. There is a clear
tendency of under sampled data to underestimate variability of current
variations. The lower current at beginning and end are due to FEE being off.
FEE voltages and currents are shown in Figure 2 and Figure 3, respectively.
They are nominal. Here the variability is due to different modes of FEE
operation, but a closer study would be required to correlate the mode as
indicated by the currents with the imaging mode.
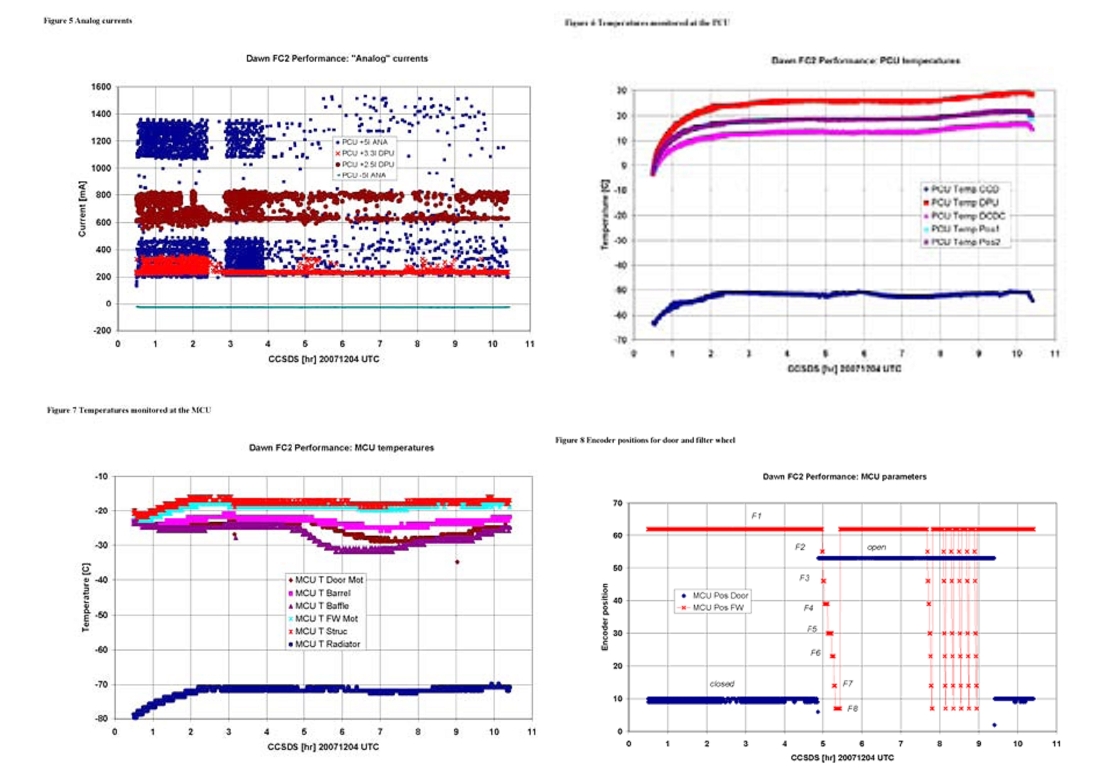
Other internal power lines from the PCU to DPU and MCU are termed analog.
These are graphed in Figure 4 Figure 5. Again the voltages are stable and the
currents nominal. The same tendency to underestimate variability of the 5V
supply current is apparent here as in Figure 1.
Temperatures are monitored through electronics in the PCU and MCU. These are
shown separately in Figure 6 and Figure 7. Comparisons with non-op
temperatures are possible for PCU Temp CCD and MCU T STRUCT h/k parameters.
Spot checks with FC Mixed Display from dawnrampage indicate the non-op
temperature at the CCD is approximately 2C colder than the PCU Temp CCD, and
the non-op temperature at the camera head 1-2C warmer than the MCU T STRUCT.
The last parameters to be summarised here are the angle encoder values for the
door and filter wheel in Figure 8. The regularity of filter wheel operations
during parts 2 and 3 can be seen. Note that the encoder value for the door
goes through zero in transitioning between closed (value 10) and open (value
53).
9.7 FC2 Calibration test report
Dawn FC2 ICO Calibration Block Report; DSC/UCLA
13 Dec 2007 (M Aye, S Schroeder, H Sierks, S Mottola at DSC; M Richards,
T Maue, P Gutierrez at MPS)
- ccd temperature was found in steady state with rampage readings of
    -64.8C and camera head at -18.9C at ~50% duty cycle; pt2000 final calibration
    tunes not applied yet; real temperatures are CCD -67.4C, camera head -21.7C;
    deck temperature is reading -3.9/-4.1C with unit off
- all times herein are DSC local time/PDT
11:38 voca check ok
11:41 light time to s/c is 2min 45sec round trip (eq. 24.6 Mkm)
11:48 checked space weather on noaa, sun is quiet
12:02 data flowing, temp reading snap shot: FC2 CCD -65.8, CH -18.3,
i/f -3.9/4.0, all C; duty cycle at CH is ~50%
12:05 all stations are go to proceed with FC2 calibration test
12:11 all stations are go to radiate FC2 calibration sequence
12:12 FC2 calibration sequence radiated
12:16 radiation complete
12:21 camera is on, booting was nominal, unit hk temp CCD -66.06,
radiator -78.75, camera head -23.39, baffle -29.38, PCU CSC -4.0 (closest to
s/c i/f), all C
12:25 UDP upload successful
12:26 FEE is on, HK checked and ok, we are on 8sec hk rate
12:31 first image acquired
12:43 egse reports packet losses, most likely related to antenna switch over
12:53 turn to 51Peg started
12:54 imaging of 19 basics ongoing, including 10 serials..
13:15 CCD checkout sequence started
13:29 taking pre op darks
13:32 opening door, door open at enc reading 53, ok
13:38 center frame patch successful
13:39 settling is complete, oscillations is +-0.5px after 20min settling,
period is approx. 800sec peak to peak
13:40 filter F1 done, turned to filter F2, ok
13:43 turned to filter F3, ok
13:47 turned to filter F4, ok
13:54 turned to filter F5, ok
13:58 turned to filter F6, ok
14:02 turned to filter F7, ok
14:04 turned to filter F8, ok
14:05 temp snap shot: CCD -54.69, rad -71.77, ch -19.40, baffle -32.37
i/f 4.2, rampage ccd -54.1, rampage ch -14.8, all C
14:14 filter is back at F1/62
14:16 slew to 42Peg started
14:23 slew complete, start settling
14:25 p/b started, first images streaming down
14:34 playback stopped, total of 7 images received
14:35 imaging 42Peg
14:46 done, back in filter F1
14:49 slewing to Saturn
15:24 slew complete, start settling
15:30 playback started
15:32 looks like packet loss in image #8 (1st serial received)
15:33 next 4 serials look ok, no stripes nor noise pattern
15:42 all 10 serials are down, first dark received
15:48 playback finished for now, all 6 darks received, total of 23 images down
15:49 imaging Saturn:-)
16:20 slew to NGC3532 upper left starting
16:39 slew complete, start settling
16:43 start of playback
16:44 first image exhibits packet loss again
17:01 pb finished, got 15 images of ccd test sequence down, imaging upper left
17:09 first mini slew complete, turn to upper middle
17:11 pb started, first image is ok, no packet loss
17:20 pb finished, taking images in upper middle
17:22 slew to upper right started
17:23 slew complete
17:25 start pb
17:33 pb stopped, total of 51 images down
17:34 back to rt, imaging upper right
17:40 slew to mid right started
17:44 slew finished, pb started while settling
17:48 getting 52Pegs down, image is not centered, looks like 52Peg is approx.
34 by 11px offset
17:51 pb stopped, total 119 images down, imaging mid right
17:56 Saturn has x:34, y:11 px offset, looks like offset is due to overscan
area not corrected for
17:57 imaging finished, slew to mid center
17:58 slew complete
18:00 pb cont'd, Saturn is nice:-), first NGC full frame coming, cool
18:07 pb stopped, imaging mid center in all filters, pointing is +-0.2px
19:17 slew to mid left started, center frame of mosaic done in all filters
19:18 slew complete, expecting data
19:20 pb starts, getting data
19:31 pb finished, total of 161 images are down, imaging mid left now
19:37 slew to lower left
19:39 start of pb
19:47 pb finished, got 7 images, imaging lower left mosaic, done
19:53 slew to lower center
19:57 start of pb
20:01 pb finished, imaging lower center, done
20:08 slew number 9 in progress
20:09 slew complete to lower right, start pb
20:17 pb finished, imaging lower right
20:23 back in clear, done, encoder reads 62, F1.
20:24 closing door, ok, encoder reads 9/10, closed.
20:25 temp snap: ccd -53.87, ch -20.40, radiator -69.77, baffle -30.37;
rampage reading ccd -53.6, ch -16.0, i/f fc2 8.6, i/f fc1 4.3, all C
20:27 taking darks
20:49 slewing back to ICO pointing
21:25 slew back to Earth is complete
21:31 back on HGA
21:51 playing back data
22:29 last packet of last image is missing
22:35 FEE is off
22:40 PrepPowerDown finished, NVRAM written (life time table)
22:42 FC2 is off, end of test
22:45 last packet received, all images down.
22:48 CCD non-op heater is on and running CCD temp up as expected.
23:25 CCD is at 19.6C, camera head -18.3C, s/c i/f 1.5C
Summary:
The Dawn Framing Camera FC2 was turned on for more than 10 hours for in-flight
calibration. It received 302 cmds, acquired 254! images, created 18605 hk
frames, and 19272 events. All radiated sequences ran nominally, the instrument
worked just fine.
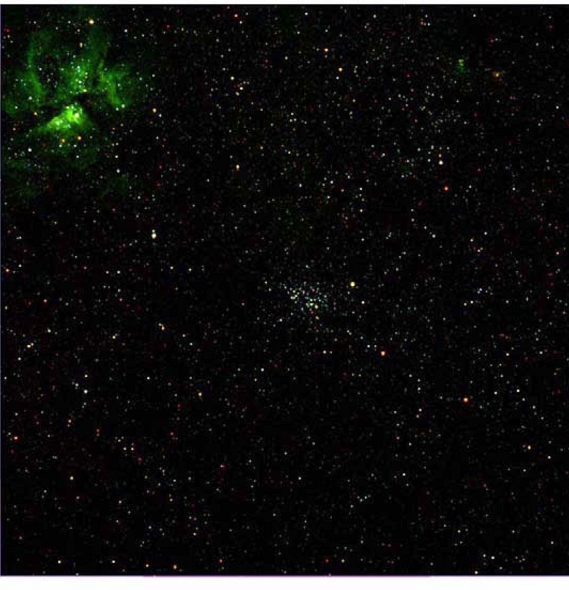
Calibration images were taken of 51Peg, 42Peg, Saturn, and NGC3532 (as 3x3
mosaic) providing a reference data set for scientific analysis. A pointing
offset was noted in all targetted observations indicating that e.g. CCD
prescan area was not correctly taken into account. This issue should be
followed up by the teams.
Analysis of cal lamp images revealed no residual charge at the CCD at cal lamp
photon flux, see attachment. The cal lamp images were taken in engineering
mode allowing analysis of averscan pixels.
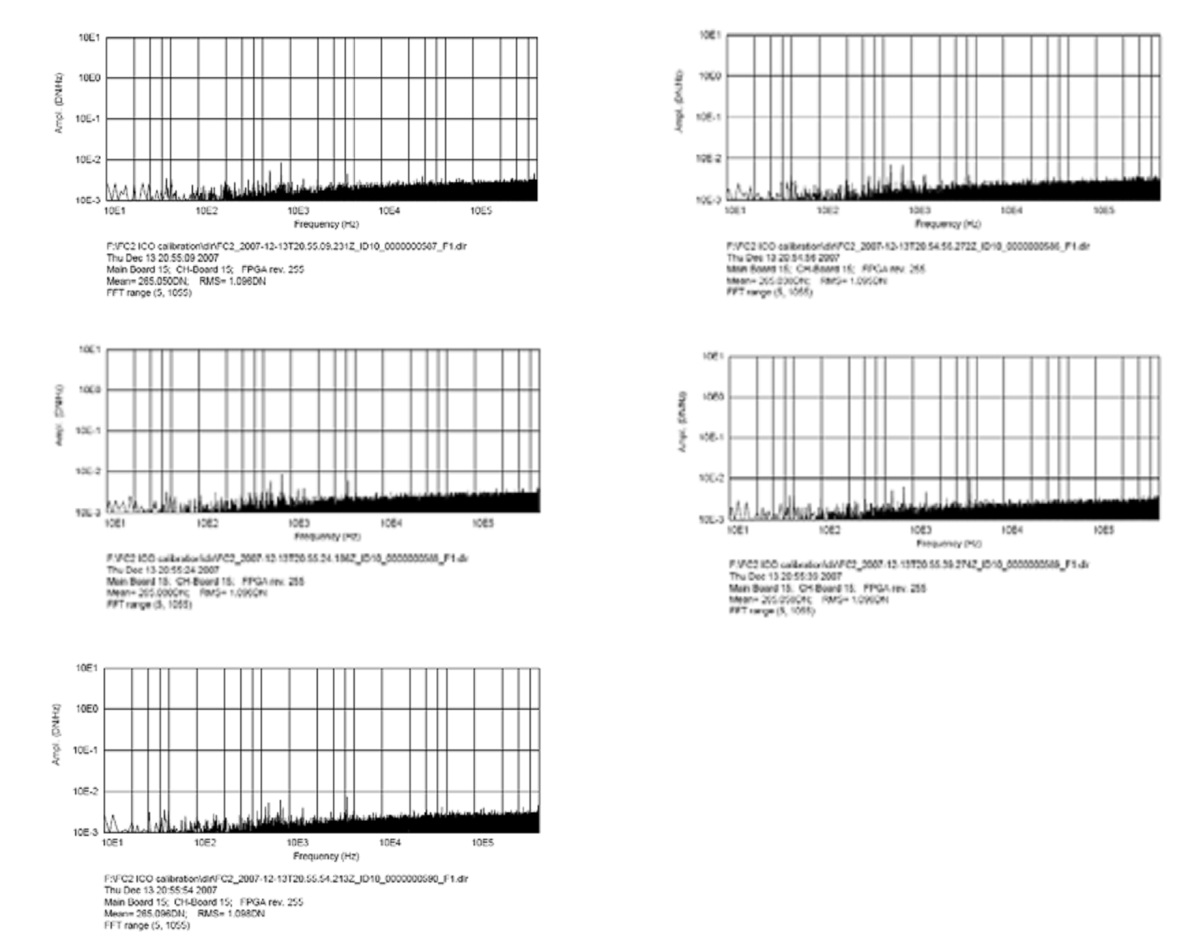
Serial images were taken to characterize the noise floor at the CCD. The
images did not exhibit patterns nor visible structures in the line scans,
although all frequencies (5, 45, 50,55Hz) are visible in fft at somewhat lower
intensities.
Quicklook check of open door images (total of 96 sub frames plus 98 full frame
images) showed no indication of streaks in this run. However, the fields were
crowded making faint streaks not easy to detect.
Congratulations again to the great Dawn team at JPL, DSC, and home at MPS.
This was the 5th exciting run of a framing camera in flight, the 3rd for FC2.
We got a rich data set for both cameras to keep us busy throughout the
winter:-)
We got confidence in FC2 operation in flight that allows off pass or 2k (no FC
hk) operation from now on. We'd like, however, run a 3rd campaign on FC1 with
at least partial hk coverage before clearing FC1 for 2k or out of pass
operation. Thanks again to all who made the 70m antenna available, enabling
this successful test.
H Sierks for the FC Team, 13 Dec 2007
attachments:
- fft analysis of serial images
- residual charge histogram of cal lamp images
- psf analysis of Saturn in all filters
- nice image of Saturn
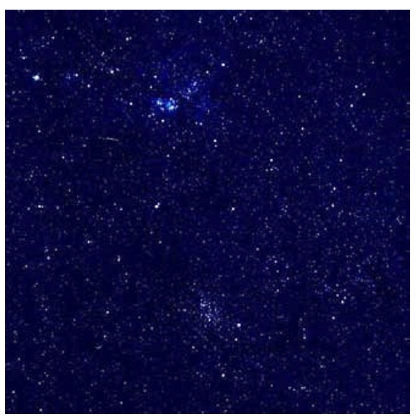
- false color of NGC3532 with Eta Carinae
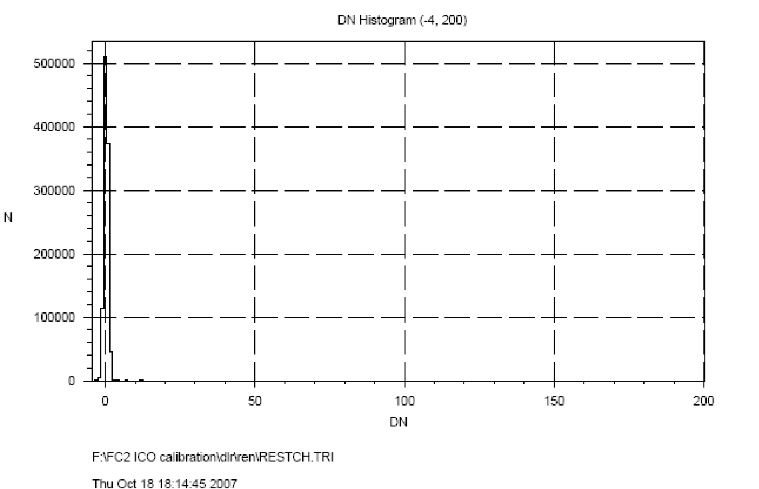
PSF analysis on Saturn
Observing Saturn with the Framing Camera provided a strong signal, suitable
for PSF-analysis of FC2. Saturn was also the first solar system object to be
observed and could tell if the apparent diameter of Saturn is large enough to
be seen in an increased PSF.
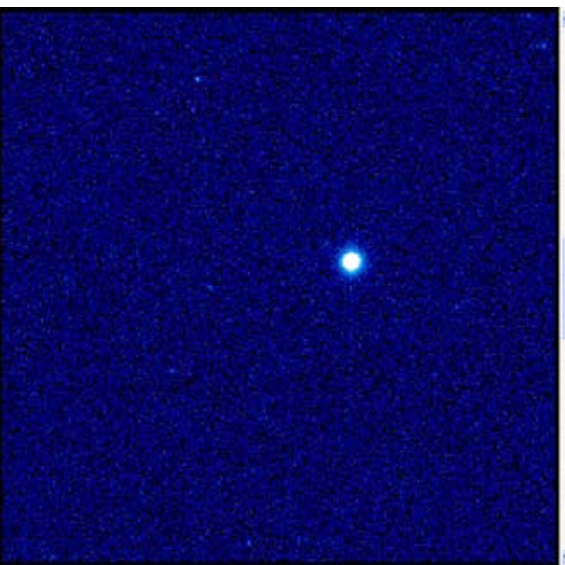
Figure 1 shows the Saturn in a 256x256 pixel window taken with 680 ms exposure
through the clear filter (F1).
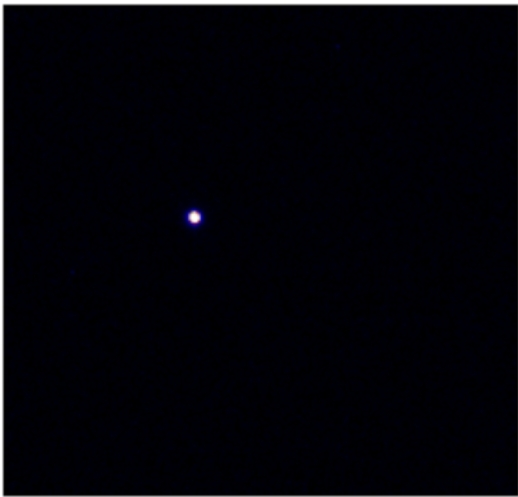
Figure 1: Saturn through Filter 1 (false colour)
The PSF was determined with the shorter of the two exposure times in each
filter, where the peak-signal was between 2000 and 4000 DN.
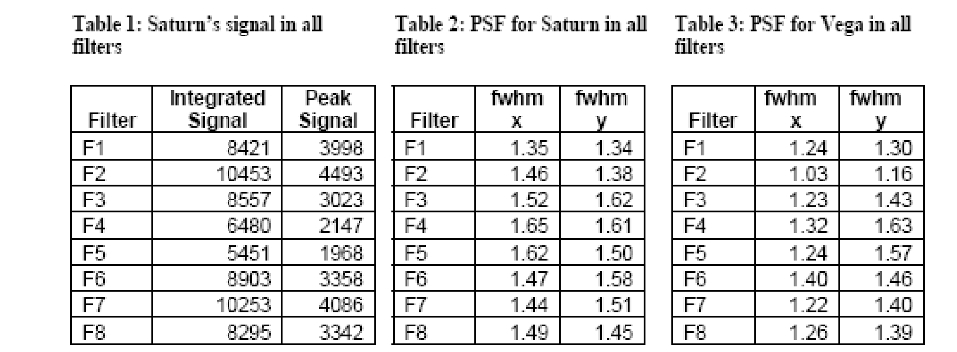
The PSF shows about the same values in y-direction as for stars previously
observed. In x-direction PSF is slightly increased, indicting that Saturn has
an apparent diameter of around 1/35 pixel on the CCD.
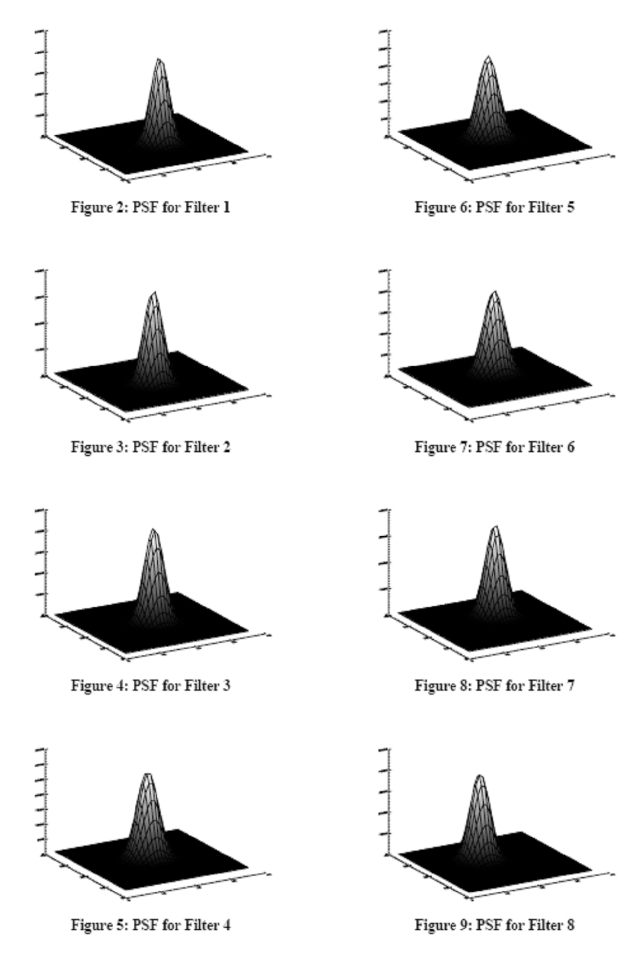
In the following figures the 2D-PSF is displayed for all the eight filters.
