Note: Printed copies of this document may not be relied upon for official purposes. The current version is in the Product Data Management System.
Document Author: Carol A. Raymond
Document Custodian: Carol A. Raymond
NATIONAL AERONAUTICS and
SPACE ADMINISTRATION
JET PROPULSION LABORATORY
California Institute of Technology
Pasadena, California
JPL D-31827
DAWN-21-4137
Prepared by:
_________________________________________________________
Carol A. Raymond, Dawn Deputy Principal Investigator, Jet Propulsion Laboratory
Approved by:
_________________________________________________________
M. Rayman
Mission Operations Manager
Jet Propulsion Laboratory
NATIONAL AERONAUTICS and
SPACE ADMINISTRATION
JET PROPULSION LABORATORY
California Institute of Technology
Pasadena, California
===================================================================================
CHANGE       CHANGE DATE       PAGES      CHANGES/NOTES     GENERAL COMMENTS
NUMBER                         AFFECTED
===================================================================================
 -           20 June 2005       All       Initial draft

 -           30 June 2005       All       Preliminary       Reviewed by team

              3  May 2007       All       Initial Release   Updated to reflect
                                                            current pre-launch
                                                            mission profile and
                                                            firm plans for Initial
                                                            Checkout Phase

MCR-113429   12 October 2012   10 - end   Vesta Release     Updated to reflect the
                                                            current Vesta mission
                                                            profile and plans for
                                                            the Vesta approach and
                                                            orbital phases.

 -           26 March 2013      17-18,    PDS Vesta         Corrected errors
                                28-29     Peer Review       Vesta peere review.
                                                            reported in the PDS
                                                            Vesta peer review.

             18 October 2013              PDS Vesta         Additional corrections
                                          Peer Review       from the PDS Vesta peer
                                                            review.

             16 December 2013             PDS Vesta         Typo corrections.
                                          Peer Review
=====================================================================================
2. Dawn Mission Plan, JPL D-25861, Revision C, Version 2.2, Sept 25, 2008.
3. Dawn Science Data Management Plan, JPL D-25901
4. Dawn Operations Concept JPL D-25868
5. Dawn Science Time-Ordered Listing Software Interface Specification
6. J.-Y Li, J. Crepp, , G. Serabyn, L.A. McFadden, J. Williams, and C. Crow, Search For Satellites Around Asteroids With Coronagraphic High-contrast Imaging On Adaptive Optics, American Astronomical Society, DPS meeting #42, #39.30 (2010)
7. J.-Y Li, P.C. Thomas, B. Carcich, M.J. Mutchler, L.A. McFadden, C.T. Russell, S.S. Weinstein-Weiss, M.D. Rayman, C.A. Raymond, Improved measurement of Asteroid (4) Vesta�s rotational axis orientation. Icarus, 211, 528-534 (2011)
8. J.-Y Li, Vesta lighting conditions, personal communication, April 15, 2011.
9. L.A. McFadden, Bastien, F.A., Crow, C.A., Hamilton, D.P., Li, J., Mutchler, M.J., Search for Satellites of Vesta: Upper Limits on Size, American Astronomical Society, DPS meeting #41, #53.06 (2009)
10. C.A. Polanskey, S.P. Joy, C.A. Raymond, Dawn Science Planning, Operations and Archiving, Space Sci. Rev. (2011), Volume 163, Issue 1-4, pp. 511-543.
11. C.A. Raymond, R. Jaumann, A. Nathues, H.Sierks, T. Roatsch, F. Preusker, F. Scholten, R. W. Gaskell, L. Jorda, H-U. Keller, M. T. Zuber, D. E. Smith, N. Mastrodemos, S. Mottola. The Dawn Topography Investigation. Space Sci. Rev. Rev. (2011), Volume 163, Issue 1-4, pp. 487-510.
12. P.C. Thomas, R.P. Binzel, M.J. Gaffey, B.H. Zellner, A.D. Storrs, E. Wells, Vesta: Spin Pole, Size, and Shape from HST Images. Icarus 128, 88-94 (1997)
ACN       Ahead-Cross-Nadir pointing mode

ATLO      Assembly,Test and Launch Operations

DRAM      Dynamic Random Access Memory

DSC       Dawn Science Center

DSMS      Deep Space Mission System, provided by IND

DSN       Deep Space Network

DVD       Digital Versatile Disc

EDA       End of Data Acquisition

EDR       Experiment Data Record

EOM       End of Mission

FC        Framing Camera

EOO       End of Operations

GB        Gigabyte(s)

Gb        Gigabit(s)

GDS       Ground Data System

GRaND     Gamma Ray and Neutron Detector

GRV       Gravity Science

HAMO-1    First High Altitude Mapping Orbit

HAMO-2    Second High Altitude Mapping Orbit

IND       Interplanetary Network Directory

ITAR      International Traffic in Arms Regulations

JPL       Jet Propulsion Laboratory

LAMO      Low Altitude Mapping Orbit

MDN       Mission Design and Navigation

MCA       Mars Closest Approach

MGA       Mars Gravity Assist

MOS       Mission Operations System

NAIF      Navigation and Ancillary Information Facility
          (services provided under IND)

NASA      National Aeronautics and Space Administration

NAV       Navigation

OIA       Operational Interface Agreement

OpNav     Optical Navigation

PDS       Planetary Data System (of NASA)

PI        Principal Investigator

SCItol    Science Time Ordered Listing

SOA       Science Opportunity Analyzer

SPC       Stereo Photoclinometry

SPICE     Spacecraft,Planet, Instrument, C-matrix, Events

TOL       Time-Ordered Listing

UCLA      University of California, Los Angeles

VIR       Visible and InfraRed spectrometer

VR        Virtual Recorder
SIGNATURE PAGE ........................................................... ii
CHANGE LOG ............................................................... iii
REFERENCE DOCUMENTS ...................................................... iv
ACRONYMS ................................................................. v
LIST OF TABLES AND FIGURES ............................................... vii
1. Introduction....................................................... 1
2. Overview of the Dawn Mission....................................... 1
2.1 Mission Overview................................................ 1
3. Dawn Mission Science Objectives and Data Collection ............... 4
3.1 Overview......................................................... 4
3.2 Dawn Science Objectives.......................................... 4
3.3 Level-1 Science Objectives....................................... 5
3.3.1 Baseline Mission Success Criteria............................. 6
3.3.2 Minimum Mission Success Criteria.............................. 7
4. Science Activities by Mission Phase................................ 7
4.1 Initial Checkout Phase........................................... 7
4.2 Cruise Phase Calibrations........................................ 9
4.3 Mars Gravity Assist.............................................. 10
4.4 Vesta Science Overview........................................... 13
4.4.1 Vesta Approach................................................ 15
4.4.2 Survey Orbit.................................................. 21
4.4.3 Transfer to the High Altitude Mapping Orbit 1................. 27
4.4.4 High Altitude Mapping Orbit 1................................. 28
4.4.5 Transfer to the Low Altitude Mapping Orbit.................... 34
4.4.6 Low Altitude Mapping Orbit.................................... 34
4.4.7 Transfer to High Altitude Mapping Orbit 2..................... 40
4.4.8 High Altitude Mapping Orbit 2................................. 41
4.5 Vesta Departure Overview......................................... 44
4.6 Ceres Science Overview........................................... 44
4.6.1 Ceres Approach................................................ 44
4.6.2 Survey Orbit.................................................. 44
4.6.3 High Altitude Mapping Orbit................................... 44
4.6.4 Low Altitude Mapping Orbit.................................... 44
4.6.5 Orbit Transfers................................................ 44
5. Science Descope Plan............................................... 44
5.1 Priority Scheme by Objectives/Level-1 Requirement (highest to lowest). 45
5.2 Tiered Priority Scheme.......................................... 45
5.3 Descope Plan for Mission Replan................................. 46
6. Science Time-Ordered Listing Spreadsheet Description............... 47
Figure 2-1. Dawn Mission Timeline
Figure 4-1. Initial Checkout and Early Cruise Phase Timelines
Figure 4-2. Cruise Phase Calibration Timeline
Figure 4-3. Mars Gravity Assist Timeline
Figure 4-4. Vesta mapping phases overview
Figure 4-5. Vesta lighting conditions for baseline trajectory and Li pole location
Figure 4-6. Vesta Near Approach Geometry
Figure 4-7. Rotational Characterization #3
Figure 4-8. Summary of previous Vesta satellite search results
Figure 4-9. Vesta satellite search mosaic
Figure 4-10. Vesta Survey Timeline Overview
Figure 4-11. VIR pushbroom observations in Survey orbits 1 and 3
Figure 4-12. VIR cubes in Survey orbits C2, C4, C5, and C6
Figure 4-13. FC 1x3 mosaics in the Survey orbits
Figure 4-14. Expected FC global coverage versus phase angle during Survey
Figure 4-15. Ground track and FC images during four Vesta HAMO orbits
Figure 4-16. HAMO Mapping strategy schematic.
Figure 4-17. Diogenite and Eucrite spectra resampled to the FC filters.
Figure 4-18. A selection of planned VIR HAMO observations.
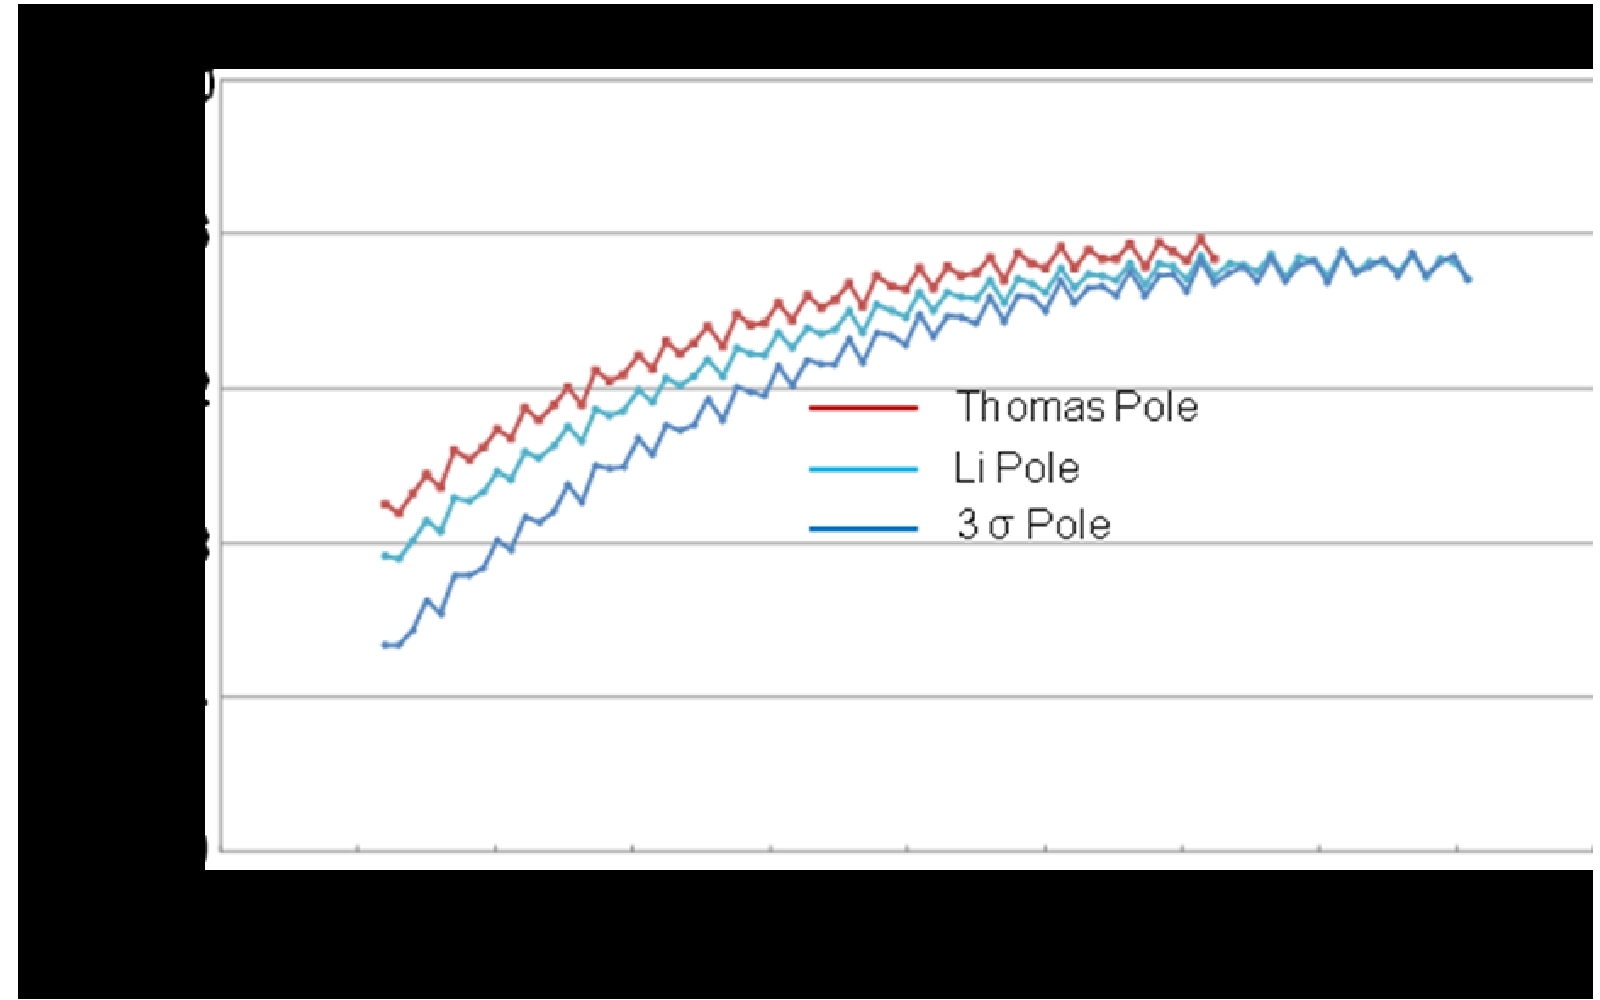
Figure 4-19. HAMO occultation durations vs. time for various pole locations.
Figure 4-20. Transfer to LAMO bonus science schematic.
Figure 4-21. Vesta LAMO 70-day timeline.
Figure 4-22. Vesta LAMO repeating 1-week timelines.
Figure 4-23. Vesta LAMO downlink pass and gravity tracking.
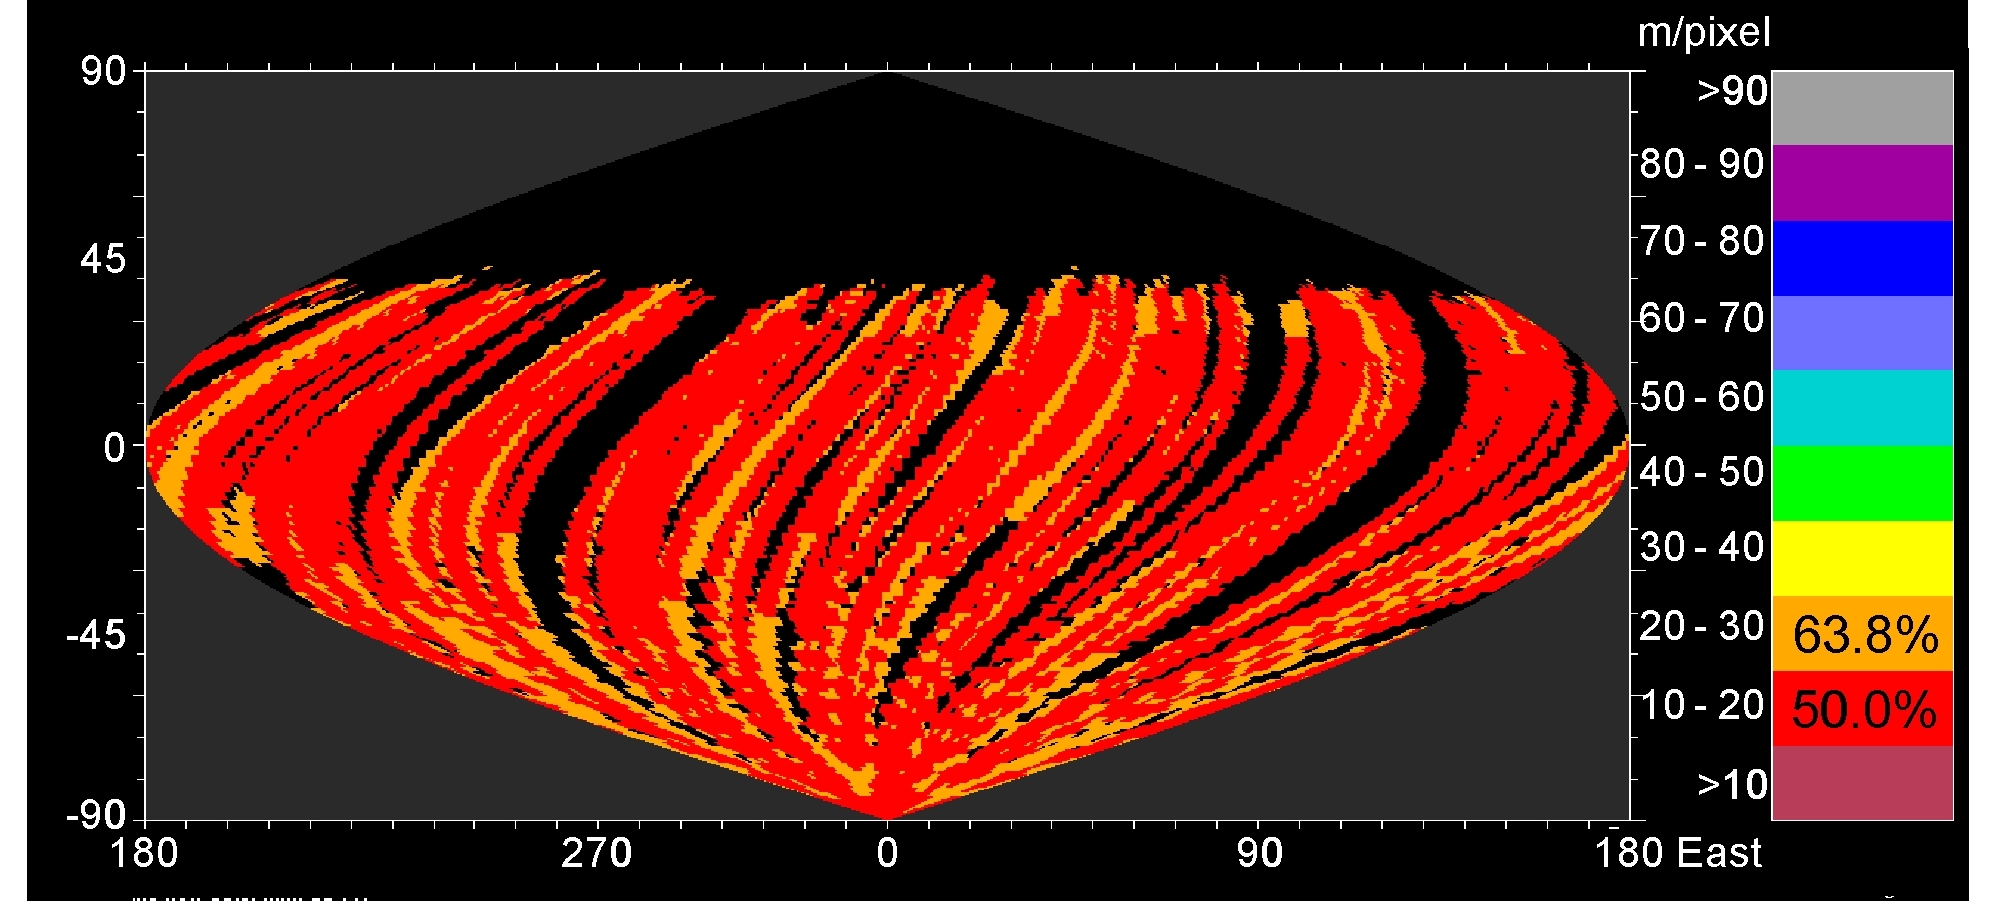
Figure 4-24. Vesta LAMO clear filter image coverage (incidence < 80°).
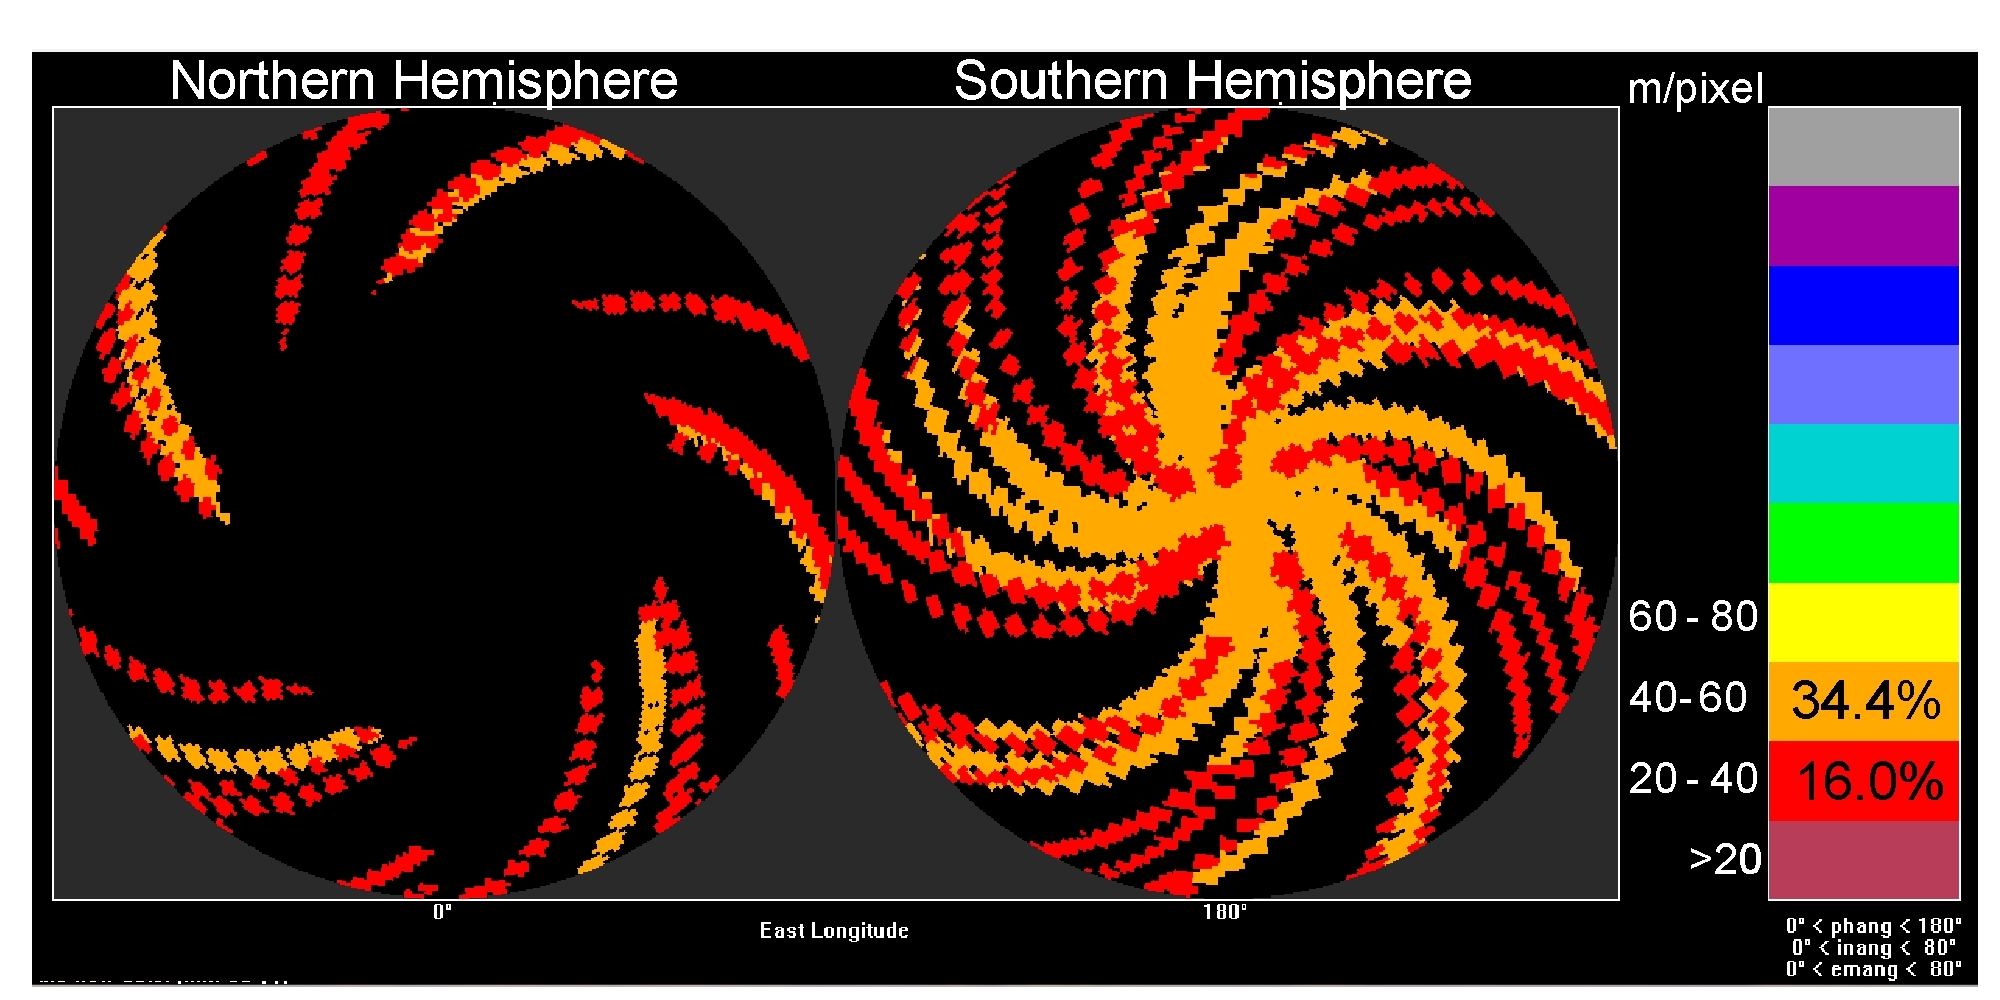
Figure 4-25. Vesta LAMO color filter (F2,F3,F4) image coverage (incidence < 80°).
Figure 4-27. Overview of VIR coverage during LAMO
Figure 4-28. HAMO-2 timeline overview
Figure 4-29. Combined HAMO and HAMO-2 Stereo coverage
Table 4-1. Initial Checkout Phase Instrument Activities
Table 4-2. Cruise Phase Instrument Checkout and Calibration Activities
Table 4-3. Mars Gravity Assist Science Activity Timeline
Table 4-4. Mars Gravity Assist Mission Phase Activity Timeline.
Table 4-5. Vesta Orbit Sub-phase Parameters.
Table 4-6. Dawn Approach Observations.
Table 4-7. Dawn Approach Observation Pointing Errors.
Table 4-8. HAMO Pointing and Objectives for Each Cycle.
Table 4-9. Vesta LAMO Data Downlink Allocations.
Table 4-10. Ceres Orbit Sub-phases.
Table 5-1. Science Descope Plan for Mission Re-plan.
This document describes the plans for acquiring Dawn science data on the way to, and in orbit about, the two protoplanets 4 Vesta and 1 Ceres, that will be visited by the Dawn spacecraft. It represents the high level plan for Dawn mission science operations. The initial version of the plan was delivered during the Assembly, Test, and Launch Operations (ATLO) phase, four months before launch, and provided the template for ATLO testing of operations interfaces and procedures. The initial version of the Science Plan was consistent with Revision B of the Mission Plan (D-25861), released in June of 2007. An update to the Science Plan is developed prior to arrival at each body. The Vesta Release of the Science Plan documents the state of the Vesta science observation plan and mission design as they were understood on May 1, 2011 prior to the execution of the first Vesta Approach observations. This version also provides an as-flown update to the launch and cruise instrument activities that have been completed. The Ceres information in the Vesta Release has not been updated since launch. Formal Ceres science planning will begin after departure from Vesta. The Ceres Release of the Science Plan will provide as-flown updates to the Vesta plan in addition to details of the Ceres design. The Science Plan flows down into a set of Instrument Sequence Plans that are delivered in the form of spacecraft sequences during execution of the Integrated Sequence Build process prior to formal spacecraft sequence development.
The Science Plan defines the activities to be undertaken by each instrument in a time-ordered framework, and identifies available resources and resource adaptation guidelines, including data downlink to the ground. Resources include time (which includes positioning and attitude), data transfer, data storage in the spacecraft Dynamic Random Access Memory subsystem (DRAM), and data bandwidth to the ground. A companion document, the Science Data Management Plan (D-25901), details the generation, validation, and transfer of the data archive to the Planetary Data System (PDS). Data handling on the ground is not covered in this document.
Section 2 gives an overview of the Dawn mission and the resources that are available. Section 3 provides an overview of science objectives and requirements. Section 4 presents details of the science data collection by mission phase and sub-phase, within the framework of the Level-1 science objectives. Section 5 discusses modifications to the plan due to contingencies of descoping to the minimum mission, increasing the time of the encounters, and responding to unexpected safing events and anomalies. Section 6 provides a description of the Science Time-Ordered Listing (SCItol) spreadsheet that defines instrument activities for each mission sub-phase.
The Dawn mission�s overall scientific goal is to achieve an understanding of the conditions and processes acting at the solar system's earliest epoch. It achieves this by flying to and orbiting the main belt asteroids (protoplanets) Ceres and Vesta, orbiting Vesta for a period of not less than seven months and Ceres for not less than five months. At least 1.5 months at Vesta will be below a mean altitude of 200 km, and at least one month at Ceres will be below a mean altitude of 700 km.
The launch period for Dawn opened on 26 September 2007 and the spacecraft successfully launched on September 27, 2007 11:34:00.372 UTC. Dawn consists of an ion-propelled spacecraft capable of visiting multiple targets in the Main Asteroid Belt. In the baseline mission, Dawn arrives at Vesta in July 2011, leaves Vesta mid-2012, and arrives at Ceres early in 2015, where it will remain for 5 months until the end of the baseline mission. The spacecraft flew by Mars in February 2009 enroute to Vesta.
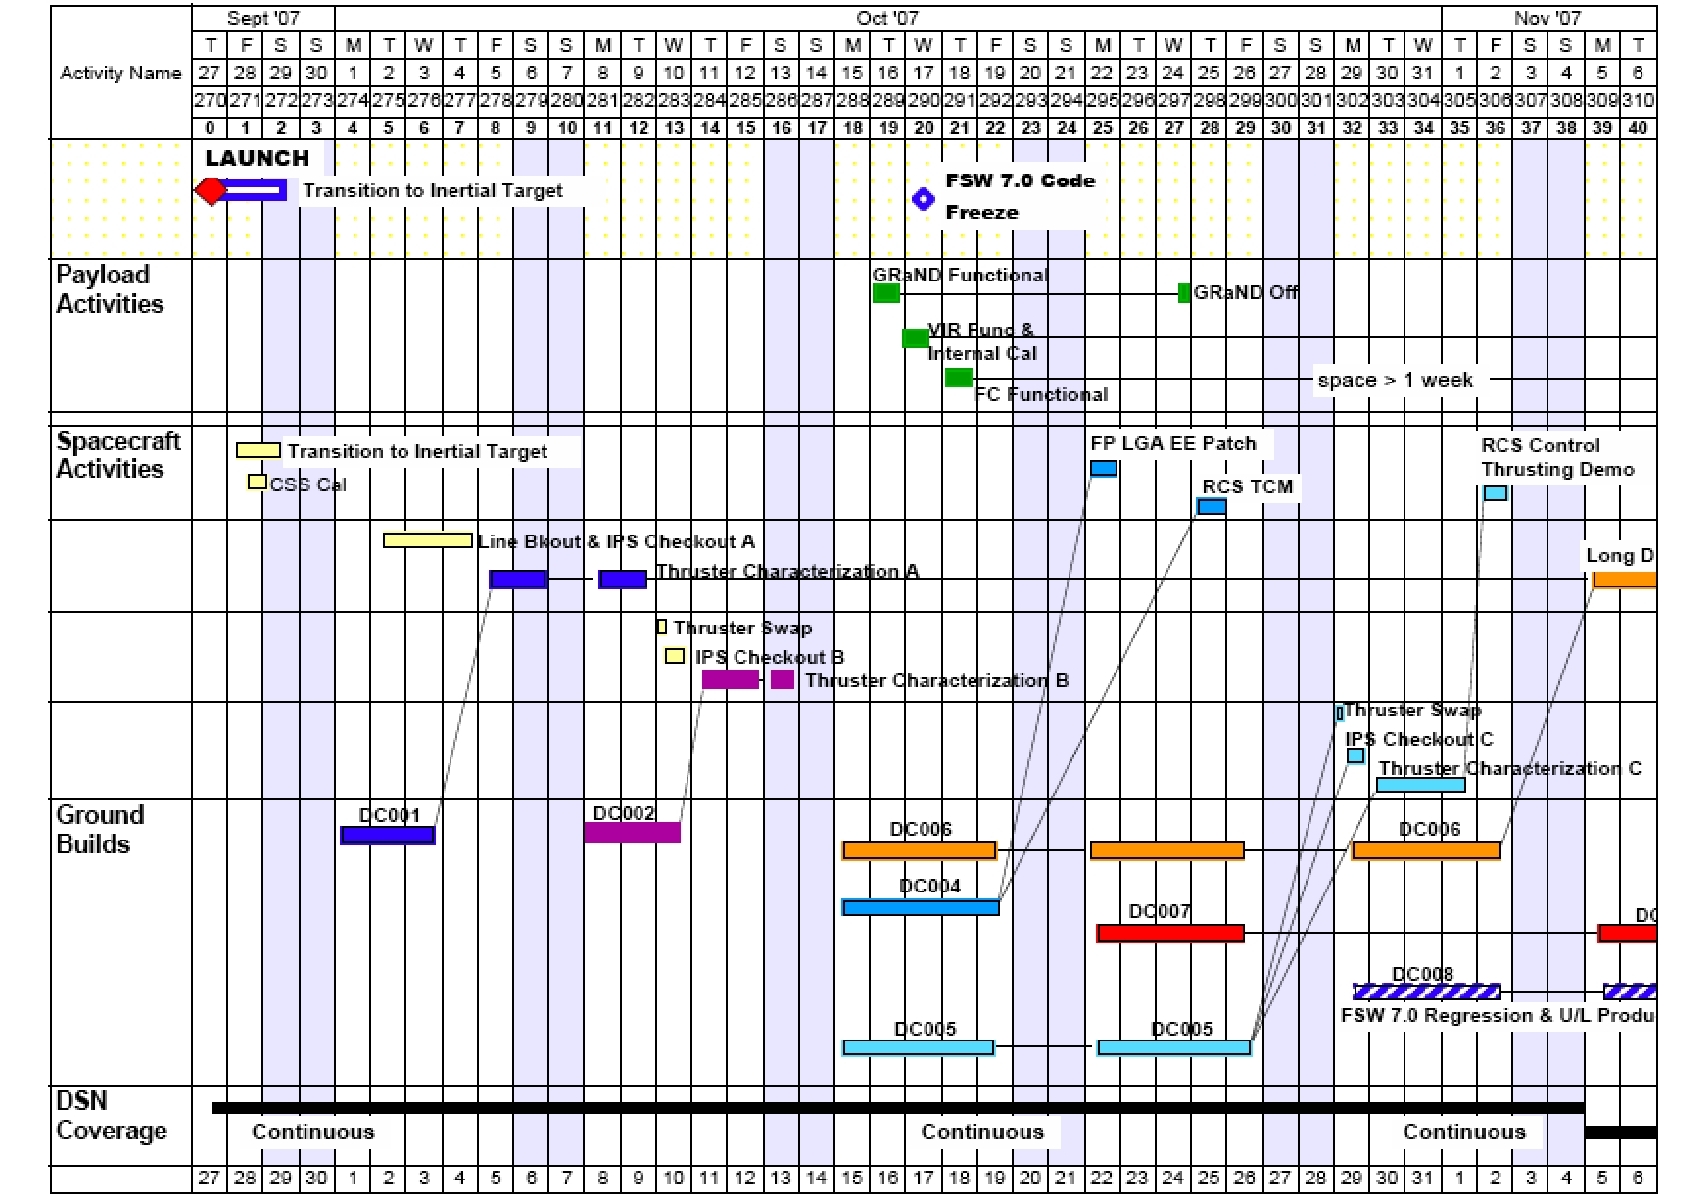
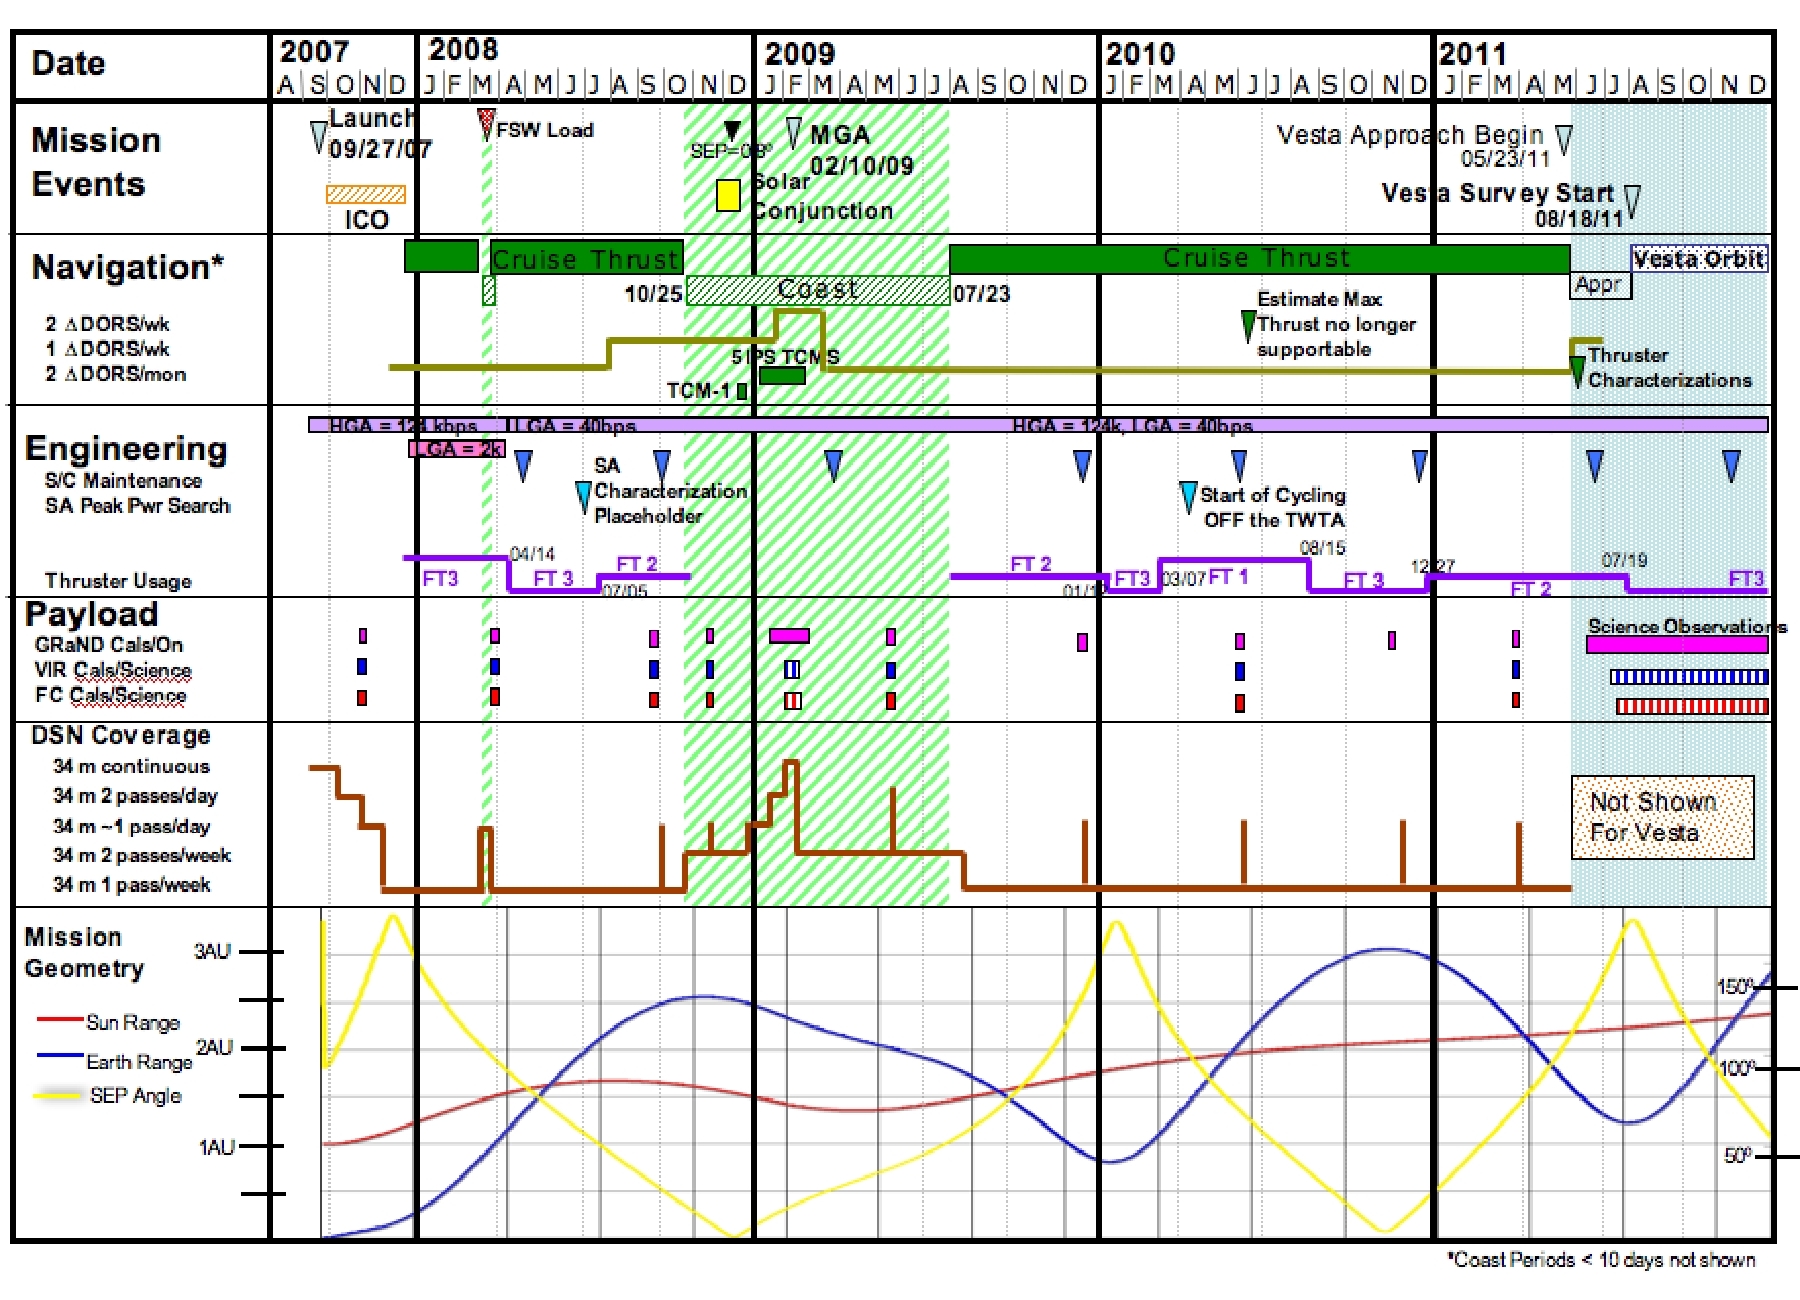
A high-level mission timeline is shown in Figure 2-1 for the launch date of September 27, 2007 with the Vesta arrival date as it was predicted at that time. The instruments on the spacecraft are body mounted so the spacecraft rotates to point the instruments at the targets. All data are stored on board for playback to Earth, and in general, only gravity science (Doppler and range measurements) will be collected during tracking sessions. All data are transmitted to Earth within a few days of acquisition.
The mission phases covered by the Science Plan include Initial Checkout (Launch+1 to L+80 days), Interplanetary Cruise Phases, and Mars Gravity Assist (MCA �90 days to MCA+7 days), as well as the asteroid encounters (Science Orbits). Each Science Orbit phase begins with an Approach sub-phase prior to capture. The Vesta Approach starts ~63 days before capture. Tables 4-2 and 4-8, shown in Section 4, describe the orbit sub-phases at each target body in terms of their durations, beta angles (angle between Sun-body vector and the orbit plane), radii and periods.
The Dawn spacecraft carries three science instruments whose data will be used in combination to characterize these bodies. The instrument suite consists of redundant framing cameras (FC), a visible and infrared mapping spectrometer (VIR), and a gamma ray and neutron detector (GRaND). In addition to these instruments, radiometric and optical navigation (OpNav) data will be used to determine the gravity field, and thus bulk properties and internal structure of the two bodies.
The minimum mission (performance floor) for the Dawn mission reduces the time spent at Vesta and Ceres from 7 months and 5 months, respectively, to 4 months at each. At Vesta, the lowest altitude orbit is eliminated, and the higher- altitude mapping orbit is lengthened to at least 30 days. At Ceres, the higher- altitude mapping orbit is lowered to 1380 km and lengthened to at least 30 days.
Several enhancements to the baseline mission are being studied. These include lengthening the stay time at the bodies, and lowering the altitude of the Low Altitude Mapping Orbit (LAMO) orbit. It is possible that there will be several extra months of time available during the Science Orbit phases. This extra time will be used to enhance the science return from all the instruments, but a priority is to increase the time spent in LAMO and to lower the altitude of LAMO.
Safing and anomaly response may significantly reduce the time available for collecting data, and the efficiency of data collection. Additionally, the significant uncertainty in the orbit transfer time dictates that the plans include contingency to accommodate this uncertainty. The Science Descope contingency plan for responding to safing and anomaly response conditions is included in Section 5.
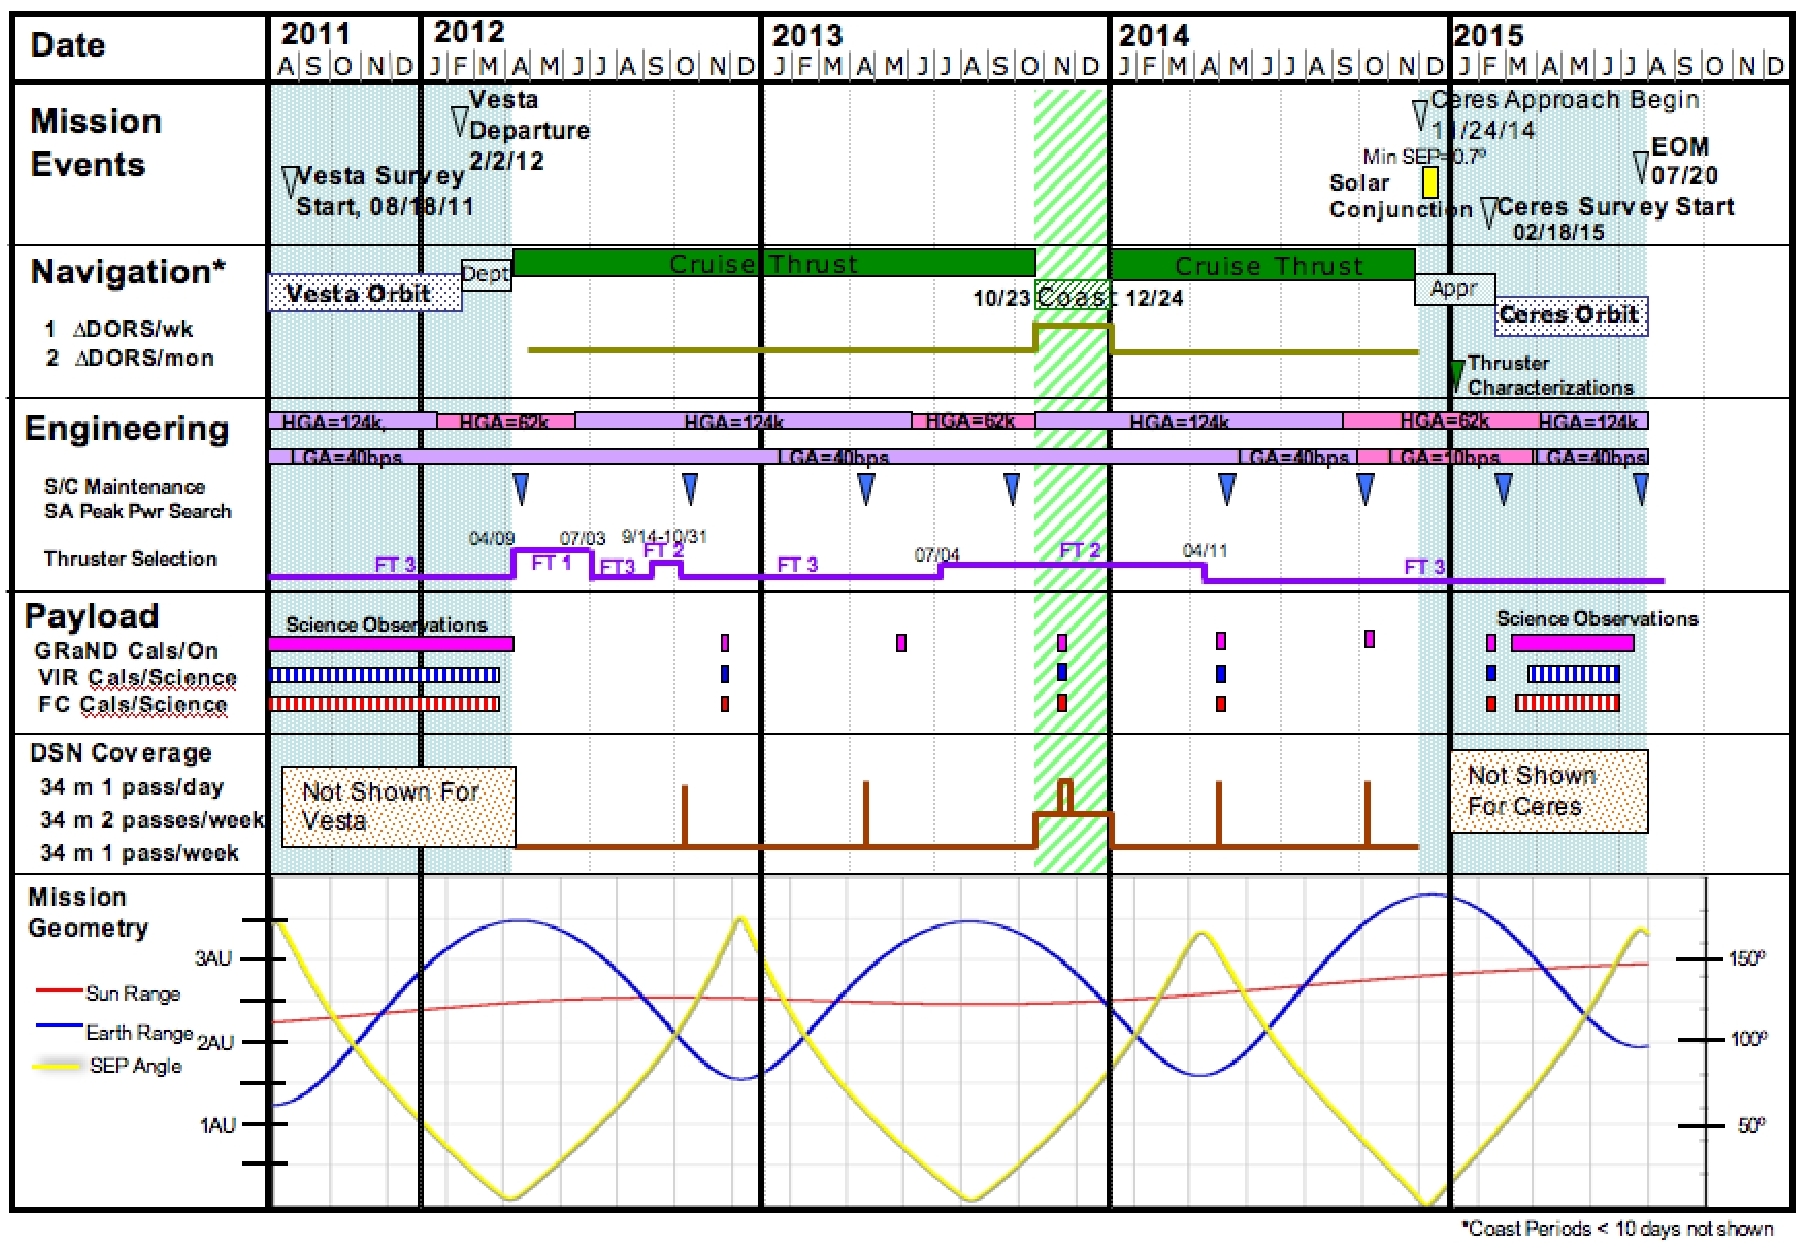
Figure 2-1. Dawn Mission Timeline.
In order to achieve the overall scientific goal of understanding conditions and processes acting at the solar system's earliest epoch, the Dawn spacecraft images the surfaces of the minor planets Vesta and Ceres to determine their bombardment, thermal, tectonic, and possible volcanic history. It determines the topography and internal structure of these two complementary protoplanets that have remained intact since their formation, by measuring their mass, shape, volume, and spin rate with navigation data and imagery. Dawn determines mineral and elemental composition from infrared, gamma ray, and neutron spectroscopy to constrain the thermal history and compositional evolution of Ceres and Vesta, and in addition provides context for meteorites (asteroid samples already in hand). It also uses the spectral information to search for water-bearing minerals.
To achieve the overall goal of the Dawn mission, we have established a set of science objectives that can be met by the instrument suite. These objectives are listed below.
The objectives that are primarily answered by the redundant framing camera instruments are:
1. To determine the origin and evolution of Vesta and Ceres by mapping the extent of geologic processes on the asteroid surfaces, and by using the cratering record to establish a relative chronology of the crustal units and population of impactors in the early solar system.
2.To map the shape, determine the spin state, and establish the degree of cratering of the asteroids visited.
3. To map the topography of Vesta and Ceres.
4. To search for dust and satellites in the environment of the asteroids visited.
The framing cameras will also contribute to answering some of the broader objectives:
5. To provide a geologic, compositional and geophysical context for the HED meteorites.
6. To provide an opportunity to identify Ceres-derived meteorites in their geologic context.
The visible and infrared spectrometer scientific objectives are:
1. To provide a geologic, compositional and geophysical context for the HED meteorites.
2. To provide an opportunity to identify Ceres-derived meteorites in their geologic context.
3. To map the thermophysical properties of Vesta and Ceres.
4. To determine the origin and evolution of Vesta and Ceres by mapping the mineralogical composition and its spatial variation across the asteroidal surface.
The gamma ray and neutron spectrometer scientific objectives are:
1. To map the major elemental composition of O, Si, Fe, Mg, Ti, Al, Ca, and H on Vesta and Ceres.
2. To map the trace elements U, Th, K, Gd and Sm on Vesta and Ceres.
3. To provide a geologic, compositional and geophysical context for the HED meteorites.
The gravity science scientific objectives are:
1. To determine the masses of the asteroids visited.
2. To measure the bulk density of Vesta and Ceres, in conjunction with topography, and determine its heterogeneity.
3. To determine the gravitational fields of Vesta and Ceres.
The Dawn mission seeks to achieve its science objectives above by meeting the science measurement requirements listed below. These requirements constitute the baseline and minimum mission success criteria (Level-1 requirements), which are established in Appendix 9 of the NASA Discovery Program Plan, appropriate to the baseline and minimum mission, respectively.
The full capability of the Dawn mission shall be to:
1. Determine the bulk density of Vesta and Ceres to better than 1%.
2. Determine the spin axis orientations of Vesta and Ceres to better than 0.5 degrees.
3a. Determine the gravity field of Vesta to ≤ 90 km half-wavelength resolution.
3b. Determine the gravity field of Ceres to ≤ 300 km half-wavelength resolution.
4a. Obtain images of ≥ 80% of the surface of Vesta with a sampling of ≤ 100 m per pixel, and a signal-to-noise ratio of at least 50 in the clear filter and in ≥ 3 color filters.
4b. Obtain images of ≥ 80% of the surface of Ceres with a sampling of ≤ 200 m per pixel, and a signal-to-noise ratio of at least 50 in the clear filter and in ≥ 3 color filters.
5a. Obtain a topographic map of ≥ 80% of the surface of Vesta, with a horizontal spatial resolution of ≤ 100 m, and a vertical accuracy of ≤ 10 m.
5b. Obtain a topographic map of ≥ 80% of the surface of Ceres, with a horizontal spatial resolution of ≤ 200 m, and a vertical accuracy of ≤ 20 m.
6a. Measure and map the abundances of major rock-forming elements to +/-20% precision with a spatial resolution equal to ~1.5 times the mapping altitude for the uppermost ~1 meter of the surface of Vesta and Ceres over the entire body.
6b. Measure and map the abundance of hydrogen in the top ~1 meter of Vesta and Ceres.
6c. Estimate the abundances and distribution of the radioactive elements Th, U and K and for the entire surface of Vesta and Ceres to ~1 meter depth.
7a. Measure and map the mineral composition of Vesta by obtaining ≥10000 high spectral resolution frames* from its surface at wavelengths between 0.25 and 5 microns with a spectral resolution of 2-10 nm. At least half of these spectral frames will be at a spatial resolution ≤ 200 m, and the remainder at a spatial resolution ≤ 800 m.
7b. Measure and map the mineral composition of Ceres by obtaining ≥8000 high spectral resolution frames* from its surface at wavelengths between 0.25 and 5 microns with a spectral resolution of 2-10 nm. At least half of these spectral frames will be at a spatial resolution ≤ 400 m, and the remainder at a spatial resolution ≤ 1600 m.
The Initial Checkout (ICO) mission phase was used to turn on and perform initial checkout of the instruments using ground-in-the-loop commanding. Instrument checkout during the 80-day period following launch was not exhaustive; only a minimal set of checkout activities were performed during the ICO to minimize interference with critical spacecraft checkouts. The plan was for each instrument to perform a functional, performance and calibration test during ICO, and to perform interference and stray light tests during the post-ICO early cruise phase. A timeline of ICO instrument activities is shown in Fig. 4-1.
For the timeline shown in Figure 4-1, activities are color-coded according to the sequence build schedule. The horizontal axis is time in days post launch. The amount of radiometric tracking is shown along the bottom of the plots with a label for the amount of tracking per day. FC2 was designated as the prime camera pre-launch, however, to facilitate a smooth transition in the event of a failure, the backup FC (FC1) was fully checked prior to Vesta arrival with appropriate margin. VIR and FC instrument activities were required to be performed no earlier than L+20 days to avoid contamination of optical surfaces by spacecraft outgassing. GRaND activities were required to be performed no earlier than L+7 days to mitigate against arcing at high voltage due to the presence of outgassing residue. Science activities during ICO were not sensitive to launching on any day during the 21-day launch period because the planned activities can accommodate slightly degraded pointing, and are not highly sensitive to Sun-Earth-Probe angle.
Instrument checkout activities were not deemed critical activities during the prime ICO phase (L+80 days). If problems had arisen in completing the activities necessary to begin thrusting, instrument checkout activities would have been deferred until early cruise or later. This was the case with the stray light and interference tests and the FC1 performance and calibration, which were deferred to cruise.
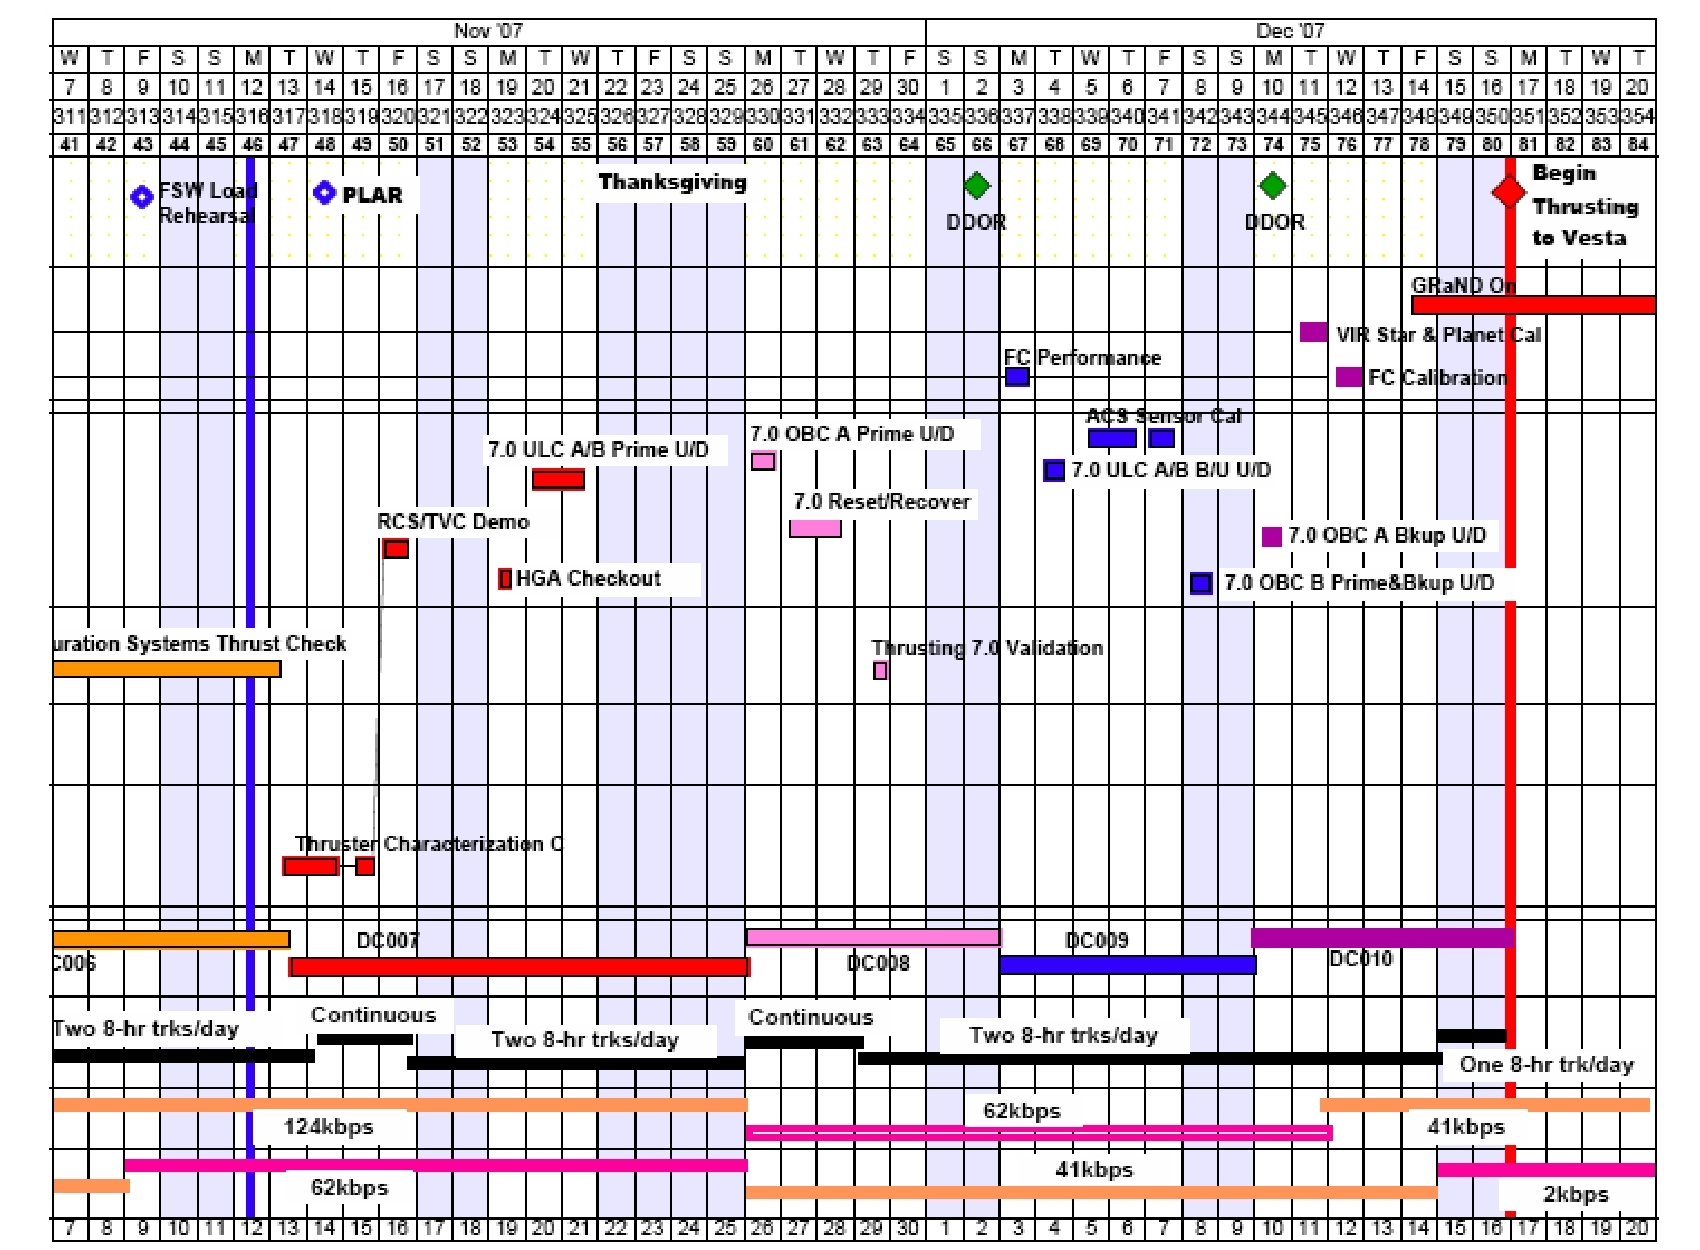
Figure 4-1. Initial Checkout Timelines.
Table 4-1 lists the actual dates and background sequence assignments of the ICO instrument activities.
   ===========================================================================
   Background Sequence      Instrument Activity      Start Date    End Date
   dc003                     GRaND Functional Test   10/16/2007    10/21/2007
   dc003                     VIR Functional Test     10/17/2007    10/17/2007
   dc003                     FC2 Functional Test     10/18/2007    10/18/2007
   dc009                     FC2 Performance Test    12/03/2007    12/03/2007
   dc010                     FC1 Functional Test     12/10/2007    12/10/2007
   dc010                     VIR Calibration         12/11/2007    12/11/2007
   dc010                     FC1 CCD Calibration     12/12/2007    12/12/2007
                               (Mini-Cal)
   dc010                     FC2 Calibration         12/13/2007    12/13/2007
   ===========================================================================
Table 4-1. Initial Checkout Phase Instrument Activities.
Seven days of coast (non-thrusting periods) per year have been designated for instrument calibration activities. These periods were used to perform functional, performance and calibration tests of the instruments using stellar and planetary targets. The framing camera flight software (both the Low Level Software (LLSW) and the User Defined Program (UDP) Library) was updated throughout the cruise to Vesta phase as new capability or patches were required. The seven days of coast were split into two roughly 3.5-day periods at approximately six-month intervals. The framing cameras performed a functional test in each period and an extended calibration test once a year. VIR performed calibrations at each opportunity using stars, star clusters, planets, and planetary nebulae. GRaND had the opportunity to make adjustments to instrument parameters and to anneal the BGO crystal. Continuous tracking was not required during the calibrations.
The cruise to Vesta was divided into two phases (Earth to Mars Cruise and Mars to Vesta Cruise) separated by the Mars Gravity Assist (MGA). Following the Vesta Science Orbit phase there will be an additional Vesta to Ceres Cruise phase. A list of cruise checkout and calibration activities completed prior to Vesta Approach is provided in Table 4-2.
   ===========================================================================
   Background   Earth-Mars Cruise                   Start Date      End Date
   Sequence     Instrument Activity
   ===========================================================================
   dc013      FC1 Performance Test                  02/21/2008      02/21/2008
   dc013      FC1 Calibration                       02/22/2008      02/22/2008
   dc014      GRaND Background Data Collection      04/01/2008      04/10/2008
   dc014      VIR Star & Planet Calibration        04/02/2008      04/02/2008
   dc014      FC1 LLSW & UDP Library Update        04/03/2008      04/03/2008
                       (3.03.02)
   dc014      FC2 LLSW & UDP Library Update        04/03/2008      04/03/2008
                       (3.03.02)
   dc018      FC1 CCD Calibration (Mini-Cal)        08/26/2008      08/26/2008
   dc018      FC2 CCD Calibration (Mini-Cal)        08/26/2008      08/26/2008
   ===========================================================================
   Background      Mars-Vesta Cruise                Start Date      End Date
   Sequence        Instrument Activity
   ===========================================================================
   dc034      GRaND Background Data Collection      11/30/2009      12/07/2009
   dc034      VIR Geometric Calibration #1          11/30/2009      12/01/2009
   dc034      FC2 LLSW & UDP Library Update        12/01/2009      12/01/2009
                         (3.04.02)
   dc034      FC1 LLSW & UDP Library Update        12/02/2009      12/02/2009
                        (3.04.02)
   dc038      VIR Geometric Calibration #2          04/25/2010      04/26/2010
   dc038      VIR Mass Memory Reconfiguration       05/09/2010      05/11/2010
   dc041      GRaND Background Data Collection      07/19/2010      07/26/2010
   dc041      FC1 UDP Library Patch (3.04.02.01)    07/20/2010      07/20/2010
   dc041      FC2 UDP Library Patch &              07/20/2010      07/20/2010
                      Calibration
   dc041      GRaND Anneal Demo                     07/20/2010      07/20/2010
   dc041      VIR Geometric Calibration #3          07/21/2010      07/21/2010
   dc048      GRaND Anneal                          03/15/2011      03/20/2011
   dc048      VIR Functional Test &                03/15/2011      03/15/2011
               redundant heater demo
   dc048      FC2 FSW & UDP Library Update         03/15/2011      03/15/2011
                 (3.05.01)
   dc048      FC2 Non-Pointed Checkout              03/15/2011      03/15/2011
   dc048      FC1 FSW & UDP Library Update         03/16/2011      03/16/2011
                 (3.05.01)
   dc048      FC1 Non-Pointed Checkout              03/16/2011      03/16/2011
   dc048      GRaND Background Data Collection      03/21/2011      03/28/2011
   ===========================================================================
Table 4-2. Cruise Phase Instrument Checkout and Calibration Activities.
The purpose of the MGA was to change the spacecraft trajectory to ensure adequate mass and power margins for the designed trajectory. The MGA had the potential to add to the scientific return of the mission by providing an opportunity for instrument calibration, and a readiness exercise for Vesta operations. Mars provided an absolute calibration of the GRaND instrument, and presented a valuable extended source for calibrating VIR and FC. Unique and potentially valuable spectroscopy was planned for VIR. The Mars observations were also the first flight use of the Science Cheby Pointing Mode. These pointed activities were expected to provide insight into the behavior and accuracy of the Cheby pointing mode and its application to asteroid operations. While valuable to operations, none of these activities were critical to achieving the goals of the mission.
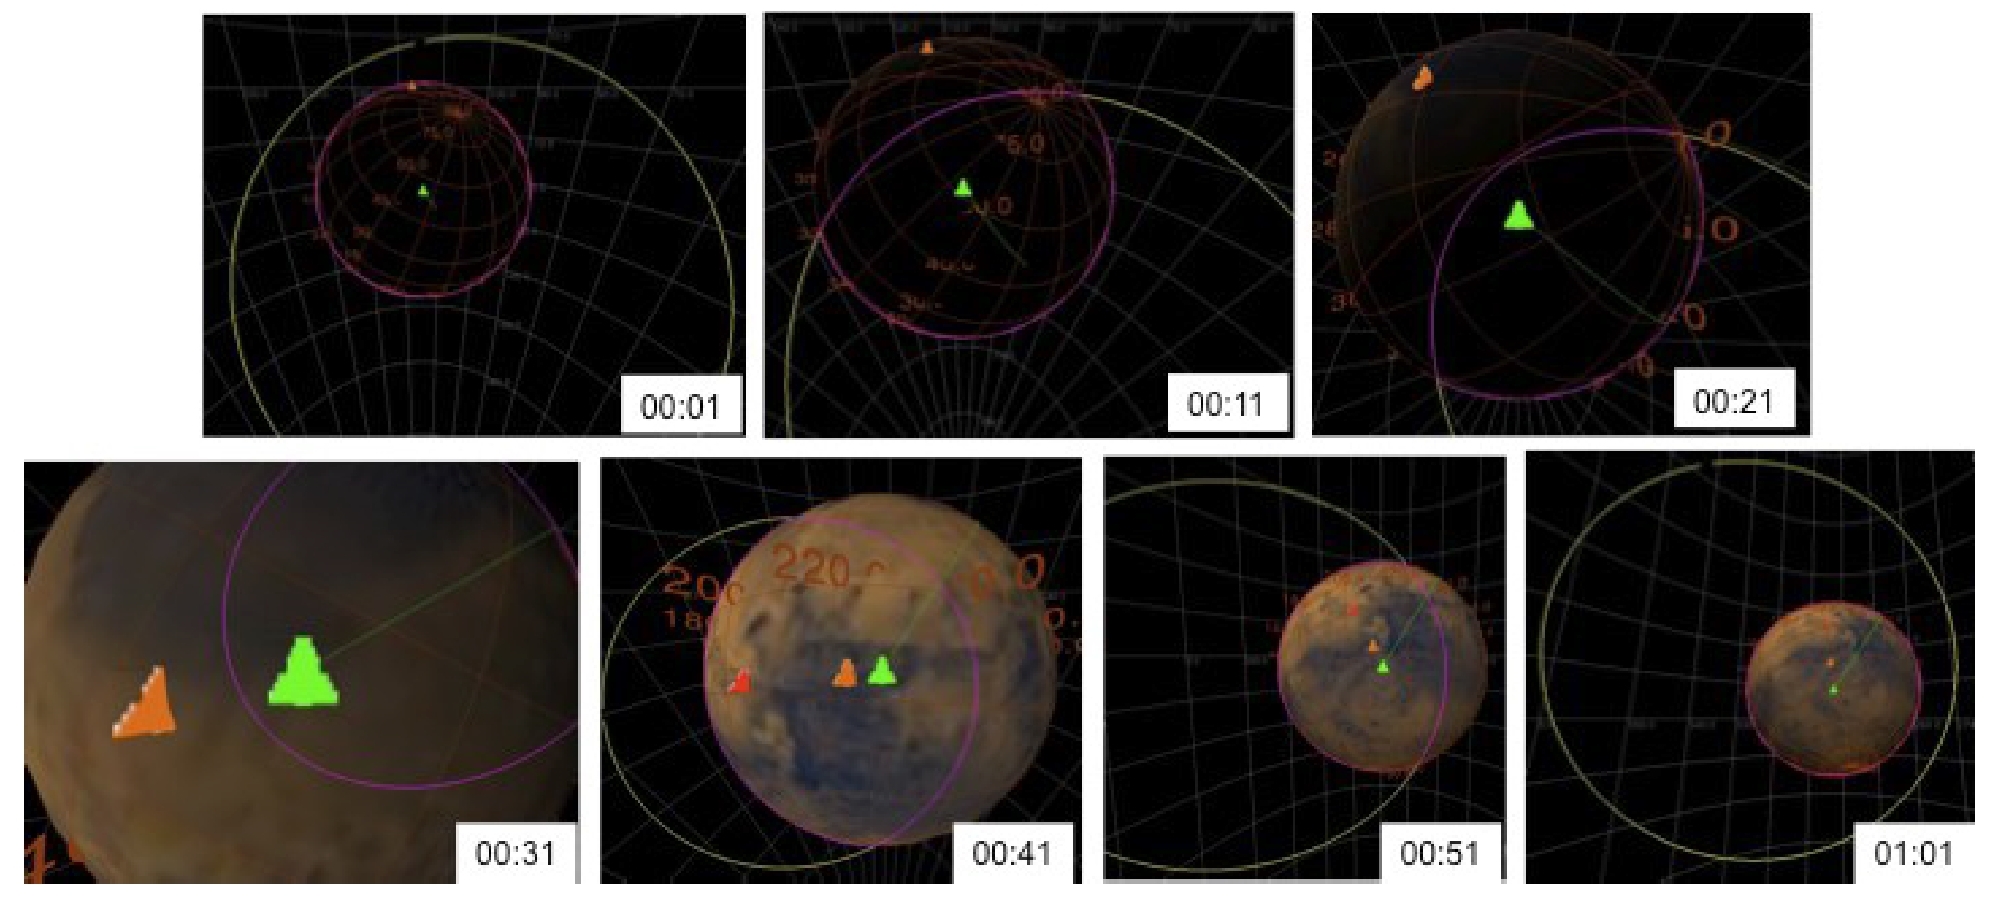
An overview of the Mars observations is given in the timeline shown in Table 4- 3. The trajectory used to develop the timeline was dawn_ref_081031- 090601_081201_dc022p1_v1.bsp with Mars Closest Approach (MCA) = 2009- 049T00:27:04.374 or Feb 18, 2009 00:27:04.374. The final MCA time was 00:27:57.6 UTC. To satisfy sun-pointing constraints, the spacecraft +Z axis could not be pointed directly to Mars center during approach. The Mars approach observation geometry for GRaND is illustrated in Figure 4-3. The green triangle is the sub- spacecraft point and the orange triangle is the sub-reflection point.
   ===========================================================================
   Start Time relative          MGA Activity Description (da023)
   to Mars Closest Approach
   ===========================================================================
   MCA-2:31                     GRaND Closest Approach (using RA/Dec waypoints)
   MCA-0:07                     FC2 Smeared Flats and Extra Charge
   MCA+0:51                     VIR Terminator
   MCA+2:00                     FC2 OpNav 1
   MCA+2:42                     FC2 Smeared Flats and Extra Charge (Mars center)
   MCA+3:05                     VIR South Pole (lit and dark)
   MCA+3:53                     FC2 OpNav 2 (2x2 mosaic)
   MCA+5:00                     FC2/VIR Cross Cal (multicolor imaging)
   MCA+5:15                     FC2 Infield Stray Light
   MCA+6:40                     FC2 Departure Movie (26 hours - Mars center) - includes
                                VIR Cube at MCA+10:30
   MCA+33:40                    FC2 Out of Field Stray Light
   MCA+35:30                    First Mars data playback
   MCA+63:55                    FC2 OpNav 3
   ===========================================================================
Table 4-3. Mars Gravity Assist Science Activity Timeline.
Figure 4-3. GRaND observation geometry during Mars Gravity Assist.
Aside from the GRaND data collected in the vicinity of the MGA and five early framing camera images, none of the remaining Mars observations were successfully retuned to the ground. The Dawn spacecraft entered safe_comm mode 14 minutes after MCA on February 18, 2009 00:41:58.796 UTC as a result of an unexpected behavior of the star tracker error flags following the star tracker occultation by Mars. Only the data that was already in the spacecraft VRs could be returned to the ground since the other Mars data collected was lost when the instruments were powered off by fault protection.
The MGA Phase began 90 days before MCA and consisted of four background sequences that spanned the period of optimal coast around MGA. In addition to the Mars flyby calibrations, the other instrument activities listed in Table 4-4 were performed during the MGA Phase.
   ===========================================================================
   Background      MGA Phase Instrument Activity       Start Date      End Date
   Sequence
   ===========================================================================
   dc022           GRaND Background                    01/20/2009      02/18/2009
   dc022           GRaND Adjust & SCLK Mitigation     01/24/2009      01/24/2009
   dc023           Mars Gravity Assist Activities      02/18/2009      02/21/2009
   dc024           GRaND Background (Standby ISA)      03/03/2009      03/27/2009
   dc024           FC2 Filter Wheel Init               03/23/2009      03/23/2009
   dc024           VIR Cover Closed Verification       03/26/2009      03/26/2009
   dc024           FC2 Stray Light Test                04/01/2009      04/01/2009
   dc026           VIR Post SafeMode Check Out         05/27/2009      05/27/2009
   ===========================================================================
Table 4-4. Mars Gravity Assist Mission Phase Activity Timeline.
Science data will be collected during the Vesta Approach sub-phase, and in each of the Science Orbit sub-phases, to satisfy the science objectives and measurement requirements specified above (and in Appendix 9 to the Discovery Program Plan) and to provide other observations necessary to characterize Vesta well enough to transition to the next sub-phase.
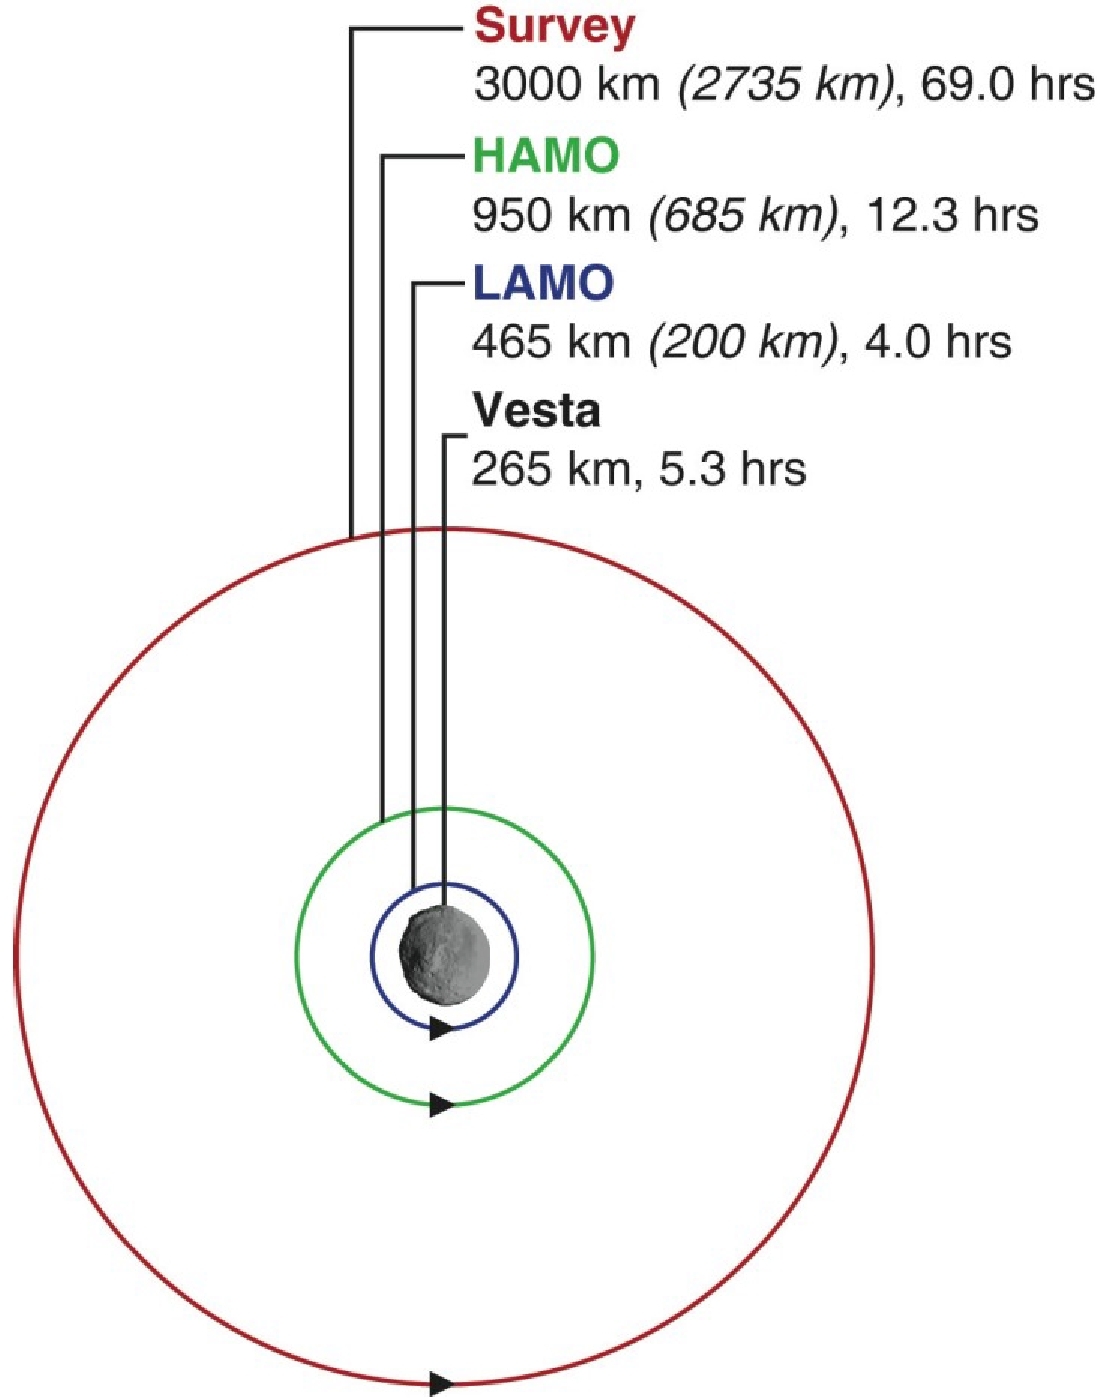
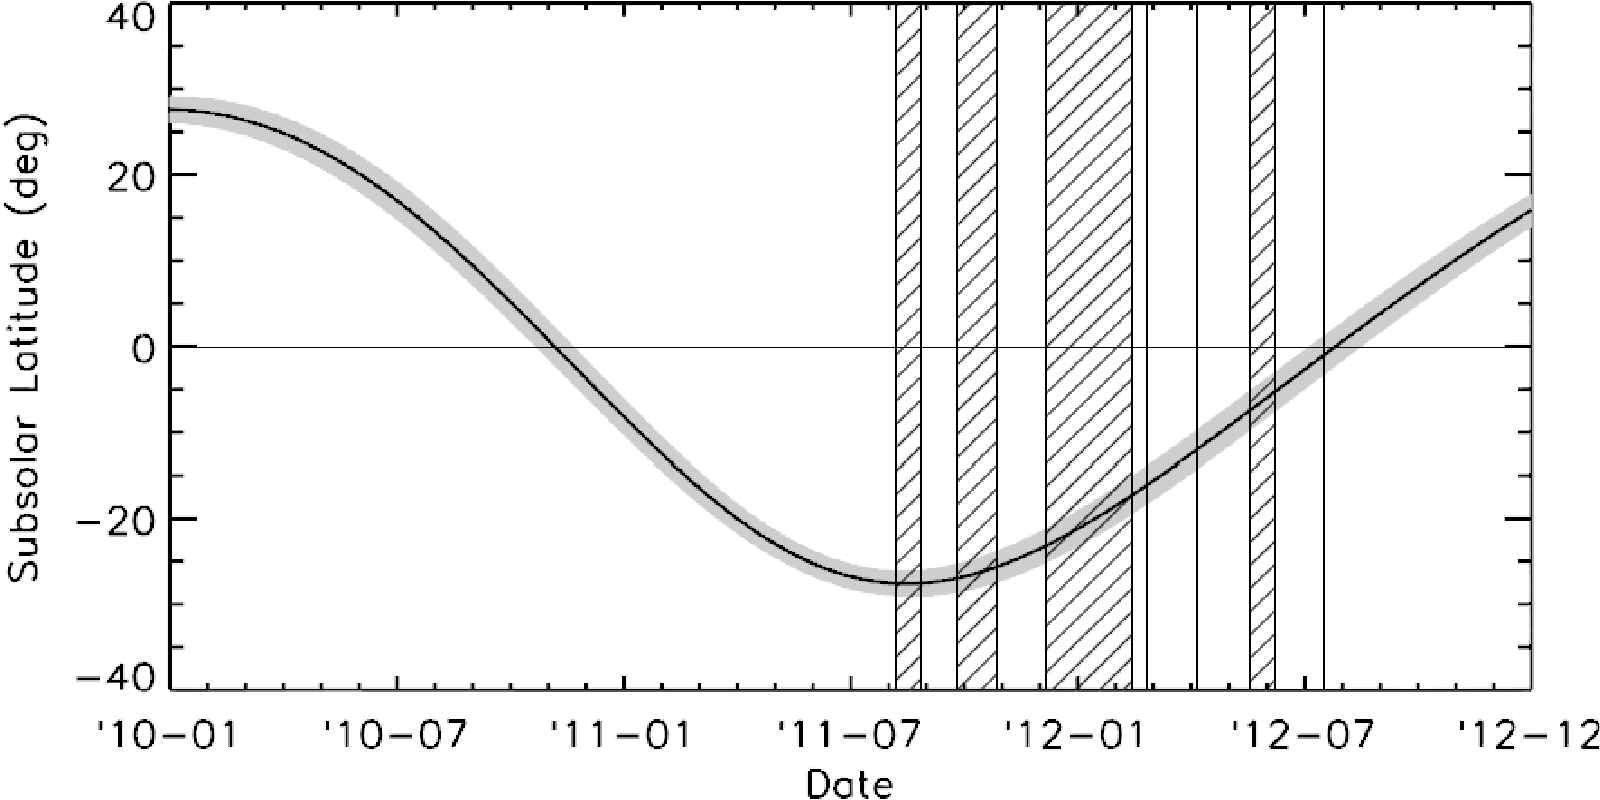
The Science Orbit sub-phases will be: Survey Orbit, High Altitude Mapping Orbit- 1 (HAMO-1), Low Altitude Mapping Orbit (LAMO), and High Altitude Mapping Orbit-2 (HAMO-2) as shown in Figure 4-4. The Survey Orbit sub-phase will provide the best global coverage for VIR spectral mapping and an overview of the asteroid for the planning of subsequent sub-phases. The Survey Orbit sub-phase will last 20 days and will start at the end of the Vesta Approach sub-phase when the spacecraft has established a circular polar orbit at a radius of 3000 km. The HAMO sub-phases will primarily be used for the optical mapping and reflectance spectral sampling of the surface of the asteroid. The required Level-1 science for these sub-phases will be multi-color surface maps (clear and 3 filters) of 80% of the surface, a topographical map of 80% of the surface and at least 5000 VIR spectral frames. The first HAMO sub-phase, HAMO- 1, will last 34 days and will start at the conclusion of the Survey to HAMO-1 transfer when the spacecraft has achieved a circular near-polar orbit at �950 km mean radius. The LAMO sub-phase will primarily be used to collect gamma ray and neutron spectra as well as to determine the gravity field. LAMO will last at least 70 days at Vesta and will begin at the end of the HAMO-1 to LAMO transfer when the spacecraft is in a 465 km mean radius circular polar orbit. Any design margin and operations that remains at the beginning of the nominal LAMO sub- phase will be used to extend the duration of LAMO. Following LAMO, a second HAMO sub-phase at 950 km radius, HAMO-2, is designed to acquire images of areas that have become illuminated since HAMO-1 mapping in order to increase the percentage of the surface that is mapped sufficiently well to achieve the topography Level-1 requirements. During the departure phase, the spacecraft will stop thrusting briefly above the Survey orbit altitude to acquire data in the newly illuminated northern hemisphere. Details of the Vesta Orbit sub-phases are given in Table 4-5, and the lighting conditions for each sub-phase (striped boxes) are shown in Figure 4-5 [Li, 2011].
Figure 4-4. Vesta Mapping Phases Overview.
================================================================================
Sub-phase              Duration (days)  Beta Angle   Orbit Radius   Orbit Period
                                           (deg)         (km)          (hrs)
================================================================================
Vesta Approach to
Survey Orbit                100.4

Vesta Survey Orbit      20.3 (7 orbits)     10           3000          69.0

Transfer from Survey         28.3
Orbit to HAMO-1

Vesta HAMO-1            33.8 (63 orbits)    30            950          12.3

Transfer from HAMO-1
to LAMO                      40.5

Vesta LAMO                    70            45            465           4.0

Design Margin
(extra stay time)             4.0

Operations Margin
(may extend LAMO)            40.0

Transfer from LAMO
to HAMO-2                    45.0

Vesta HAMO-2            21.0 (41 orbits)    45            950           12.3

Vesta Departure              38.7            -
================================================================================
TOTAL                   442.3
================================================================================
Table 4-5. Vesta Orbit Sub-phase Parameters.
Figure 4-5. Vesta lighting conditions for baseline trajectory and Li pole location
The Vesta Science Plan development was guided by the following constraints and mitigations:
Planning begins by balancing the surface coverage that can be obtained over a mapping sub-phase and the data volume that can be returned during the available downlink passes. Engineering activities are included per the mission requirements. The plan is then iterated with the instrument teams until the plan fits within the required margin requirements.
During the Approach sub-phase one of the primary activities will be the collection of OpNav data using the Framing Camera. While these are primarily engineering data, they are useful for determining the Vesta albedo and appropriate exposure durations for the various science observations during approach. The VIR instrument collects data during several of the OpNav imaging opportunities in order to understand the instrument response to an extended body and the integration times that will be required for later Vesta observations.
An additional activity during the Approach phase is to exercise the data processing streams for the instruments, mainly the FC and VIR, to verify that quick-look products can be produced on the required timelines, and to check and improve the calibration parameters.
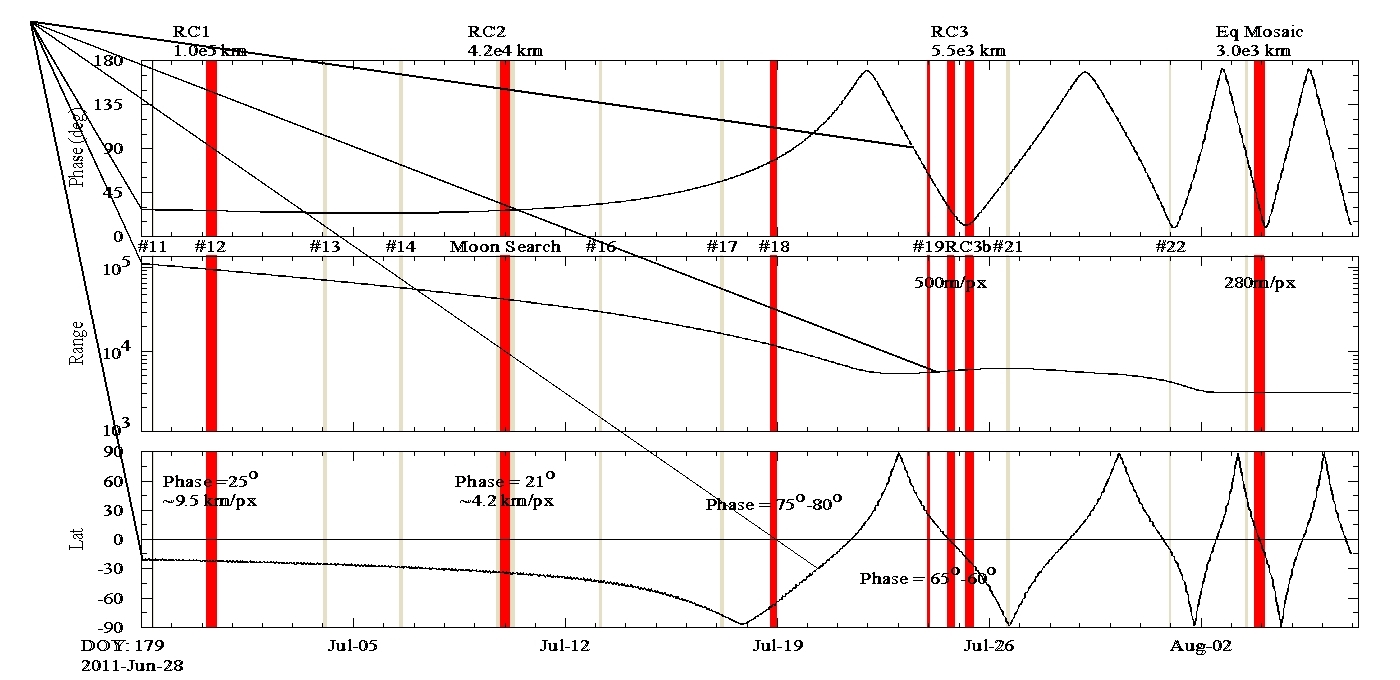
The Vesta Approach trajectory used to produce the analysis products shown here is dawn_ref_110419-110503_110404_da001_BGonly_v1.bsp and the near-approach geometry is shown in Figure 4-6. The panels in this figure are: phase angle in degrees (top); Vesta range in kilometers (middle); and Vesta planetocentric latitude in degrees (bottom). Vertical bars indicate various OpNav or science activities and labels for these activities are found either at the top of the figure or between the top and middle panels. Bars shown in red indicate VIR ride-along observations. GRaND is on throughout the approach period collecting background counting rate data. Additional details regarding these activities are provided in Table 4-6 below.
 ============================================================================================
 Observation          Date         Duration  Phase Angle   Vesta        FC Pixel    VIR Pixel
                      yyyy-mm-dd   (hh:mm)   (deg)         Range (km)   Size (km)   Size (km)
 ============================================================================================
 OpNav 1              2011-05-03   00:30      43            1.2e6        115         300
 OpNav 2 w/VIR        2011-05-10   01:30      42            1.0e6        93          250
 ride-along
 OpNav 3              2011-05-17   00:30      42            8.1e5        76          205
 OpNav 4              2011-05-24   00:30      41            6.5e5        61          164
 OpNav 5              2011-06-01   00:30      39            4.8e5        45          122
 OpNav 6 w/VIR        2011-06-08   01:40      37            3.5e5        33           89
 ride-along
 OpNav 7              2011-06-14   01:00      34            2.7e5        25           68
 OpNav 8              2011-06-17   01:00      33            2.3e5        22           58
 OpNav 9              2011-06-20   01:00      31            1.9e5        18           48
 OpNav 10             2011-06-24   01:00      29            1.5e5        14           38
 OpNav 11             2011-06-28   02:00      27            1.2e5        11           30
 Rotational           2011-06-30   05:30      25            1.0e5        9.5          25
 Characterization 1
 OpNav 13             2011-07-04   02:00      24            7.5e4        7.1          19
 OpNav 14             2011-07-06   02:00      23            6.1e4        5.8          16
 Moon Search          2011-07-09   05:00      25            4.5e4        4.3          11
 Mosaics 1 and 2
 Rotational
 Characterization 2   2011-07-10   05:30      25            4.4e4        4.2          11
 Moon Search          2011-07-10   05:00      25            4.3e4        4.1          11
 Mosaics 3 and 4
 OpNav 16             2011-07-13   02:00      32            3.0e4        2.8          7.6
 OpNav 17             2011-07-17   02:00      57            1.6e4        1.5          4.1
 OpNav 18 w/VIR       2011-07-18   02:10      78            1.1e4        1.0          2.8
 ride-along
 OpNav 19 w/VIR       2011-07-23   03:00      62            5.3e3        0.50         1.3
 ride-along
 Rotational
 Characterization 3   2011-07-24   05:30      28            5.5e3        0.52         1.4
 Rotational
 Characterization 3b  2011-07-25   05:30      11            5.8e3        0.55         1.5
 OpNav 21             2011-07-26   01:15      60            6.0e3        0.57         1.5
 OpNav 22             2011-07-31   01:15      14            4.1e3        0.39         1.0
 OpNav 23             2011-08-03   01:15      80            3.0e3        0.28         0.76
 1x3 Equatorial       2011-08-03   06:00      30            3.0e3        0.28         0.76
 Mosaic
 ============================================================================================
Table 4-6. Dawn Approach Observations.
Figure 4-6. Vesta Near Approach Geometry.
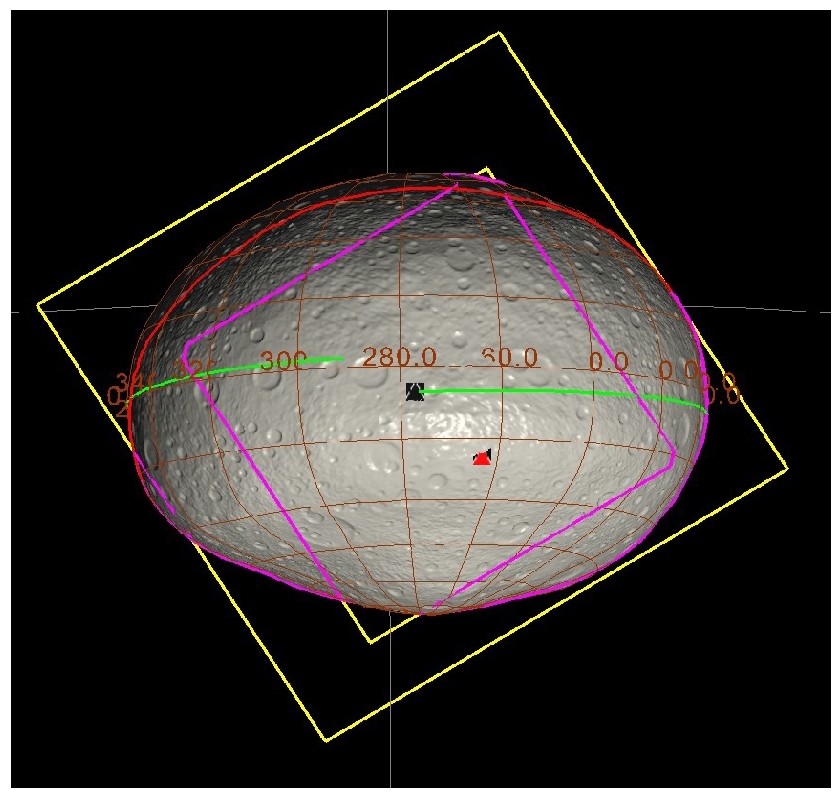
The primary science observations during the Approach sub-phase are the three FC rotation characterization (RC) maps that will be obtained at increasing resolution as the spacecraft approaches Vesta. The resolution of these maps increases from ~32 km/px in the first RC, to 6.5 km/px in the second RC, and finally 0.5 km/px in the last global map which equate to roughly twice, 4x, and 64x the Hubble resolution. Clear filter images are acquired every 10 degrees of Vesta longitude (8m 54s) using 2 different exposure times - one optimized to resolve Vesta surface features and the other to resolve the background star field. The best pre-Approach estimate of the Vesta rotational pole location is RA=305.8°+/-3.1°, DEC=41.5° +/-1.5° from Li et al. [2011]. The stated error bounds are one sigma. The RC observations are intended in part to incrementally improve our knowledge of the Vesta pole position during the approach period in order to improve the trajectory design. In addition to the clear filter imaging, VIR will obtain full-disc spectra and there is a full pass through the FC filter wheel every 30 degrees of longitude. Data obtained in the Approach phase will provide a range of illumination angles to test exposure and integration times, initialize the topographic model, and provide data to aid in finalizing the plans for HAMO-1 and LAMO. Figure 4-7 shows the RC3 observation. Vesta is shown with the false texture map developed by the OpNav Team to simulate Vesta topography to support planning analyses. The spacecraft ground track is shown in green, the sub-spacecraft and sub-solar points are the black and red triangles respectively, and the terminator is the red line. The FC (larger) and VIR footprints are shown in yellow when on the background sky and purple when on Vesta. Note that while the spacecraft is in a polar orbit, the spacecraft ground track traces around the equator in this figure because the Vesta rotation period of 5.3 hours is significantly less than the spacecraft orbit period of several days.
Figure 4-7. Rotational Characterization #3
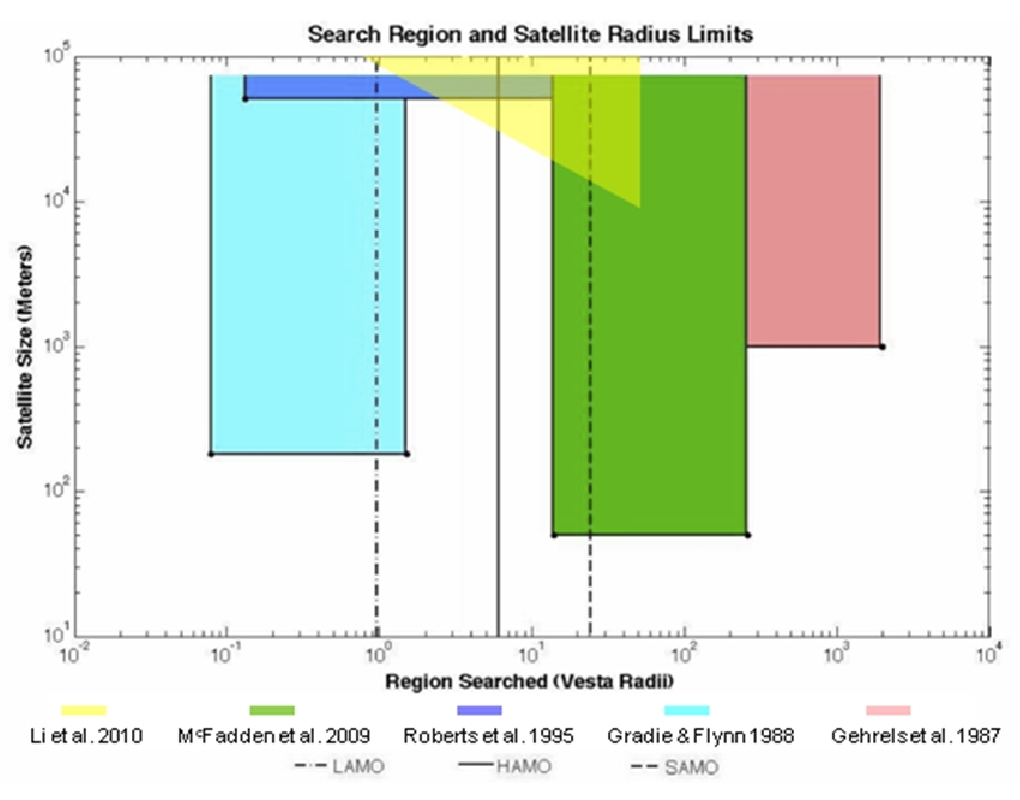
Figure 4-8. Summary of previous Vesta satellite search results
During the Vesta approach period searches for moons will be performed in the near-Vesta environment. Preliminary analysis shows that a Framing Camera search for moons, using 2x2 image mosaics and covering the entire Hill sphere, would require a Vesta range of approximately 1.4x10⁶ km, during the pre- approach cruise sub-phase. It was also determined that this search could be better accomplished by using the Hubble Space Telescope rather than by using Dawn. The Hubble images [McFadden et al., 2009] indicate that there are no moons larger than 50 m at the Vesta albedo in the Hill Sphere excluding the region inside of 15 Vesta radii. In order to search closer to Vesta, the 200" Hale Telescope at Palomar Observatory was used to search for satellites employing a coronagraph to block light from Vesta. The Li et al., 2010 results of this investigation indicate that there are no moons larger than 100 km within the LAMO orbit, none larger than 20km within the HAMO orbit, none larger than 5 km within the Survey orbit, and none larger than 1km within the image FOV. To date, no Vesta satellites have been identified. Figure 4-8 [modified after McFadden et al., 2009] summarizes the regions searched and the limiting satellite sizes from the various studies to date.
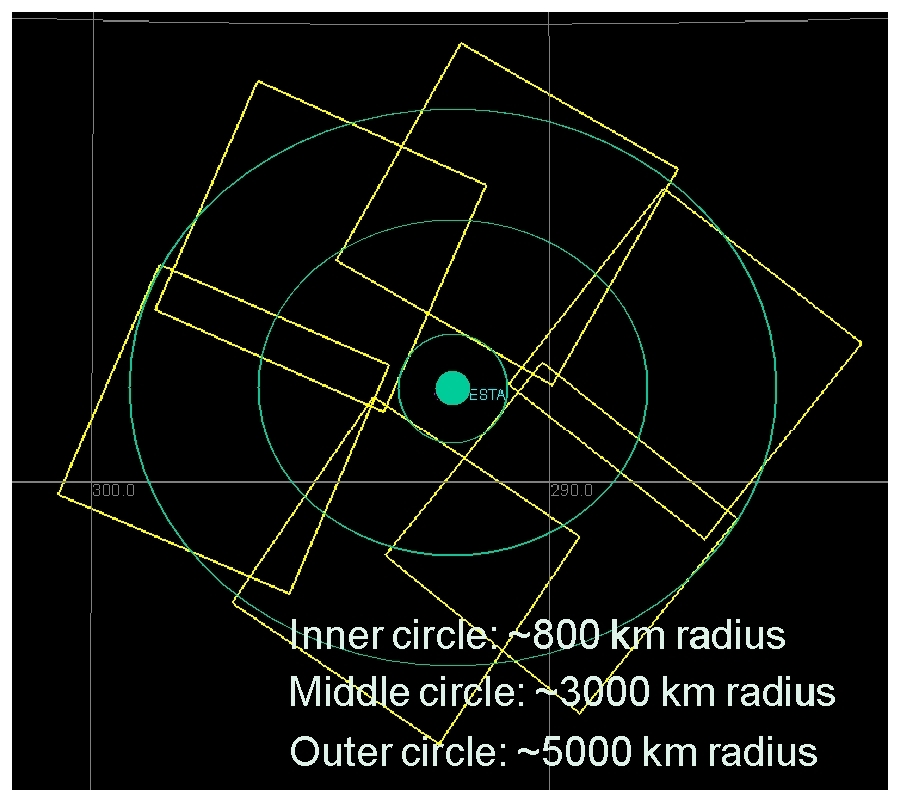
Figure 4-9. Vesta Satellite Search Mosaic
Dawn will search the operational sphere inside of 5000 km range for Vesta satellites that are smaller than the detection limits of the previous studies. The Dawn moon search observations will be performed in conjunction with the second RC map. The plan is to search and the target region by using a series of 3x2 mosaics using multiple exposure durations. The mosaics will be repeated at time offsets on the order of 10, 100, and 1000 minutes in order to provide some limited information on the possible orbit plane and radius of any object detected. Figure 4-9 shows an example of one of the 3x2 mosaics that will be used in the search. Vesta is shown along with the RA/DEC grid and 6 FC sky prints (yellow squares). Each image station is 21 minutes long and consists of 4 sets of images with exposure durations of ~5s, ~20s, and ~4m30s. A region of roughly one Vesta diameter (3σ pointing error) around the asteroid is excluded from the mosaic in order to keep the asteroid out of the image during these long exposure images. The spacecraft requires ten minutes to turn and settle between mosaic stations. Immediately after the first mosaic completes, a second mosaic will be performed. Following the second mosaic is the 5.5-hour RC2 map. During the RC, four sets of four Vesta centered moon search images are rapidly acquired using a moderate (1.5 second) exposure duration. These images will be co-added on the ground to effectively increase the exposure duration allowing for the possibility of detecting moons in the inner exclusion region. Following RC2 the final mosaic is acquired.
Table 4-7 below gives the predicted 1σ pointing error associated with each of the Dawn approach activities in units of milliradians as well as FC and VIR pixels. Rows color coded in orange
          |         Pass 1 only          |        With Pass 2 EU         | Error in VIR scan  | Vesta
          |                              |                               |      pixels        | Diam.
          |                              |                               |Pointing   Pointing |
          |                              |Pointing  Pointing   Pointing  |error      error in |Size of
          |Pass 1   Pointing   Pointing  |Predict   error in   error in  |(mrad) in  VIR scan |Vesta
Activity  |Predict  error in   error in  |(1-sig)   FC pixels  VIR pixels|VIR scan   direction|(in VIR
          |(mrad)   FC pixels  VIR pixels|after EU  (after     (after    |direction  (pixels, |pixels)
          |         (Pass 1)   (Pass 1)  |(mrad)     EU)        EU)      |(x-dir)    after EU)|
----------|------------------------------|-------------------------------|--------------------|-------
opnav1    |  0.8       8.60       3.2    | 0.432       4.65      1.73    |                    |
opnav2*   |  1.46     15.70       5.84   | 0.297       3.20      1.19    |  0.109       0.44  |  2.5
opnav3    |  2.49     26.77       9.96   | 0.709       7.63      2.84    |                    |
opnav4    |  4.13     44.41      16.52   | 1.100      11.83      4.40    |                    |
opnav5    |  7.86     84.52      31.44   | 1.400      15.05      5.60    |                    |
opnav6*   |  2.38     25.59       9.52   | 0.840       9.03      3.36    |  0.343       1.37  |  6.5
opnav7    |  4.83     51.90      19.31   | 1.596      17.16      6.38    |                    |
opnav8    |  6.72     72.27      26.88   | 1.002      10.77      4.01    |                    |
opnav9    |  9.30     99.97      37.19   | 1.094      11.77      4.38    |                    |
opnav10   | 14.27    153.42      57.07   | 2.038      21.91      8.15    |                    |
opnav11   | 21.88    235.29      87.53   | 2.750      29.57     11.00    |                    |
RC1/ON12* |  2.59     27.87      10.37   | 2.592      27.87     10.37    |  1.600       6.40  | 20
opnav13   |  4.82     51.79      19.27   | 2.975      31.99     11.90    |                    |
opnav14   |  8.46     90.98      33.84   | 3.779      40.63     15.11    |                    |
RC2/ON15* | 14.23    152.98      56.91   | 4.614      49.61     18.45    |  3.500      14.00  | 40
opnav16   | 28.42    305.58     113.67   | 6.902      74.21     27.61    |                    |
opnav17   |  5.64     60.67      22.57   | 5.643      60.67     22.57    |                    |
opnav18*  |  8.34     89.63      33.34   | 8.336      89.63     33.34    |  5.700      22.80  |> FOV
opnav19*  | 77.03    828.27     308.12   |18.700     201.08     74.80    | 18.300      73.20  |> FOV
RC3*      | 68.95    741.36     275.79   | 9.700     104.30     38.80    |  3.100      12.40  |> FOV
RC3b*     |                              |                               | 10.600      42.40  |> FOV
opnav22   |185.70   1996.75     742.79   | 6.344      68.22     25.38    |                    |
opnav23   |335.59   3608.54    1342.38   |39.802     427.98    159.21    |                    |
Eq Mosaic*|335.59   3608.54    1342.38   |39.802     427.98    159.21    |                    |> FOV

* Observations that include VIR ride-along data
Table 4-7. Dawn Approach Observation Pointing Errors.
indicate observations that include VIR ride-along data. Columns 2-4 give the total pointing error in units of milliradians, FC pixels, and VIR pixels, assuming there is no ephemeris update (EU) on the spacecraft. The last column gives the apparent size of Vesta in VIR pixels (neglecting smear) assuming the onboard spacecraft ephemeris used is the one available at the time of the Pass 1 input to the sequencing process. Columns 5-7 give the same information assuming that an ephemeris update is made during the uplink opportunity immediately prior to the observation. Columns 8 and 9 give the estimated pointing error in the direction of the VIR mirror scan.
The science goals for the Survey orbit are to obtain global coverage with VIR at a nominal resolution of roughly 800 meters/pixel (excluding smear), and to create overlapping global images with the FC in multiple filters. The VIR map constitutes the primary (and perhaps only) global reference set. The FC maps will be 3-4 frames each. The dispersion in viewing angle across the camera field of view at the Survey altitude will provide both global stereo (Stereo) and stereo photoclinometry (SPC) coverage between adjacent overlapping sets of images. These VIR and FC global maps will be used for definition of possible regions of interest to be investigated at lower altitudes, and the FC data will contribute significantly to the development of the topographic model. Cross- calibration of the VIR and FC will be facilitated by concurrent imaging during this sub-phase.
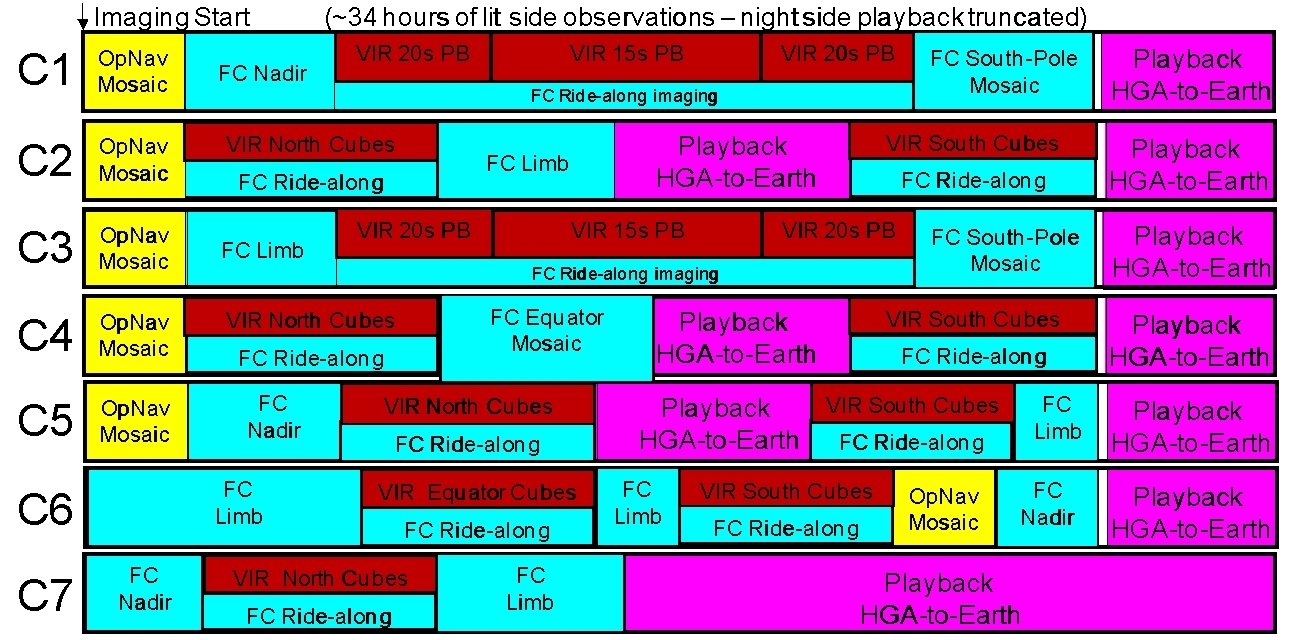
Figure 4-10. Vesta Survey Timeline Overview.
The Vesta Survey trajectory file is named dawn_ref_110810-110827_100324_isb_survey.bsp.
This trajectory and the observations that follow are based on the Thomas et al. [1997] pole. More recent Hubble Space Telescope observations of Vesta by Li et al. [2011] provide a different pole solution. Analysis of the impact of changing the science planning to use a spacecraft ephemeris based on the Li pole indicate that the science objectives of the Survey observations are preserved although there are minor differences in the illumination conditions. The reference trajectory does not reflect the mission change that added a seventh orbit to Survey in order to provide the Navigation (NAV) Team with time to design the transfer to HAMO-1 trajectory and thrust plan. A timeline of activities during three orbits at the Survey radius of 3000 km is shown below in Fig. 4-10.
The observation strategy for the Survey orbits is to collect data that are functionally redundant in order to protect against the loss of any single observation. Functionally redundant observations are not truly identical in nature but are designed to provide essentially the same data (e.g., same latitude band under similar lighting conditions but not at exactly the same longitudes). Missed observations, or data lost during transmission to the ground, will not be reacquired. In this plan, observations in orbits 1 and 2 are repeated in orbits 3 and 4. The equatorial mosaic acquired during the late approach after Dawn is in orbit at the Survey altitude provides the redundancy for the mosaic in orbit 4.
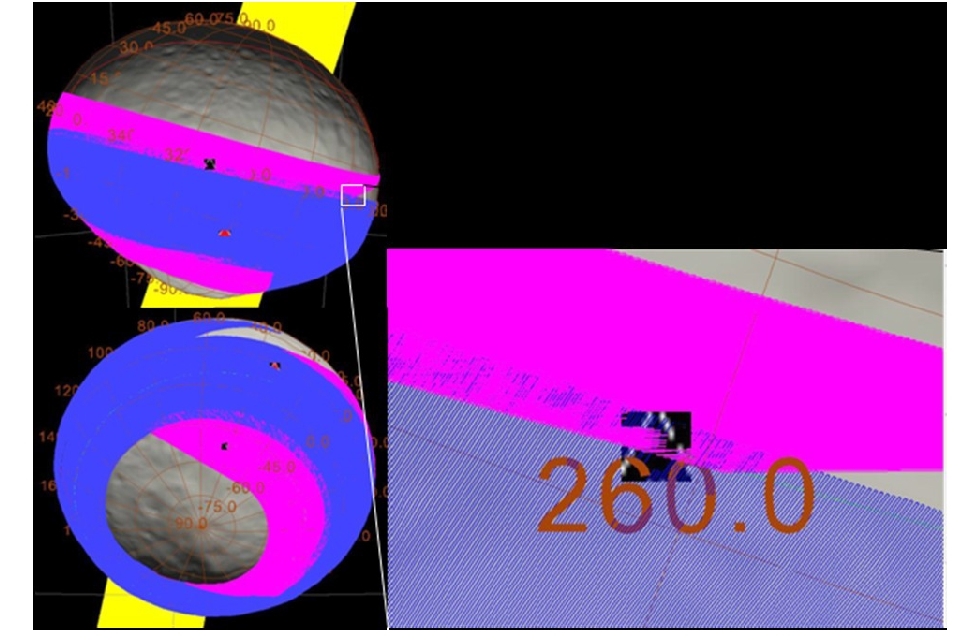
During the first and third Survey orbits, VIR will acquire data in pushbroom mode with the spacecraft pointing the +Z axis towards Vesta but offset from nadir by 1.5° about the +X axis.
Figure 4-11. VIR Pushbroom Observations in Survey Orbits 1 and 3.
This slight offset from nadir is required to give slit connectivity from one Vesta rotation to the next during the 13-hour pushbroom observation. Figure 4- 11 shows the VIR coverage obtained during the first orbit pushbroom activity. The VIR repetition time is increased from 20 seconds (pink) to 15 seconds (blue) near the equator to improve slit connectivity. However, gaps between slits remain as shown expanded view on the right portion of the figure. Orbits C1 and C3 cover the same latitude band at different starting longitudes filling in most of the gaps between slits.
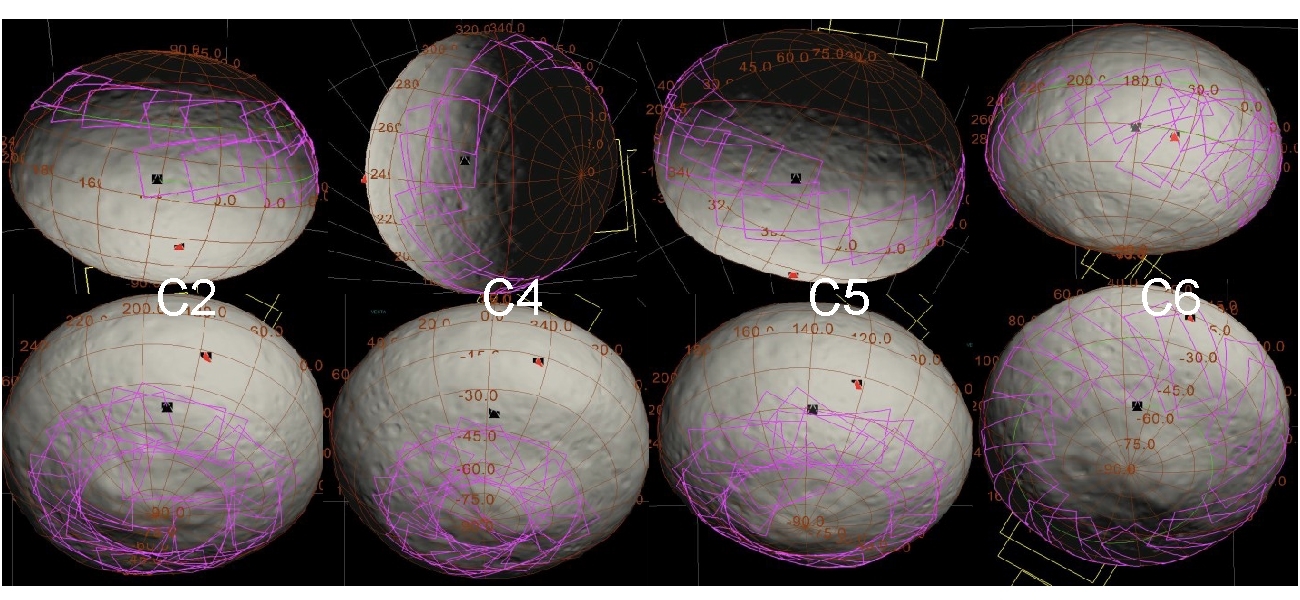
During orbits 2 and orbits 4-7 the VIR instrument uses its scan mirror to acquire cubes in the northern and southern hemisphere where the slit orientation is not well suited to pushbroom observations. Each set of VIR cubes covers at least a full Vesta rotation in order to completely cover the objective latitude band. Figure 4-12 shows the cube coverage for all orbits except number C7, which repeats the northern cubes from orbit C2. The purple footprints show the equivalent of the total VIR scan mirror extent during the cube acquisition. In reality, the VIR observations are broken into smaller cubes so that the integration time can be adjusted for phase angle. In orbit C2, cubes are acquired beginning at the dark to lit terminator (red line) and continue for slightly more than a Vesta rotation. There is a day-side downlink to discharge VIR memory and then cubes are obtained in the southern hemisphere. This pattern is repeated in orbit C4, with the cubes shifted slightly south relative to orbit C2. Orbit C5 continues the southerly progression of the northern hemisphere cubes while resampling the same southern latitude band as orbit number C2. Orbits C5 and C6 cover the pushbroom latitudes using the scan mirror cube technique. In orbit C6, there are two additional cubes take at the south pole (not shown) to provide redundancy with the southernmost cubes in orbit C4.
Figure 4-12. VIR cubes in Survey orbits C2, C4, C5, and C6.
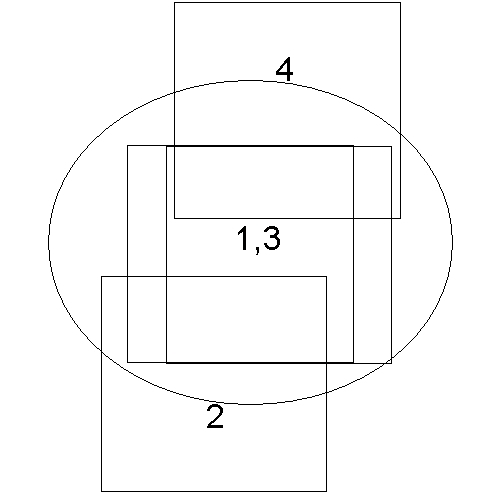
The Framing Camera acquires more than 2800 images during the Survey orbit providing global coverage of the surface and limbs at a resolution of 260-280 meters/pixels. At all times when VIR is acquiring data, the FC is imaging Vesta in order to provide context images. Full sets of color images are acquired when the spacecraft is pointed at nadir or near nadir during the VIR pushbroom observations and at the center time of most of the VIR cubes. Color images are not acquired during all VIR cubes in order to preserve the filter wheel life for use later in the mission. During orbits C1 and C3, the FC acquires 1x3 south polar mosaics as shown in Figure 4-13.
Figure 4-13. FC 1x3 mosaics in the Survey orbits.
The central nadir image station is sampled twice per mosaic in order to maximize surface coverage and longitude resolution. Equatorial mosaics are acquired during the late approach and in orbit C4 using the same 1x3 mosaic strategy.
During every orbit, 20 limb images are acquired for optical navigation. Additional dedicated limb imaging observations are planned for orbits C2 (equator), C3 (north), C5 (south), and twice in C6 (north, equator). Ride-along imaging during some of the VIR cube observations will provide additional limb coverage. There are also nadir imaging observations that are not associated with VIR activities in orbits C1 (north), C2 (south pole), C5 (north), C6 (south), and C7 (equator). The dedicated south polar and equatorial mosaics when combined with the VIR ride-along imaging and other imaging of opportunity provide excellent global coverage of entire illuminated surface of Vesta across the full range of phase angles. Figure 4-14 shows the redundancy of the planned global coverage of the surface in several phase angle bins. The color indicates the number of images in each 1 degree Lat/Lon bin (up to 5). Note that since the Survey orbit has a beta of 10 degrees, there are no data at phase angles less than ten degrees.
Figure 4-14. Expected FC global coverage versus phase angle during Survey.
Each instrument will flush their buffers into the spacecraft DRAM Virtual Recorders (VRs) assigned to that instrument. The instrument data storage allocations in Survey are 4.76 Gb for VIR (VR4), 0.73 Gb for FC (VR8), 0.51 Gb for OpNav (VR10), and 0.25 Gb for GRaND (VR5). Since VIR is prime in the Survey orbit, it was given the largest VR allocation. GRaND acquires data at the cruise science rate, which is more than adequate for this altitude. Given the small size of the GRaND and spacecraft engineering VRs, these recorders must be emptied twice per orbit at the beginning and end of each dark-side pass to prevent overflow and data loss. The Framing Camera data are mostly stored in instrument memory during the day-side data acquisition and then are threaded through the small VR by managing the flow of data on the 1553 bus interface to throttle back the flow of data during downlink periods. The bus interface is assigned to the FC until the VR fills (~50%), and then directed to VIR until the VR nearly empties (~10%). At the planning level, care must be taken not to fill the Framing Camera VR too much in order to guard against downlink disruptions (station hand-over, etc.) while data are draining from the FC to the VR during the downlink. At the same time, given the expectation that the assumed compression ratio (1.8:1) is quite conservative, the plan should not create periods where there are no data in the VR during downlinks. While VIR also needs to dump data from the instrument to the spacecraft while VIR data are being played back, the large VR allocation greatly simplifies the modeling of the data flow. All data acquired during the Survey orbit will be returned during the Survey orbit; transfer to HAMO-1 will begin with empty VRs. Data acquisition during Survey orbit seven is terminated near the dayside equator in order to begin the downlink required to drain the VRs before the orbit transfer begins.
The data volume available for downlink from the spacecraft during the Survey orbit is not as limited as the other Vesta orbit phases. The VIR science data consumes the majority of the downlink resources with 47% of the data budget while FC images take another 40%. GRaND, OpNav, engineering telemetry and margin consume the remaining 13% of the data budget. The data budget assumes compression ratios of 1.8:1 for the FC and VIR, which is believed to be quite conservative, at least for the FC. GRaND will be on and collecting data for the majority of the Vesta and Ceres phases. It will return a small fraction of the data volume of the optical instruments.
The Survey orbit plan is designed to be relatively flexible with respect to probable large pointing and trajectory errors. The gravity field of Vesta may still be quite uncertain at the time that Dawn arrives in the Survey orbit. While the current design is for an orbit period of ~68 hours, the actual orbit period could be between 64 and 72 hours. The Survey orbit plan allows for up to 45 minutes of along-track error without needing to make an ephemeris update. Orbit update margin of 45 minutes is included on both sides of each turn between Vesta and the Earth in order to accommodate these errors. In addition, there are at least four hours of downlink margin on each night side pass to allow for orbit period adjustments. The use of a very conservative compression ratio for the images adds margin to the downlink as well. Some of this margin must be used to bridge DSN station viewperiod gaps and the one-way to two-way glitch but the remainder is available for orbit period adjustments. In addition to these other actions, the prime VIR data are returned before the FC data, and the FC data are prioritized before they are sent to the spacecraft recorders. Should there be a loss of downlink duration that is not covered by the margin available, the data that are lost should be the lowest priority FC images.
Three conditions must be met before the science operations team can recommend proceeding to HAMO-1. The data from the first Survey orbit must be processed and validated to verify that the data is of expected quality, using the best calibration parameters available. The data from the second Survey orbit and part of the third orbit must be received on the ground and their integrity verified. It must be verified that the remaining data from the third Survey orbit is stored in the instrument and spacecraft DRAM memory buffers. Once these conditions are met, the decision can be made to begin transfer to HAMO-1 on schedule even though the remaining Survey data will be played back and additional Survey orbits are still planned.
The orbit transfer period is dedicated to the thrusting required to change the orbit from Survey to HAMO-1. Because the VRs are sized for science, the spacecraft will need to downlink spacecraft engineering and GRaND data at least once every 48 hours during the transfer period. The downlink provides the NAV Team with critical tracking data that are used to determine the upcoming thrust arcs. In addition, there will be OpNav imaging activities with nadir pointing every few days. The OpNav activities will precede scheduled downlink periods in order to minimize the impact to the thrust duty cycle and to make the data immediately available for navigation analysis. Towards the end of the orbit transfer, the NAV Team requires long quiet periods to access the trajectory. During these quiet periods greater than 24 hours in duration, Science is allowed to acquire "bonus science" data. A single bonus science sequence will be developed for this transfer period to be reused whenever there is a quiet period of sufficient duration. It is expected that there will be 2-3 bonus science observations during the transfer to HAMO. These will all be nadir-pointed and will be at nearly the HAMO orbit altitude.
The High Altitude Mapping Orbit 1 (HAMO-1) is primarily used to create global FC maps of the lit surface in of the body in multiple filters from a nadir attitude, and at least two maps from two different off-nadir viewing angles, in the clear filter only. The Level-1 requirement is for 80% global coverage in 3 filters between HAMO-1 and HAMO-2. The HAMO-1 plan is to acquire images of the entire lit surface in the clear plus seven filters. The FC clear maps from different viewing angles (nadir plus at least two off-nadir) will be used to create a topographic model, using also limb images, via stereophotogrammetry and photoclinometry. The off-nadir coverage should be at angles of 10-20o from the surface normal.
VIR will also collect at least 5000 frames as part of the Level-1 requirements, but this will be far short of global coverage. The VIR frames will be collected concurrently with the FC data if possible. The VIR data will be collected to sample the spectral variability at smaller scales than the global Survey map, and to build up high-resolution coverage of areas of interest. The VIR data will be taken at nadir attitude; however, VIR data may also be acquired at off- nadir viewing angles, for which the scan mirror may be used to tailor the viewing angle when the geometry is favorable.
The Vesta HAMO-1 reference orbit is dawn_ref_110924-111025_100526_isb_hamo.bsp.
This trajectory is 30 days long and does not reflect the mission change that
increased HAMO-1 from 60 to 63 orbits. Preliminary modeling of the data
acquisition in HAMO-1 at various altitudes has shown that it takes 10 orbits and
~5 days to create a FC map of all longitudes at the planned
950 km mean
orbit radius. Each complete mapping of Vesta during HAMO-1 is called a cycle.
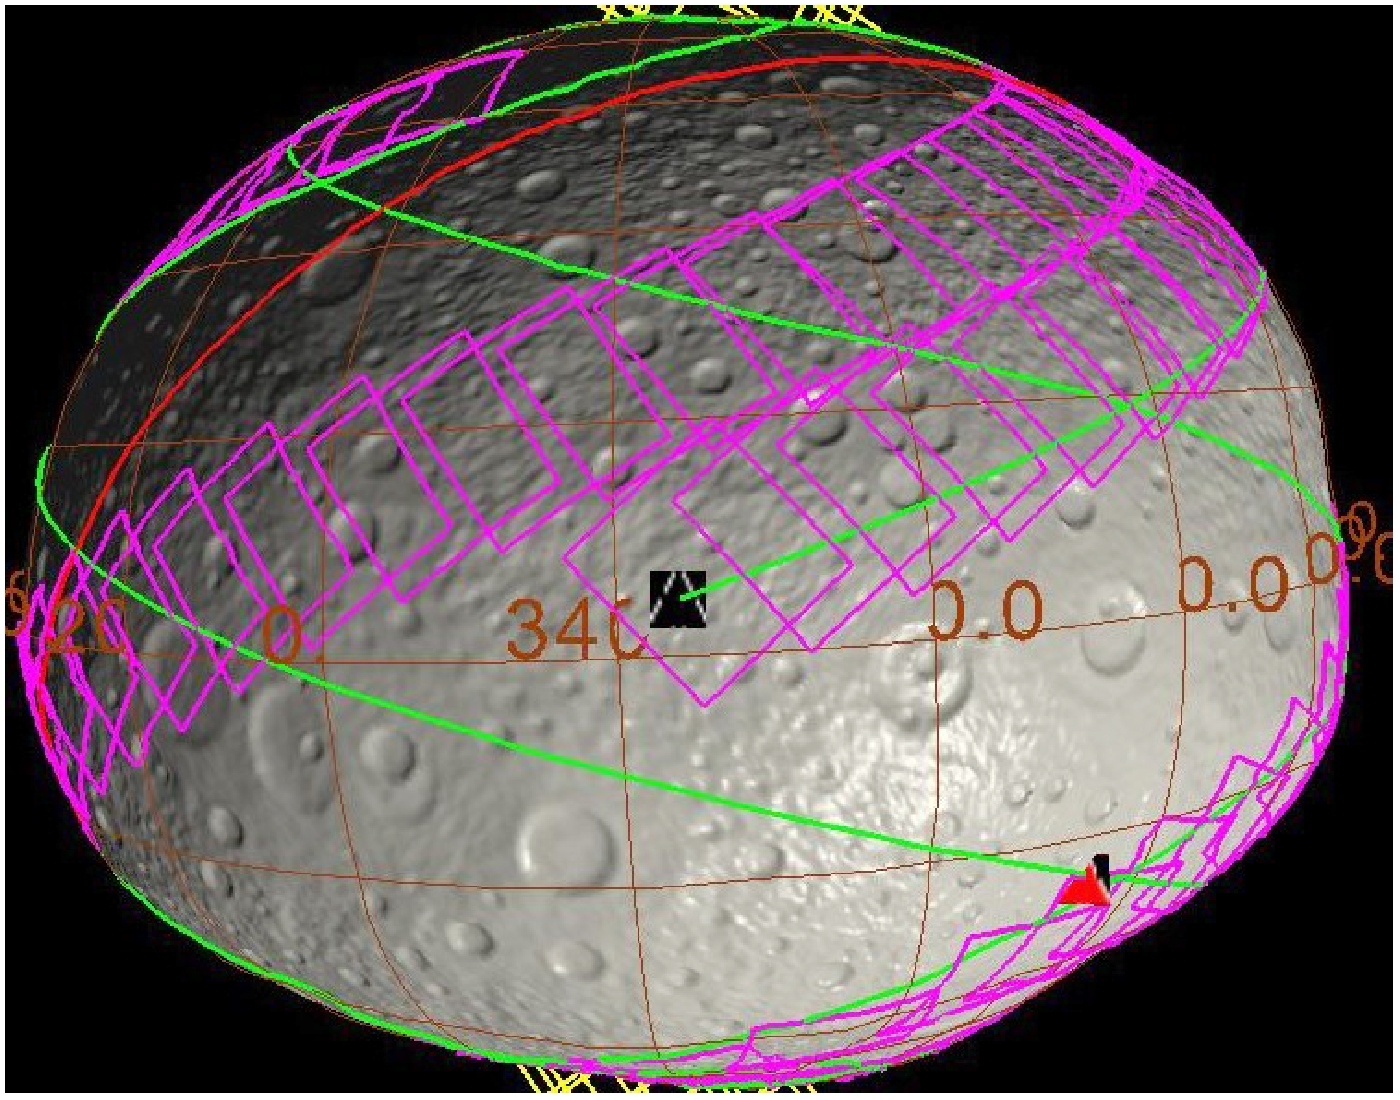
Figure 4-15 is a Science Opportunity Analyzer (SOA) plot illustrating Vesta
HAMO-1 mapping using the Framing Camera while nadir-pointed in Cycle 1. Camera
footprints on Vesta are shown in purple on top of a false surface texture map.
The terminator is shown in red and the ground tracks are shown in green. The
orbit is polar. The apparent tilt of the orbit is again an artifact of Vesta�s
rapid rotation. Note that ground tracks from successive orbits are not
adjacent. Instead they form a petal pattern that fills in over the ten-orbit
cycle. The footprints at the top and bottom of Vesta are from other petals.
The black triangle indicates the subspacecraft point and the red triangle gives
the sub-solar point.
Figure 4-15. Ground Track and FC mages during four Vesta HAMO-1 orbits
The HAMO-1 plan is the most constrained of any of the orbit sub-phases. It is constrained by the limitations of the data downlink volume, the need for systematic global coverage, and the need for resiliency to interruptions in the plan.
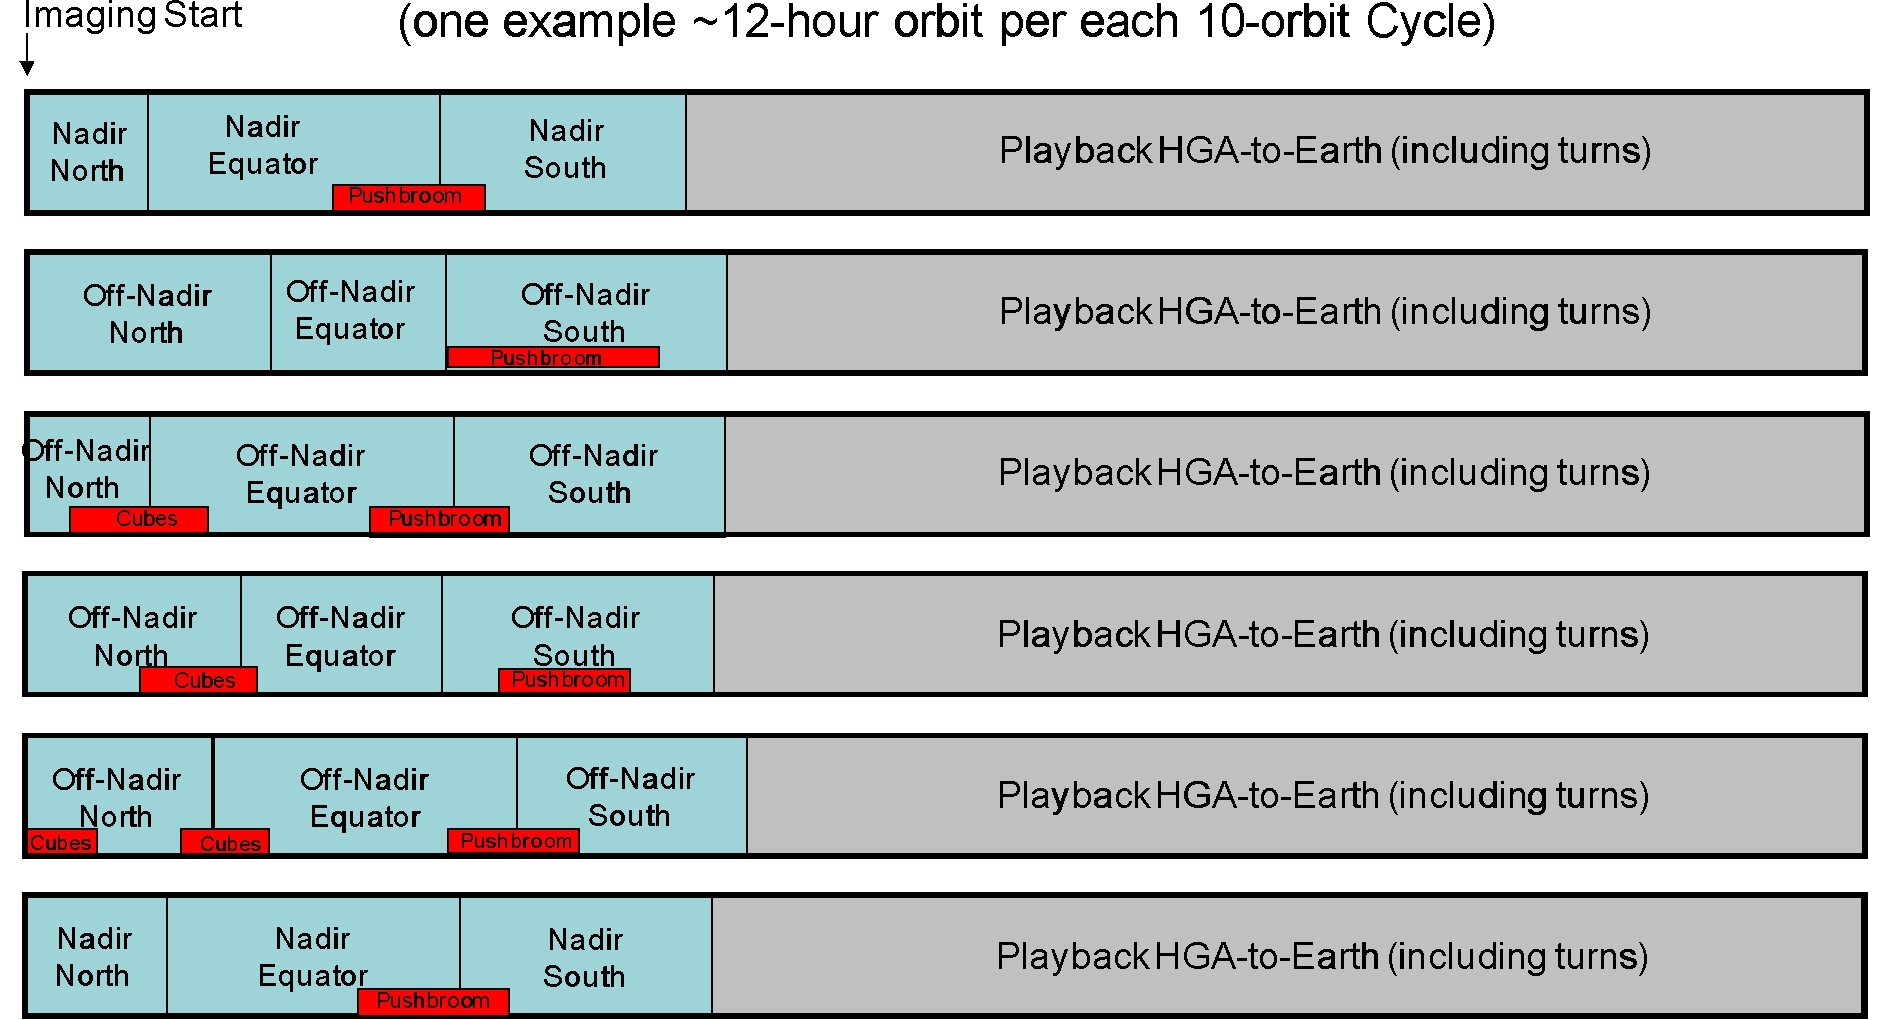
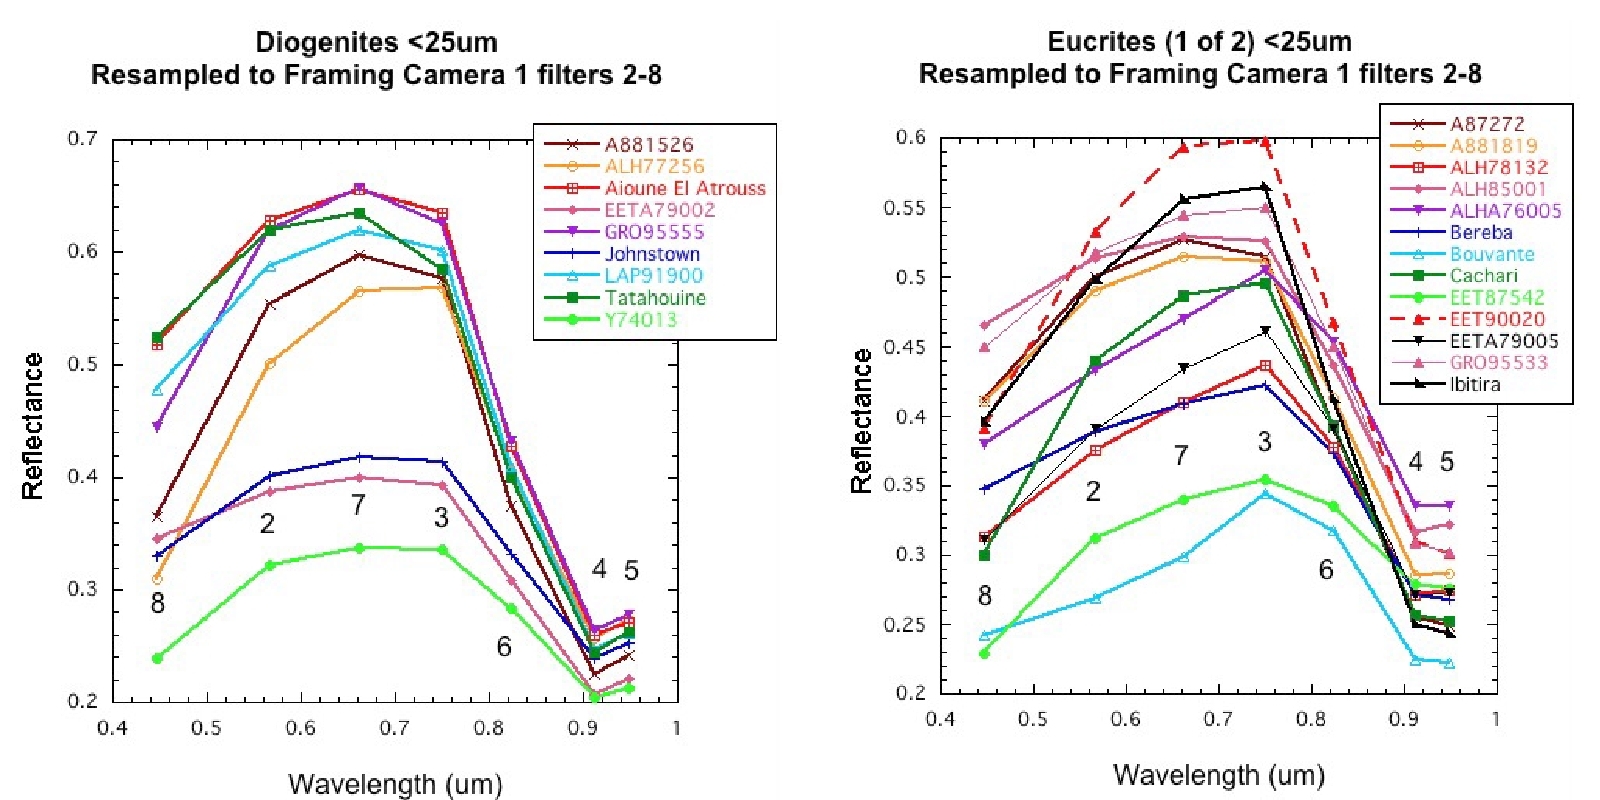
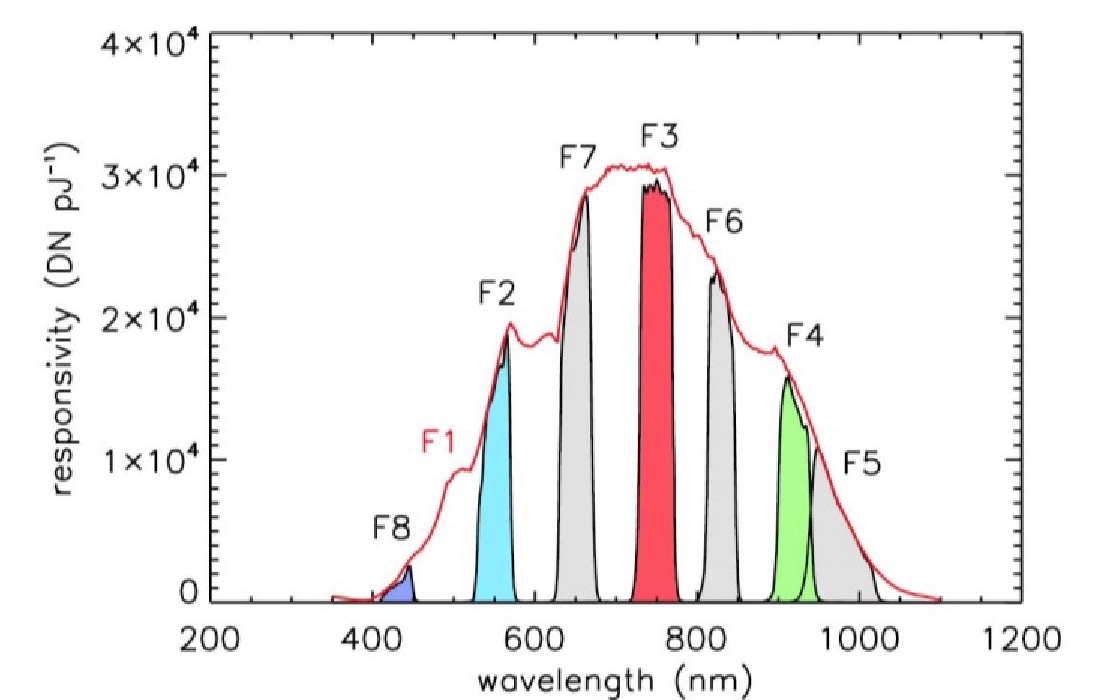
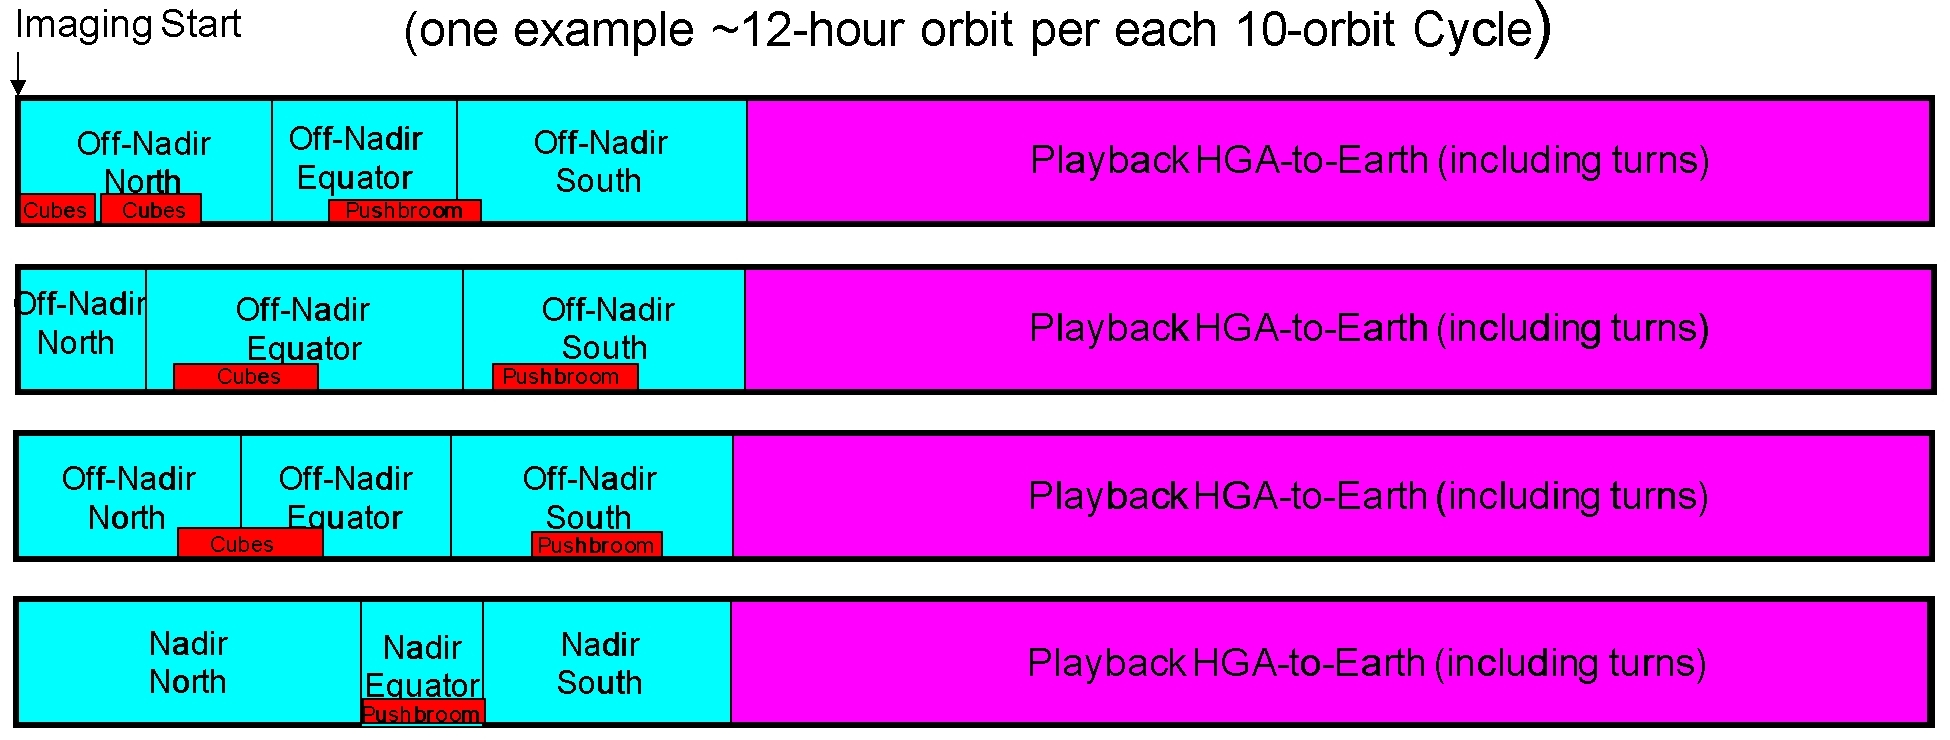
A high-level timeline of the original plan is shown in Figure 4-16. The 30 days of HAMO-1 mapping are split into 6 cycles, each ten orbits and ~5 days in length. The first and last cycles are acquired at nadir and include color imaging. There is insufficient downlink and onboard memory capacity to store and return all of the camera data with lossless compression. The plan is to acquire clear plus 4 filters with lossless compression (440/750/920/980 nm - F8, F3, F4, F5 for petrology/weathering) and then use lossy (5.4:1) compression images for the remaining three filters (550, 650, 820 nm - F2, F7, F6) in the nadir cycles. The camera image cadence varies with latitude in each orbit and the VIR acquires scan mirror cubes in the north and pushbroom data in the south. Following Cycle 1, there are two orbits dedicated to downlink. These orbits have been added to the plan to offset some of the impact of the long occultation intervals during the playback periods and to return most of the Cycle 1 color images to the ground. This provides a safeguard against an anomaly that would power off the instruments losing any data in memory at that time. Cycle 6 is also at nadir pointing and includes color images that are losslessly compressed in four filters (550/650/750/920 nm - F2, F7, F3, F4 for lithology/mineralogy) with the other three having lossy compression. Note that the 820nm filter is not acquired with lossless compression in this strategy. Figure 4-17 shows the spectra of Diogenites and Eucrites resampled to the spectral peaks of the various Framing Camera color filters. The selection of filters acquired during Cycle 1 can be used to define the amplitude of the central peak and the depth of the absorption band near 900 nm. During Cycle 6, the width and slopes surrounding the central peak are resolved.
Figure 4-16. HAMO-1 Mapping strategy schematic.
Figure 4-17. Diogenite and Eucrite spectra resampled to the FC filters.
Clear filter images are acquired at a different off-nadir angle in each of Cycles 2-5 by using the Ahead-Cross-Nadir (ACN) pointing capability of the spacecraft. The ACN coordinate system has the A direction positive along the spacecraft velocity vector, the C direction is orthogonal to the velocity vector positive such that A x C = N where N is the nadir direction. A single off-nadir attitude is selected for acquiring data in each cycle, and those angles are commanded as positive or negative angles in the direction of the A and/or C axes. The HAMO-1 and HAMO-2 off-nadir angles are selected to optimize Stereo analysis while still supporting SPC. The SPC method is able to combine HAMO-1 and HAMO-2 observations that are acquired with different illumination conditions which is non-trivial for Stereo analysis. Table 4-8 gives the ACN angle offsets for each of the six HAMO-1 cycles. Nadir pointing is specified as ACN ahead+0 °, cross+0 °. VIR acquires high spectral and spatial resolution data at the camera defined pointing throughout HAMO-1.
================================================================================================
Cycle   Pointing         FC Science Objective              VIR Science Objective
================================================================================================

  1     Nadir            Clear and color filter            Pushbroom observations
                         imaging for petrology and         from 15°-40° South
                         weathering

  2     Ahead+8°,       Clear filter SPC and              Pushbroom observations
        Cross+5°        Stereo topography -               from 10°-65° South
        (Cross+2°)      Cross angle is reduced
                         for the "south" mapping segment.

  3     Ahead-6°        Clear filter Stereo               Terminator IR cubes, Northern
        Cross+2°        and SPC topography                hemisphere cubes, Pushbroom
                                                           observations from 30°-50° South

  4     Ahead+5°        Clear filter Stereo               Northern hemisphere cubes,
                         topography                        pushbroom observations from 15°-45° South

  5     Cross-5°        Clear filter SPC topography       Terminator IR cubes, pushbroom
                                                           observations from 5°-25° South

  6     Nadir            Clear and color filter            Pushbroom observations from 15°-40° South
                         imaging for  lithology
                         and mineralogy
================================================================================================
Table 4-8. HAMO-1 Pointing and Objectives for Each Cycle.
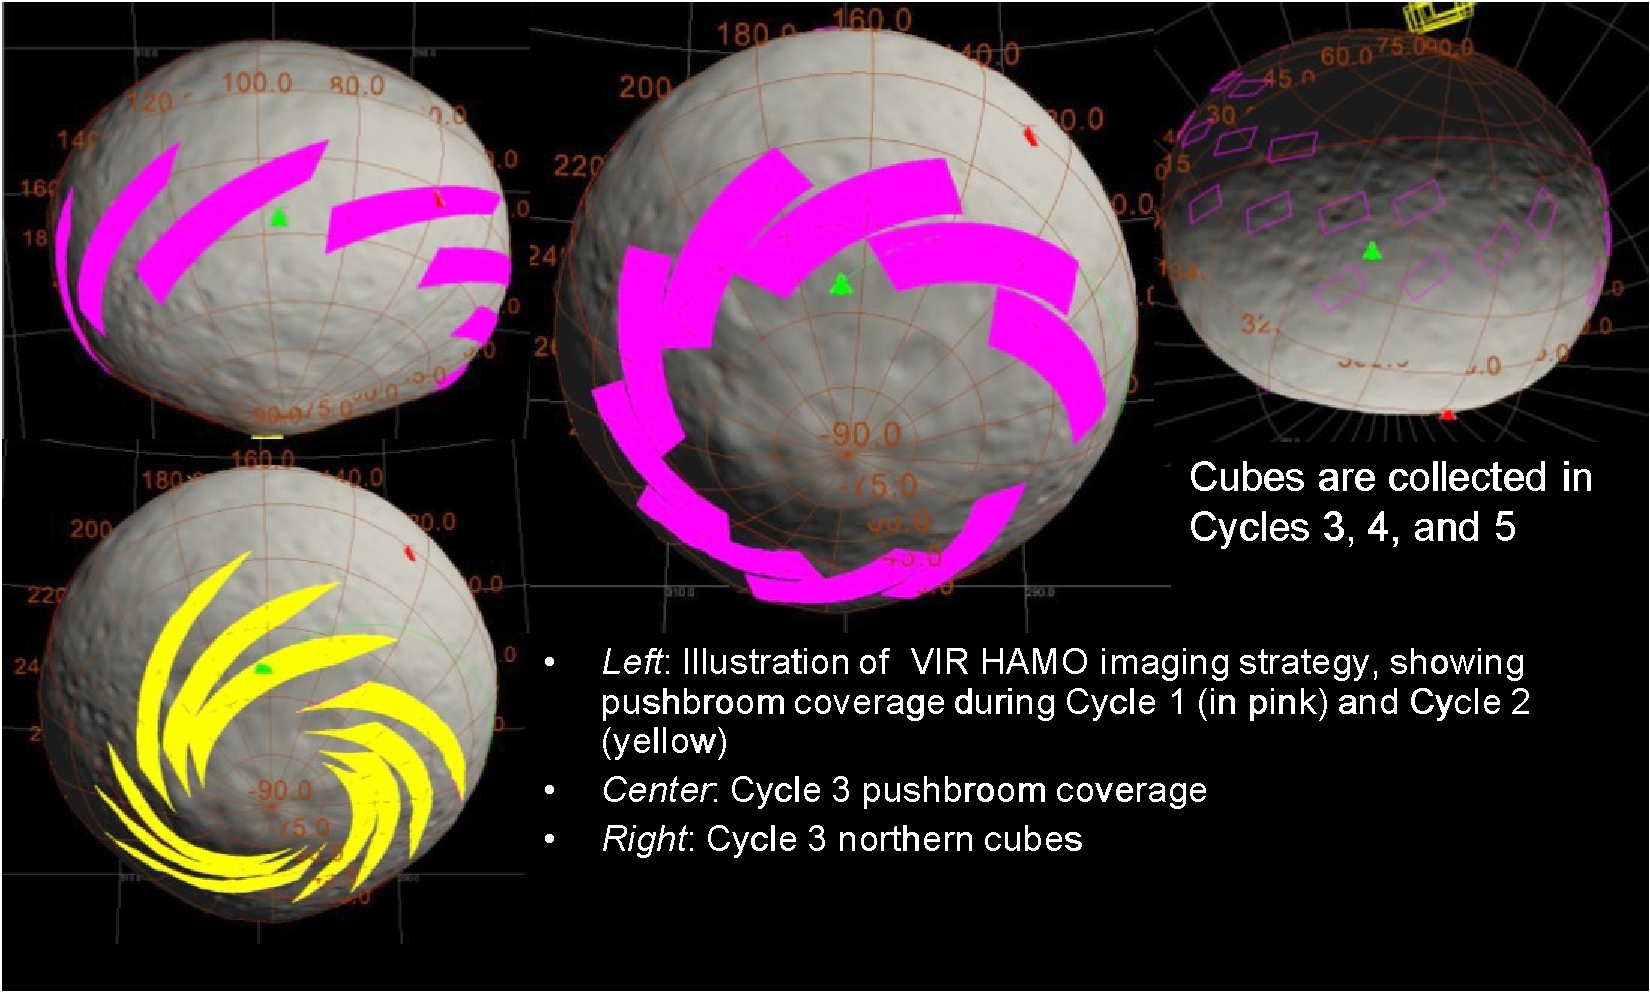
Figure 4-18. A selection of planned VIR HAMO-1 observations.
There is insufficient time and bandwidth available to completely map Vesta using VIR during the HAMO-1 sub-phase. The goal of the VIR investigation during HAMO-1 is to sample a portion of the surface from the terminator to as far south as the available downlink and illumination conditions allow with the bulk of the coverage focused on the southern crater walls and floor. In every cycle, VIR acquires data in pushbroom fashion in the southern hemisphere. The variety of different spacecraft orientations required for the camera mapping during HAMO-1 allows the VIR instrument to effectively use the pushbroom mode over a wide range of southern latitudes (~5° -65° South). During orbits C3 and C5 VIR will acquire a set of small IR-only scan mirror cubes near the terminator and during orbits C3 and C4 VIR will acquire larger scan mirror cubes using both the visual and IR detectors. The planned VIR observations are summarized in Table 4-8 and the southern pushbroom observations are shown in Figure 4-18.
The instruments will flush their buffers into the spacecraft DRAM VRs assigned to each instrument. The instrument data storage allocations in HAMO-1 are 2.72 Gb for VIR, 2.06 Gb FC, 1.0 Gb for OpNav and high priority images, and 0.25 Gb for GRaND. Most of the clear filter data are returned through the OpNav VR, while the color filter data are returned through the FC recorder. Losslessly compressed images are given high downlink priority than the lossy compressed images. For purposes of modeling expected DRAM usage, the lossless compression ratio is assumed to be 1.8:1 for both VIR and FC. The FC instrument will compress images to the maximum lossless compression ratio, however, if the lossless ratio is less than 1.8:1 the compression becomes lossy preserving the minimum compression ratio. VIR compression is always lossless with the minimum ratio being 1:1.
The HAMO-1 orbit occurs at the maximum of the occultation season as shown in Figure 4-19. The downlink plan must account for occultation durations of 55 +/-5 minutes where the 3 σ uncertainty is primarily attributable to the propagation of the along track error over the two cycle duration of a sequence. In addition, there is a view period gap between the Madrid and Goldstone stations that is roughly 20 minutes in duration during the HAMO-1 time period. Since there are two playback intervals each day, every other playback period is likely to include a view period gap. The HAMO-1 data storage plan accommodates 80 minutes of known downlink disruption in every orbit with an additional 15 minutes of margin for one-way to two-way transitions and other short duration outages. Since the phasing of the downlink passes will not be known until only a few weeks before the start of HAMO, the gap associated with the view period gap has been distributed over the two passes each day for planning purposes.
As previously mentioned, there are two orbits dedicated to downlink following Cycle 1 and one orbit of downlink following Cycle 6, prior to the start of the transfer to LAMO. The return of data following Cycle 1 is necessary in order to be able to determine if the transition to LAMO criteria have been met on the time frame required to build the transfer to LAMO sequences. There is an added benefit of securing the color filter data on the ground to protect against a spacecraft anomaly, however, the real benefactor of the downlink orbits is VIR. The offloading of Cycle 1 data allows the VIR instrument to collect and return data in Cycles 2-5 that would not be possible if the camera data were still onboard. The additional downlink orbit that follows Cycle 6 is insufficient to return all of the data acquired during the cycle. Following this downlink pass, all of the data have been drained from VIR and FC into the VR so that the instruments can be powered off and the data are protected from spacecraft safing events. However, both VRs are filled to more than 60% capacity at the star of the transfer. The remaining data are returned during the transfer during the routine engineering and OpNav playback periods.
Figure 4-19. HAMO-1 occultation durations vs. time for various pole locations.
The HAMO-1 orbit is critical for achieving global mapping of the surface of Vesta with the Framing Camera, which constitutes the geologic context for the investigations, and provides the basis for the topography investigation. VIR coverage will focus on areas of high interest, such as the south polar crater. Like the Survey orbit, the HAMO-1 plan contains functional redundancy. The Level-1 requirement of obtaining global coverage in the three color filters plus clear filter is met or nearly met in Cycle 1. Global coverage in two off-nadir directions is complete by the end of Cycle 3. Meeting the Level-1 topography requirement is dependent on the completion of at least three cycles of HAMO-1 prior to the transfer to LAMO or that there was a reasonable expectation of completing the requirements in HAMO-2. The Level-1 topography requirement of mapping 80% of the surface cannot be met by using only data from HAMO-1 because not enough of the surface is sufficiently illuminated to perform either the Stereo or SPC analysis to generate topography at the required height accuracy. The HAMO-2 sub-phase was included in the Vesta plan to address this inadequacy. The remaining cycles provide redundant coverage that allows us to improve our ability to meet or exceed our Level-1 requirements.
Like the transfer to HAMO-1, the orbit transfer period is dedicated to the thrusting required to reduce the orbit altitude and change the orbit plane from HAMO-1 to LAMO. Because the VRs are sized for science, the spacecraft will need to downlink spacecraft engineering and GRaND data at least once every 48 hours during the transfer period. The downlink provides the NAV Team with critical tracking data that are used to determine the upcoming thrust arcs. In addition, there will OpNav imaging activities with nadir pointing every few days. The OpNav activities will precede scheduled downlink periods in order to minimize the impact to the thrust duty cycle and to ensure the data are promptly available for use in navigational analysis. Towards the end of the orbit transfer, the NAV Team requires long quiet periods to access the state of the spacecraft. During these quiet periods greater than 24 hours in duration, Science is allowed to acquire "bonus science" data. A single bonus science sequence will be developed and reused whenever there is a quiet period of sufficient duration. It is expected that there will be 2-3 bonus science observations during the transfer to LAMO. These will all be nadir-pointed and will be at nearly the LAMO orbit altitude (orbit period).
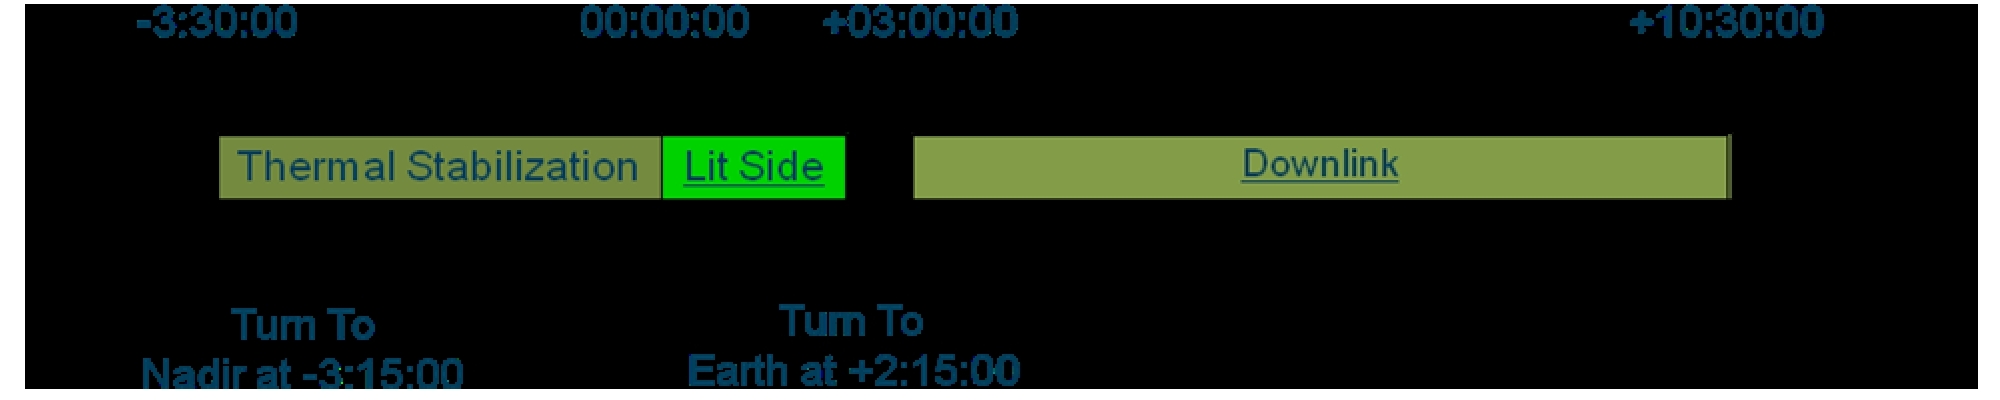
Figure 4-20. Transfer to LAMO bonus science schematic.
Figure 4-20 shows the basic schematic of the transfer to LAMO bonus science activity. Bonus science activities begin and end with the HGA on Earth attitude. The activity begins 3h30 minutes before the predicted dark to lit terminator crossing with VIR powering on. Fifteen minutes later, the spacecraft turns to nadir to begin thermal stabilization during the VIR cool down. The FC powers on, or powers on the FEE if the instrument power is already on so that it too can reach thermal equilibrium before imaging begins. Both instruments acquire 2h15m of nadir-pointed data beginning at or near the dark to lit terminator crossing during the lit side pass. The framing camera can acquire up to 140 images and VIR can acquire up to 1500 total frames as desired. It is anticipated that the instruments will use these opportunities to test out exposure durations and assess the impact of smear on the LAMO data. All data acquired during the lit side pass will be returned during the downlink pass that follows data acquisition.
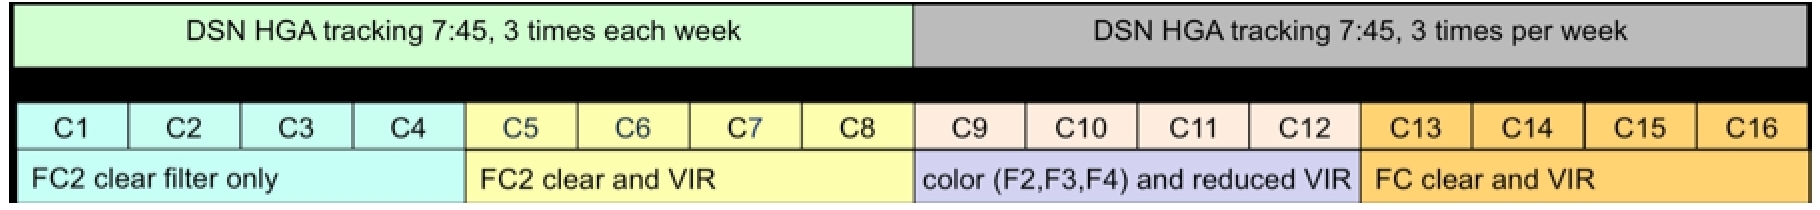
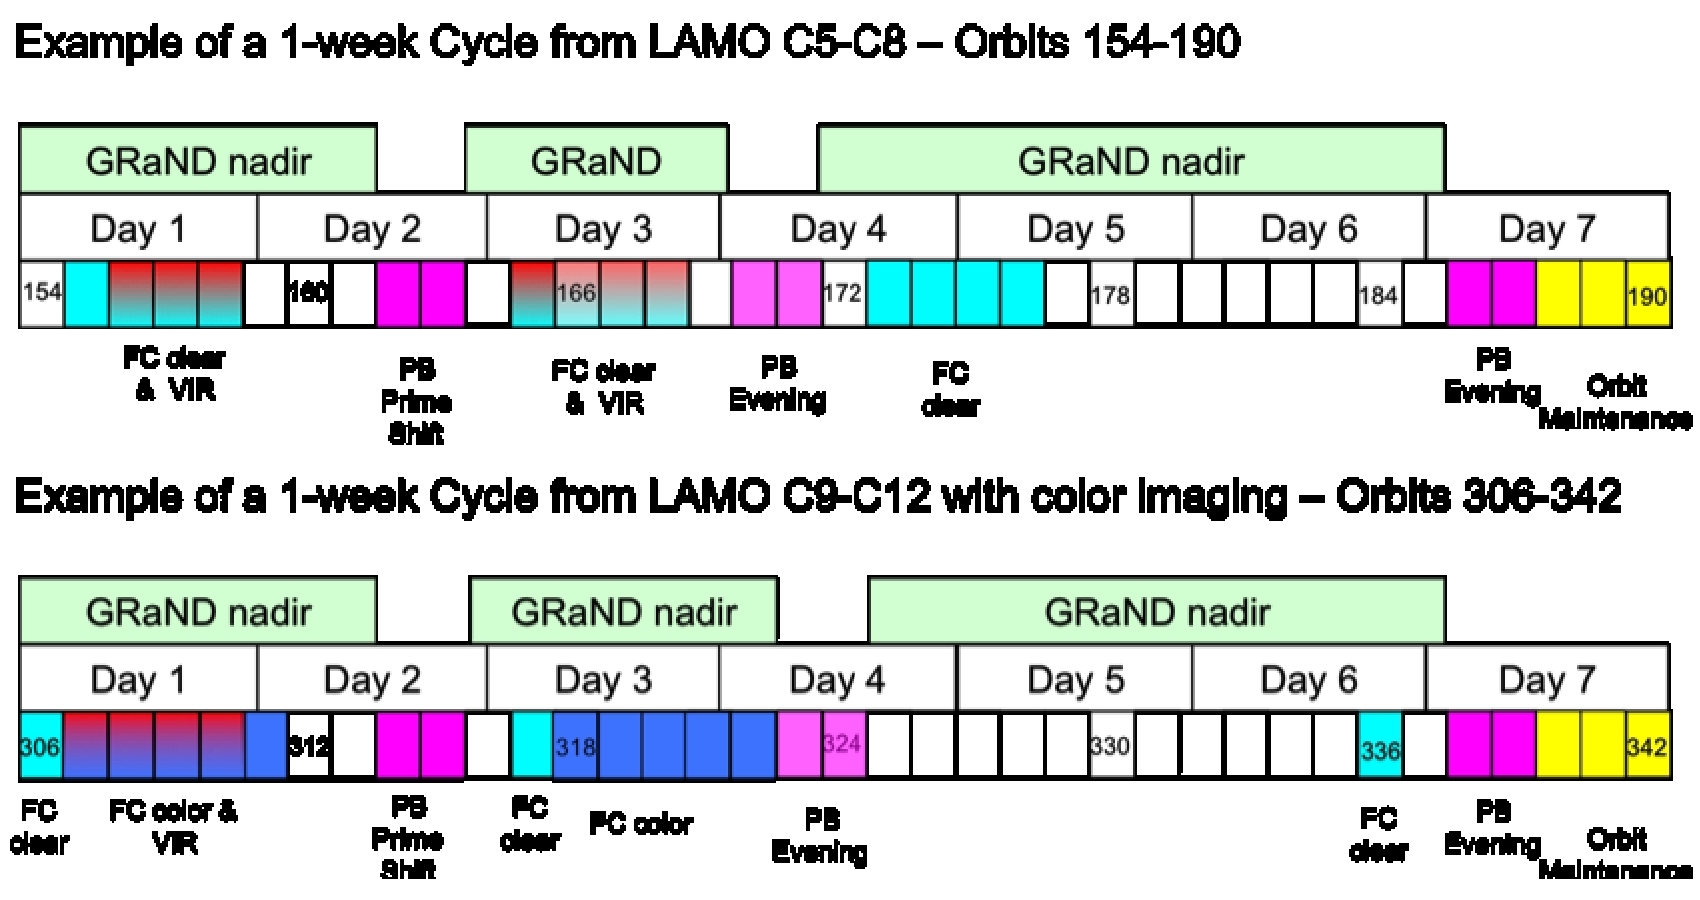
The purpose of LAMO is to obtain spatially resolved neutron and gamma ray spectra of the asteroid and global tracking coverage to determine the gravity field. The strategy is to be nadir-pointed as much as possible to maximize GRaND data accumulation. Gravity data are obtained during the HGA tracking passes that are used to return science and engineering data. In addition, the Gravity Team has determined that they can make use of LGA tracking data while obtained while the spacecraft is nadir-pointed during the early portion of the LAMO orbit when the Sun-Earth-Probe angle is greater than 20°. The project is requesting one eight-hour, 34m LGA pass every day for at least the first eight weeks in addition to the HGA pass every other day. The goal in LAMO is to achieve a minimum of 1350 hours of GRaND data at nadir and on the order of fifty quiet gravity data tracks. The beta angle of the LAMO orbit is 45°.
The Vesta LAMO reference orbit is dawn_ref_111203-120408_100601_isb_lamo.bsp. A timeline for a 70-day LAMO orbit plus a possible 40-day extension (the entirety of the Vesta operations margin) is shown in Figure 4-21. GRaND acquires prime data whenever the spacecraft is nadir-pointed. In LAMO each week is called a cycle. During the first eight cycles, the FC acquires clear filter images of the surface while nadir and Gravity Science acquires ~7h45m of data during the tracking passes. During the next four cycles, the FC acquires color images and OpNav data. VIR acquires data in pushbroom mode throughout LAMO,
Figure 4-21. Vesta LAMO 70-day timeline (with extension).
Figure 4-22. Vesta LAMO repeating 1-week timelines.
but the number of frames per cycle decreases in the cycles with color imaging. The nominal LAMO duration is 70 days (10 cycles) but any of the 40 days of operational margin remaining at the end of LAMO will be used to extend the stay time. Figure 4.22 shows selected 1-cycle expansions of LAMO activities. During the first eight cycles (top) when the primary gravity data are being acquired there are ride-along clear filter FC images acquired during roughly one third of the orbits (cyan) with pushbroom VIR data (red) acquired in about a fifth of the orbits. At the end of each cycle there is a twelve-hour orbit maintenance window (yellow). During cycles 8-12 when the FC2 is acquiring color imaging, the number of VIR orbits is reduced. One orbit of clear filter OpNav images is acquired prior to each downlink pass. Color FC images from filter F2, F3, and F4 (blue) are acquired in ten orbits per cycle and VIR data are acquired in four orbits per cycle.
Figure 4-23. Vesta LAMO downlink pass and gravity tracking.
The LAMO downlink and gravity data acquisition strategy is dictated by the presence and duration of radio occultations. In each orbit there is an occultation that lasts for up to thirty-five minutes. Figure 4-23 shows the structure of a typical HGA pass during LAMO Cycles 1-8. Downlink passes are timed to begin just after the end of the occultation (inner red arc). For the first fifty minutes of the pass, baseline tracking data are acquired (inner cyan arc), followed by a momentum wheel desaturation of up to thirty minutes (orange arc) followed by a spacecraft recovery period of at least ten minutes (cyan). The gravity pass (green middle circle) begins following the recovery period and continues for 6h5m, interrupted by another occultation, and ending just before a third occultation would begin.
Figure 4-24 shows the planned framing camera clear filter imaging coverage obtained during the nominal 70 days of LAMO where the solar incidence angle is less than 80 °. The color indicates the pixel resolution, which varies between 15-25 meters/pixel due to a combination of the irregular shape of Vesta and the eccentricity of the orbit. The numbers in the color bar give the
Figure 4-24. Vesta LAMO clear filter image coverage (incidence < 80°).
Figure 4-25. Vesta LAMO color filter (F2, F3, F4) image coverage (incidence < 80°).
percentage of total surface coverage with at least the resolution indicated. In order to obtain the surface coverage shown in Figure 4-24, the image compression ratio has been increased 3.8:1. This ratio is likely to be lossy, however, the images should remain useful for age dating the surface.
Acquiring color filter imaging data during the LAMO phase presents several challenges. The filter wheel has a limited number of qualified movements and at least half of these must be preserved for imaging at Ceres. The large relative velocities of Vesta and Dawn make smearing an issue, particularly when the exposure times become long as is the case for many of the color filters. In order to minimize the number of filter wheel movements, only filters F2, F3, and F4 will be acquired during LAMO in alternating wheel directions (2-3-4, 4-3-2). The color imaging objectives and strategy varies during different LAMO cycles. In the first two color imaging cycles (9,10), the imaging passes begin at the dark to lit terminator crossing, end near the south pole, and have a cadence of 3.5 minutes (all three filters). This strategy yields non-overlapping image footprints but provides samples over the full range of illuminated latitudes. During LAMO Cycles 11 and 12, the color filter imaging passes cover the region from the equator to the south pole but at an increased image cadence that provides image overlap for most orbits. This strategy concentrates the color imaging in the southern hemisphere as shown in Figure 4-25, which shows polar projections (left: north; right: south) of the color imaging coverage with a similar color bar as Figure 4-24.
   Filter   Smear (px)          PSF
    F1:     0.10 - 0.16         1.7
    F2:     0.87 - 1.9          0.9
    F3:     0.58 - 1.2          1.1
    F4:     2.5  - 5.3          1.0
    F5:     2.7  - 5.7          1.3
    F6:     1.3  - 2.8          0.9
    F7:     0.61 - 1.3          1.2
    F8:     8.5  - 18           2.3
Figure 4-26. FC Filter wavelength response (left) and LAMO pixel smear and point spread functions (right). F1 is a broadband (clear) filter, sensitive in the wavelength interval from 400 to 1100 nm and peaking at 700 nm.
Smearing of the color images is another issue addressed by the LAMO color imaging plan. Figure 4-26 shows the filter response function versus wavelength (left) and the expected smearing in pixels (right). Filters F2, F3, and F4 provide a wide range of wavelength separation while maintaining acceptable smearing levels. In order to acquire and return color filter images during the limited downlink passes of LAMO, the color filter data need to be compressed significantly. Color images are compressed twice, first by using an onboard 2x2 pixel binning algorithm and then compressing the binned images losslessly (1.8:1) bringing the total expected compression ratio to 7.2:1. Binning reduces the image resolution by a factor of two to 30-50 meters/pixel but this is still an increase in resolution over the HAMO color images by as much as a factor of two. Given the large expected smearing in the LAMO color filter images, binning was considered to be better solution than simply increasing the compression ratio in the raw images.
VIR data are also acquired during LAMO, but like the color imaging plan, the data are sparse and the global coverage is relatively low. Many of the LAMO spectra are acquired using only the central one quarter of the VIR slit in pushbroom fashion. The individual slits are disconnected. Figure 4-27 shows the VIR coverage planned for 12 of the 16 cycles in the extended LAMO. Each sequence shown represents two cycles of data acquisition. In this figure, the slit width is highly exaggerated, as is the degree of slit connectivity. There is no VIR coverage above 20° north latitude. Given the relatively high beta angle of the orbit (45 °) required for mission safety, the phase angles in northern hemisphere are not conducive to VIR data acquisition. Instead, the coverage is primarily in the southern hemisphere with a concentration of observations near the south pole.
Figure 4-27. Overview of VIR coverage during LAMO
The GRaND virtual recorder (VR5) size is increased to 1.0 Gb during LAMO to accommodate up to 3 days of continuous data acquisition while sampling every 70 seconds. The VIR recorder (VR4) is reduced to 2.48 Gb and the FC recorder (VR8) maintains its HAMO size of 2.06 Gb. The increase in the VR5 size is accomplished by the VR4 reduction and by reducing the OpNav recorder (VR10) back to its nominal size during science data acquisition (0.51 Gb). The instrument housekeeping recorder (VR3) is increased to 0.3 Gb taking its allocation from VR margin.
During LAMO, all of the data acquired during the first eight cycles are returned during that cycle. FC and VIR data are acquired during less than half of the orbits in LAMO because there isn't enough playback time to return any more data from these instruments without taking away time at nadir from GRaND. During the four cycles of the nominal LAMO while color images are being acquired, images accumulate in the framing camera internal memory for discharge and downlink at a later date. In general, all of the VRs will be empty once per cycle after the second playback even if there is accumulation during the week. All of the filter wheel motions available to the LAMO phase are used during the nominal LAMO phase so any additional imaging will be used to increase the clear filter surface coverage. The LAMO downlink allocations are listed in Table 4-9.
   ================================================================
   Data Source             Downlink      Requirement
                           Allocation
   ================================================================
   GRaND                   22.2%         Level 1 Science
   Optical Navigation      13.4%         S/C Health and Safety
   Engineering Data        19.4%         S/C Health and Safety
   Framing Camera          20.5%         Enhanced Science
   VIR                     24.5%         Level 1 Science
   TOTAL                  100.0
   ================================================================
Table 4-9. Vesta LAMO Data Downlink Allocations.
The current LAMO plan accommodates a thirty-five minute downlink outage for Earth occultation in every downlink pass plus five minutes of uncertainty in the timing of the occultation. LAMO occurs towards the end of the Vesta occultation season so the actual duration of the occultations will be less than the 35 minutes currently allocated as LAMO proceeds. By the end of LAMO, it is possible that there will be no occultations during the downlink passes.
At present, the NAV Team is not able to guarantee that it can predict the occultation start and end times to the planned five minute uncertainty due to the propagation of along track errors between orbit maintenance periods. The prediction uncertainty issue is currently being worked. If the NAV Team is unable to meet is +/-10 minute timing uncertainty requirement during LAMO, the amount of VIR/FC data acquired will need to be reduced.
If the LAMO phase is extended, the Science Team will have to evaluate the quality of the VIR data and determine whether or not to continue acquiring VIR data in the extended LAMO phase or whether the limited downlink would be better allocated to improving the FC clear filter coverage in order to improve the ability to age date Vesta's surface.
As with all orbit transfer phases, the orbit transfer period is dedicated to the thrusting required to change the orbit from LAMO to HAMO-2. Because the VRs are sized for science, the spacecraft will need to downlink spacecraft engineering and GRaND data at least once every 48 hours during the transfer period. The downlink provides the NAV Team with critical tracking data that are used to determine the upcoming thrust arcs. There will be no OpNav activities during the Transfer to HAMO-2 sub-phase. Towards the end of the orbit transfer, the NAV Team requires long quiet periods to access the state of the spacecraft. During these quiet periods greater than 24 hours in duration, Science is allowed to acquire "bonus science" data. A single bonus science sequence may be developed and reused whenever there is a quiet period of sufficient duration. Given that any bonus science opportunities will occur near the HAMO-2 orbit altitude, the bonus science sequence developed for the Survey to HAMO-1 orbit can be repurposed for this transfer. It is likely that there will be 2-3 bonus science observations during the transfer to HAMO-2
The High Altitude Mapping Orbit 2 (HAMO-2) is primarily used to complete global FC maps of the lit surface in of the body in multiple filters from a nadir attitude, and maps from three different off-nadir viewing angles, in the clear filter only. The Level-1 requirement is for 80% global coverage in 3 filters. Since we will have already mapped the surface south of 30° north in all of the available color filters, we plan to acquire color images only in the northern hemisphere. The FC clear maps from different viewing angles will be used to complete the topographic model, via stereophotogrammetry and photoclinometry. The HAMO-2 orbit is at the same altitude as HAMO-1 but the orbit beta angle is increased from 30° to 45°. The off-nadir angles have been selected to optimize stereophotogrammetry since this technique will not be able to utilize the previously collected images while the change in beta angle improves the overall photoclinometry coverage.
VIR will also collect data during HAMO-2 but even when combined with the HAMO-1 data VIR will fall short of global coverage. The VIR frames will be collected concurrently with the FC data. The VIR data will be collected to sample the spectral variability at smaller scales than the global Survey map, and to build up high-resolution coverage of areas of interest. VIR data will be taken at all spacecraft attitudes when the geometry is favorable.
The Vesta HAMO-2 reference orbit is dawn_ref_120520-120609_100601_isb_hamo2.bsp. This trajectory is 20 days long and does not reflect the mission change that increased HAMO-2 from 40 to 41 orbits. The HAMO-2 orbit is designed to closely imitate the HAMO orbit in all aspects (altitude, period, etc.) except the beta angle, which is costly to reduce below the LAMO beta angle.
Figure 4-28 shows an overview of the HAMO-2 mapping strategy beginning with the three off-nadir mapping cycles and finishing with a nadir cycle. During Cycle 1, VIR acquires infrared only cubes beginning at the terminator, followed by a set of cubes using both the VIS and IR detectors. These data are then dumped out of VIR memory so that the VIR instrument can collect data in the pushbroom mode starting north of the equator. The framing camera collects clear filter images during Cycle 1 at an off-nadir ACN attitude of (8.0, 5.0). The FC image cadence is one image every 5 minutes in the equatorial region and once every eight minutes in the north and south regions. Off-nadir mapping continues in Cycle 2 at an ACN attitude of (-6.0, 2.0) with the same image cadences that were used during Cycle 1. VIR acquires VIS+IR cubes in the northern hemisphere, dumps the data to the spacecraft virtual recorder, and then switches to pushbroom mode in the south. Cycle 3 has VIR acquiring cubes in the northern hemisphere and pushbroom in the south while FC acquires clear filter images at an ACN attitude of (5.0 -2.0).
Figure 4-28. HAMO-2 timeline overview
Nadir imaging is deferred during HAMO-2 until the end of the phase in order to allow the sub-solar latitude to maximize. Cycle 4 includes clear and color filter imaging in the north. The "north" region is extended to the equator and the image cadence is increased to meet the overlap requirements of equatorial imaging. Filters F8, F3, F7, F4, and F5 are collected with lossless compression (1.8:1) and filters F2 and F6 are acquired with lossy compression at 3.6:1. In the equator and south regions, only clear filter images are acquired. VIR acquires data in pushbroom mode only in the neat equatorial region.
Figure 4-29 shows the combined HAMO-1 and HAMO-2 Stereo coverage. Color is used to show the number of images in each 1°x1° bin that meet the Stereo requirements which are: 1) incidence angle between 5° and 80°; emission angle less the 80°; stereo angle between 15° and 90°; and illumination variation between 0° and 15° (top) or 0° and 5° (bottom). The top panel shows that more than 87% of the surface is covered with at least four usable Stereo views while the bottom panel shows that nearly 90% of the surface is covered by at least three views with very low illumination variation. This later condition is critical to determining a high quality solution necessary to meet our Level-1 topography height requirement of 10m. The project conducted the Virtual Vesta study to verify that the imaging plan would satisfy the Level-1 requirements [Raymond et al, 2011]. The OpNav Team developed a simulated Vesta topography model and generated simulated images acquired at the times and illumination conditions planned in the HAMO-1 sequences. The simulated images were delivered to the topography investigators for analysis. The During the Virtual Vesta analysis, the Framing Camera Team demonstrated that they could achieve a mean height accuracy of 6 m over regions of the body where they had coverage with low illumination variation.
There are no occultations during HAMO-2. The VRs are sized the same as during HAMO-1 with a large OpNav VR allocation (1.0 Gb) that is used to store and downlink the clear filter images. Following HAMO-2, prior to departure, there will be a single downlink orbit. The primary purpose of this downlink orbit it to return color filter images acquired during Cycle 4 reducing the amount of data that must be returned during departure.
Figure 4-29. Combined HAMO-1 and HAMO-2 Stereo coverage
The filter imaging strategy may be altered to include the lossless compression of filter F2 and possibly even F6 if it is determined that the lossless compression ratio used earlier in the mission (1.8:1) was overly conservative. The duration of VIR data acquisitions in Cycles 1-3 may also be increased if the imaging data compress better than modeled.
During the Vesta departure phase, thrusting will be interrupted for about a day in order to obtain a final Vesta rotation movie at an altitude of 5000 - 6000 km similar to the RC3 observation. Time for this activity is currently allocated to the Vesta timeline but the details have not been planned in detail at this time. The goal of this observation is to obtain a final set of global images and VIR spectra of the newly illuminated northern hemisphere before leaving Vesta. Data will be acquired and returned to Earth before the virtual recorders are resized for the Vesta to Ceres cruise phase.
=================================================================================================
         Sub-phase                   Duration (days)     Beta Angle   Orbit Radius  Orbit Period
                                                            (deg)         (km)         (hrs)
=================================================================================================
Transfer from Ceres Arrival             16
to Ceres Survey Orbit

Ceres Survey Orbit                8 (1.75 orbits)            30           6400         112.4

Transfer from Survey Orbit to           65                  +10
High Altitude Mapping Orbit
(HAMO)

Ceres HAMO                        21 (30 orbits)             40           1800          16.8

Transfer from HAMO to Low               30                  +25
Altitude Mapping Orbit (LAMO)

Ceres LAMO                              30                   65           1180           8.9
-------------------------------------------------------------------------------------------------
TOTAL                                  170
=================================================================================================
Table 4-10. Ceres Orbit Sub-phases
The purpose of the Science Descope Plan was to establish a prioritization scheme for Vesta science observations in a quantified manner to facilitate decisions during mission re-planning which result from anomalous situations. A scheme based on the perceived ratio of cost to benefit of discrete sets of observations was developed and it applies during situations when the entire Vesta timeline is compressed due to anomalies that incur safings or require mission re-planning, or when the Science Plan is interrupted by extended periods of instrument malfunction. At the point where Level-1 science is threatened, the option of delaying Ceres arrival will be considered, as long as the delay does not threaten the length of the Ceres investigation.
The scheme is presented in terms of prioritized objectives in Section 5.1 as a tiered mission plan in Section 5.2, and as a detailed descope plan in Section 5.3.
Image mosaics at <100 m resolution covering 80% of Vesta in clear and 3 color filters (HAMO-1/HAMO-2)
More than 5000 high spatial/spectral frames with spatial resolution <800 m with frame-to-frame overlap (2-cycle Survey with HAMO-1)
Topographic map of 50% Vesta to 25 m height accuracy (2 off-nadir views in HAMO- 1 and -2 with non-optimal incidence/emission and/or Stereo angles)
Bulk elemental composition measurements of Vesta (30-day LAMO)
Gravity field of Vesta to degree 5 (30-day LAMO)
Hemispheric elemental composition maps (<50-day LAMO)
Gravity field to degree 10 (50-day LAMO)
More than 10000 high spatial/spectral frames with spatial resolution <800 m with frame-to-frame overlap (4-cycle Survey with HAMO-1)
Image mosaics covering 95% of Vesta in clear and 6 color filters (HAMO-1 and -2)
Spatially-resolved elemental composition maps including the composition of the south polar basin (70-day LAMO)
Topography map to 10 m accuracy (min 5 off-nadir views with varying illumination angles and solar azimuth/elevation viewing angles)
--------------------------------------------------------------------------------
Tier 1: Minimum Mission Success Data Set (maximum descope): achieve two orbits
of Survey; 3 cycles of HAMO-1 mapping; 30-day nominal LAMO; and at least one
cycle of mapping in HAMO-2

      1) Collect >5000 high spatial/spectral frames with 20% frame-to-frame
      overlap
      2) Obtain image mosaics covering 80% of the Vesta surface at nadir in the
      clear and three color filters, and at least 50% of the surface with nadir
      and two off-nadir views in the clear filter
      3) Obtain disk-integrated surface elemental composition
      4) Obtain gravity field to degree 5 (<180 km half-wavelength) \
      5) Obtain nadir imaging with 3 color filters of the northern polar region

--------------------------------------------------------------------------------
Tier 2: Tier 1 with 40-day nominal LAMO

      3a) Obtain hemispheric surface elemental composition maps
      4a) Obtain gravity field to degree 10 (<90 km half-wavelength)

--------------------------------------------------------------------------------
Tier 3: Tier 2 with at least four orbits of Survey

      1a) Collect >10000 high spatial/spectral frames with frame-to-frame
      overlap

--------------------------------------------------------------------------------
Tier 4: Tier 3 plus three cycles of HAMO-2/four cycles of HAMO-1

      2a) Obtain image mosaics covering 95% of Vesta in clear and 6 color
      filters and at least 70% of the surface with nadir and two off-nadir views

--------------------------------------------------------------------------------
Tier 5: Tier 4 plus 70-day nominal LAMO
      3b) Spatially-resolved elemental composition maps including the
      composition of the south polar basin

--------------------------------------------------------------------------------
Tier 6: Tier 5 plus 4 cycles of HAMO-2/6 cycles of HAMO-1

      3c) Obtain coverage of at least 80% of the surface with nadir and five
      off-nadir views with incidence angles >10 deg and stereo-pair angular
      separation of at least 10 deg

--------------------------------------------------------------------------------
Tier 7: Tier 6 plus six-cycle Survey orbit (nominal Science Plan)

      1a) Collect > 15000 high spatial/spectral frames at <800 m spatial
      resolution with frame-to-frame overlap

--------------------------------------------------------------------------------
Tier 8: Tier 7 plus 90-day LAMO orbit (enhancement)

      3c) Obtain higher precision spatially-resolved elemental composition maps
Steps in blue endanger Level-1 required data [denoted by *B*]
Steps in red sacrifice Level-1 required data [denoted by *R*]
   ==================================================================
   Vesta Science Descope Actions                       Time Saved
   ==================================================================
   Shorten HAMO-2 to 3 mapping cycles (remove C3)      +5.0 days
   Shorten HAMO-2 to 3 mapping cycles (remove C3)      +5.0 days
   Shorten HAMO-1 to 5 mapping cycles (remove C5)      +5.0 days
   Shorten HAMO-1 to 4 mapping cycles (remove C6)      +5.0 days
   Shorten LAMO to 60 days                             +10. days
   Shorten LAMO to 50 days                             +10. days
   Shorten LAMO to 40 days *B*                         +10. days
   Shorten HAMO-2 to 2 mapping cycles (remove C2) *B*  +5.0 days
   Shorten HAMO-1 to 3 cycles (one nadir) *R*          +5.0 days
   Shorten HAMO-2 to one cycle, nadir (remove C1) *R*  +5.0 days
   Shorten LAMO to 30 days *R*                         +10. days

   Total before Level-1 sacrifice                      +46 days
   Total with Level-1 sacrifice                        +35 days
   ------------------------------------------------------------------
   Grand Total                                         +81 days
   ==================================================================
Table 5-1. Science Descope Plan for Mission Re-plan.
The mechanism developed by the DSC to communicate activity-level information to the Instrument and Science Teams is the Science Time-Ordered Listing spreadsheet (SCItol). The spreadsheet is created in Excel with a format defined by the Dawn Science Time-Ordered Listing Software Interface Specification. Prior to each instrument sequence development phase the SCItol is generated to capture all elements of the sequence design. The SCItol allocates observation time as well as time for all other ancillary instrument functions. The level of detail in the SCItol is at the sub-activity level since each activity needs to be broken into individual components to enable modeling and instrument commanding. Data volume in both instrument memory as well as the spacecraft DRAM is modeled at a high level. The spreadsheet is ingested by the instrument team uplink software and provides the framework for the automatic production of the instrument sequence files. The primary fields in the spreadsheet are as follows:
Activity Absolute Start Time (SEQGEN format for Spacecraft Event Time)
Activity Absolute End Time (SEQGEN format for Spacecraft Event Time)
Sequence ID for the file containing those commands
Activity Absolute Start Time (Excel format)
Activity Absolute End Time (Excel format)
Activity Relative Start Time (hh:mm:ss from the relevant epoch)
Activity Relative End Time (hh:mm:ss from the relevant epoch)
Activity Duration (hh:mm:ss)
Activity Name (following the convention <instrument>_<mission sub-phase>_ <cycle><Description>_<repetition number>
An example of the set of SCItol entries to define a standard OpNav activity in the Vesta Transfer to HAMO-1 mission sub-phase is as follows:
* A spectral frame is defined as a two dimensional array with a line of spatial pixels in one dimension and an array of spectral samples in the other dimension.